Dataset
Dataset
Dataset
A dataset, also referred to as a cube in OLAP analysis, includes predefined queries, dimensions, measures, aggregation expressions, dynamic time ranges, data permissions, and more. When the data model is relatively stable, defining a dataset reduces the repetitive work of writing query scripts and creating aggregation expressions for different reports that share the same underlying model.
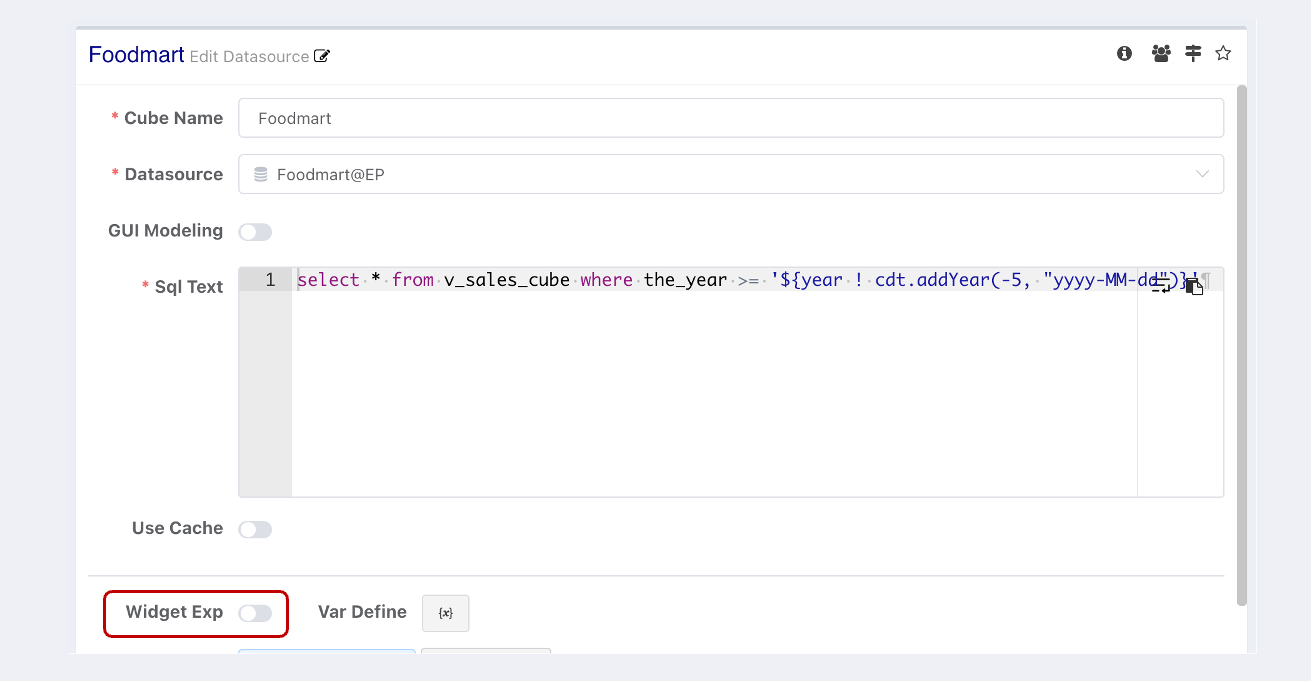
Datasets in Easy Pivot are agile, lightweight models. Any simple query output can serve as a cube, and modifying a cube avoids the cumbersome process of conventional data modeling, modification, and publishing. For example, suppose the first business requirement calls for columns like region, department, product_category as aggregation dimensions to build a Cube:
SELECT
   region, department, product_category
FROM sales_fact f
JOIN dim_region dr ON ...
JOIN dim_product dp ON ...
Later, when new requirements arise that need dimension columns like customer_segment, sales_channel, and payment_method, conventional reporting tools would require re-importing tables, updating model definitions, and re-publishing. At this point, the advantage of a lightweight model becomes apparent — you only need a simple modification, or you can copy the previous model and adjust the query:
SELECT
   region, department, product_category,
   customer_segment, sales_channel, payment_method
FROM sales_fact f
JOIN dim_region dr ON ...
JOIN dim_customer dc ON ...
Tip
You can even change the data source or completely rewrite the query, as long as all fields used in the old query are also returned by the modified query.
Dataset Definition
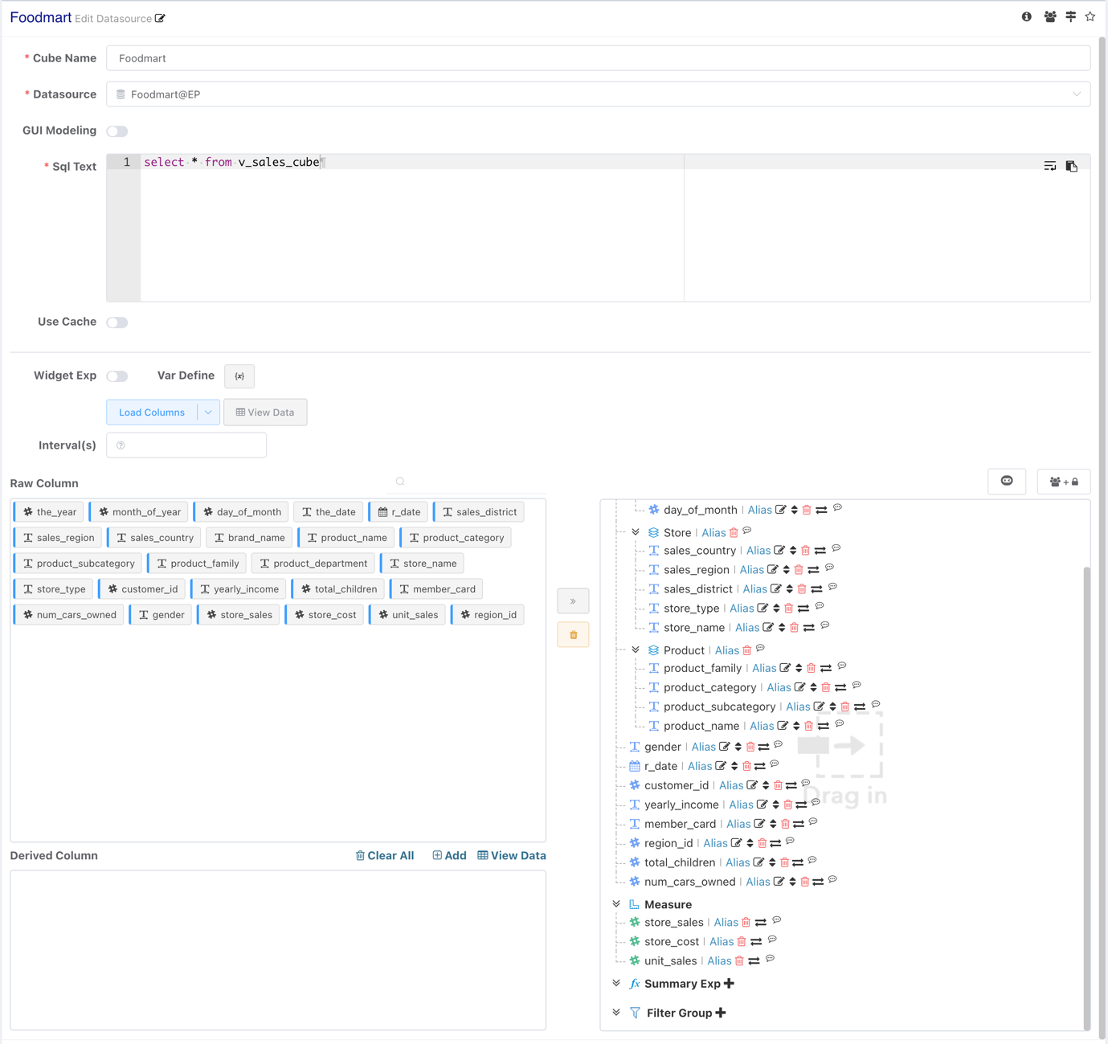
A dataset's schema includes Dimensions, Measures, Summary Expressions, and Filter Groups.
- Select a data source and fill in the corresponding query script (an SQL query for JDBC data sources) to read data.
- After successfully reading data, the
Raw Columnslist and an empty Schema tree appear at the bottom of the page. - Drag columns to the dimension list or measure list on the right. You can also quickly add columns to the Schema by clicking the
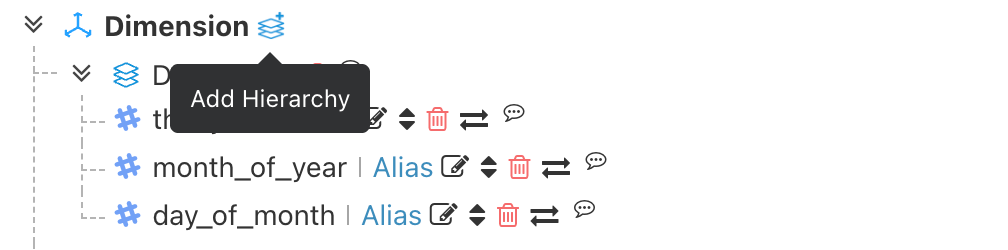
Raw Column Buttonon the left; by default, they are added to the measure list if data type is number or other added to dimension list. - A column can be used multiple times under different dimension hierarchies, e.g.,
- Year → Month → Day
- Year → Week → Day
- Columns added to the Schema tree can be edited to modify their alias.
- Hierarchies are the basis for chart drill-down and roll-up paths.
- Summary expressions and Filter groups are created by clicking
Add New.
Modeling Suggestion
Suggestion
We recommend that technical personnel with data warehouse modeling experience perform dimensional modeling. After the model is built, it can be handed over to non-technical or business users for self-service analysis and dashboard design. The benefit of this approach is that professionals centrally manage the model, delivering models that are more suitable for later multi-scenario reuse and analysis, with more controllable query performance.
In Easy Pivot, datasets function as agile, lightweight models where any simple query output can serve directly as a Cube, eliminating the cumbersome process of conventional data modeling, modification, and publishing. This flexibility means that when new business requirements emerge, you can easily extend dimension columns through simple modifications or by adjusting previous queries, without needing to re-import tables, update model definitions, and re-publish.
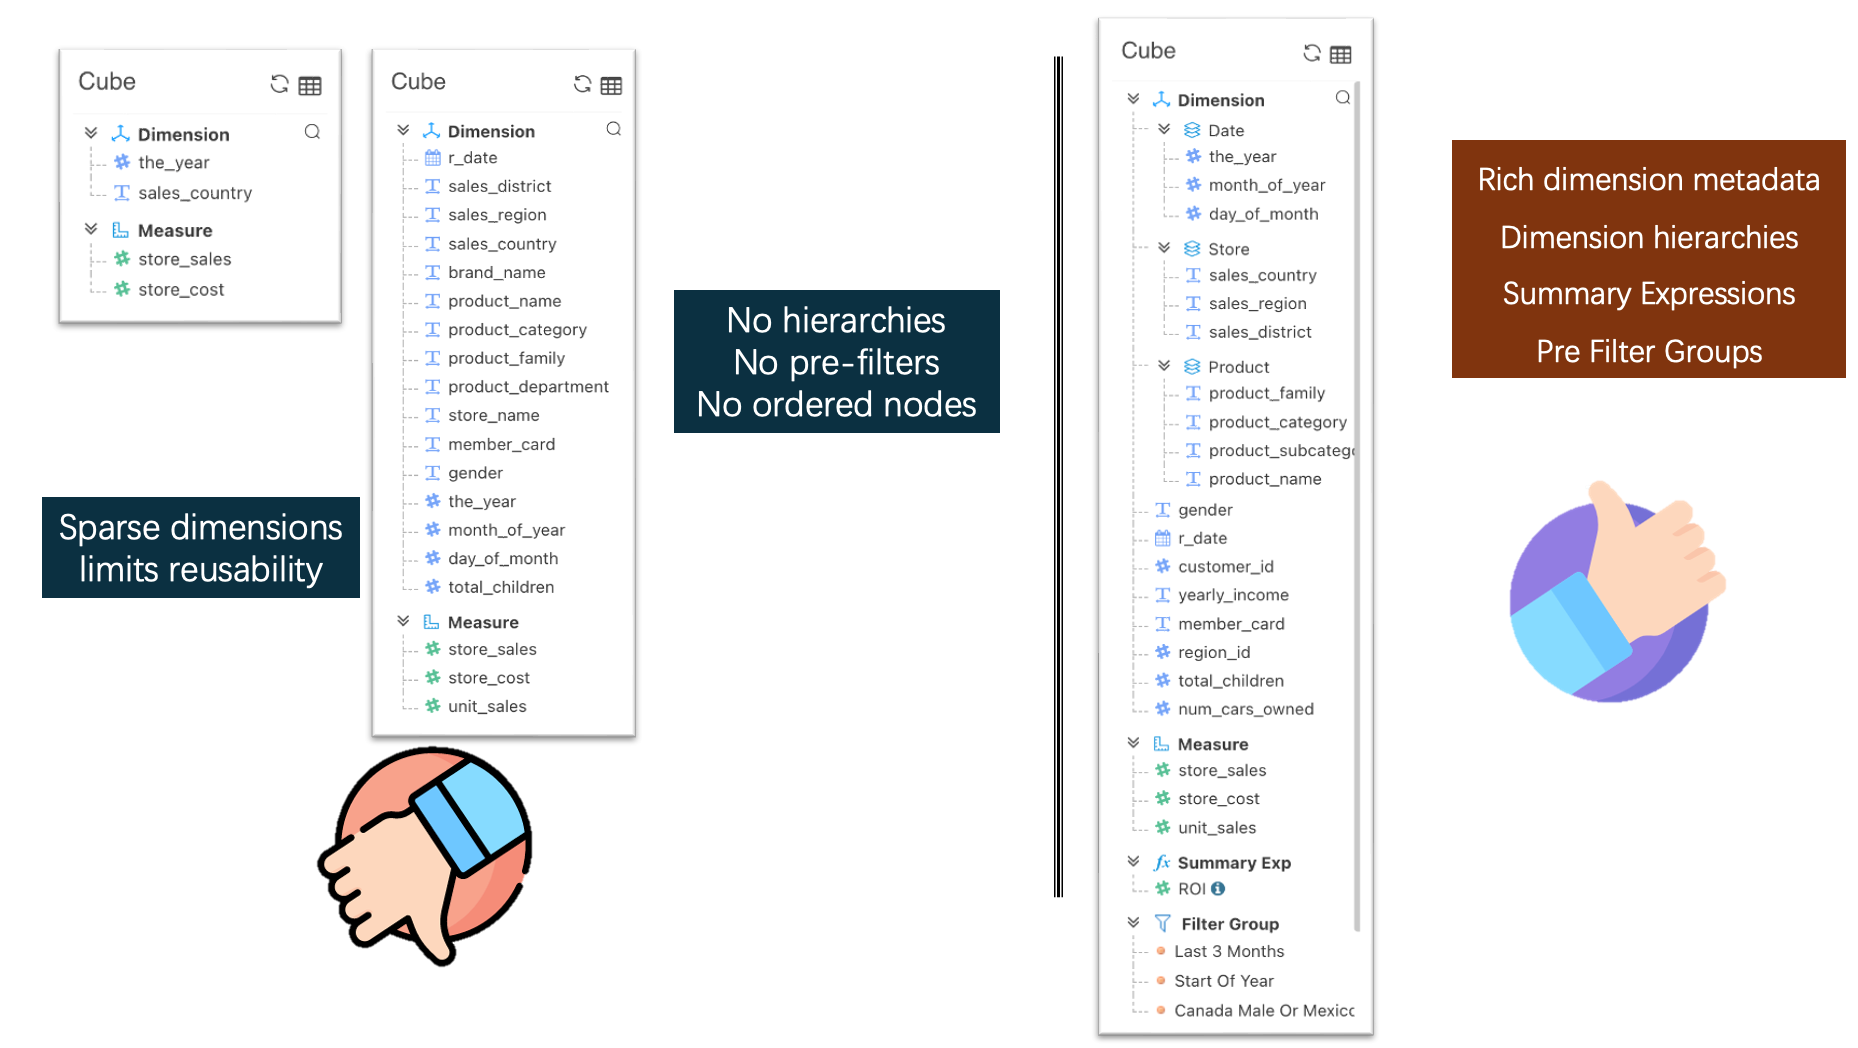
However, to fully maximize the potential of these models, you should avoid using flat designs that lack hierarchies and pre-filters, as sparse, unorganized dimensions severely limit a model's reusability. Instead, building a well-structured semantic layer drastically improves the cube's usability, clarity, and value for business users.
Best practices for organizing your Cube include:
- Contextual Grouping: Logically grouping dimensions into folders based on their context.
- Dimension Hierarchies: Nesting dimensions logically to allow users to easily drill down into the data.
- Summary Expressions: Including a dedicated section for pre-calculated business metrics.
- Pre-Filter Groups: Offering ready-to-use filters to significantly speed up reporting and analysis for end-users.
Dimension Hierarchy
Dimension hierarchy is the basis for chart drill-down and roll-up along a fixed path. It is commonly used for drill-down operations in cross-tables, bar/line charts, and pie charts.
Group-Dim Members
Raw data columns can be reused multiple times in the dataset schema. Besides defining different drill-down dimension hierarchies, you can also create different custom dimension groupings for the same column.
The example below demonstrates grouping months into First Half / Second Half using different methods.
Of course, this example is simply for functional demonstration; real-world data might already include first/second half information.
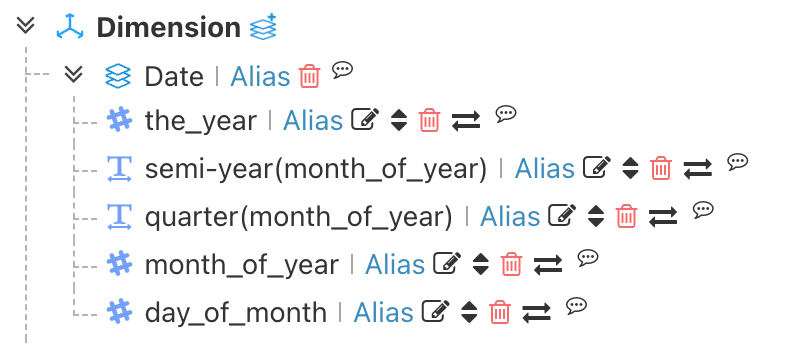
- Click the
Edit buttonon the dimension node to open the custom dimension dialog.
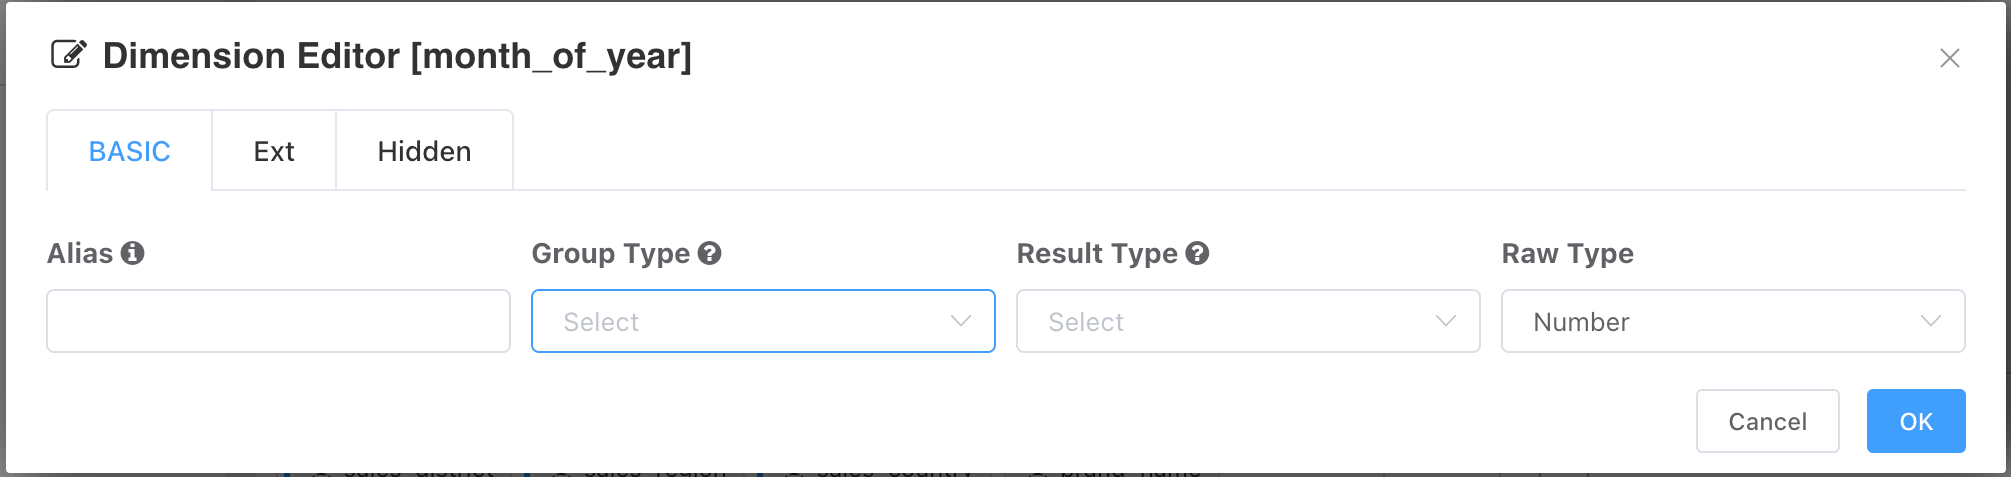
List Group
Select List for Group Type. List grouping is suitable for grouping string-type dimensions.
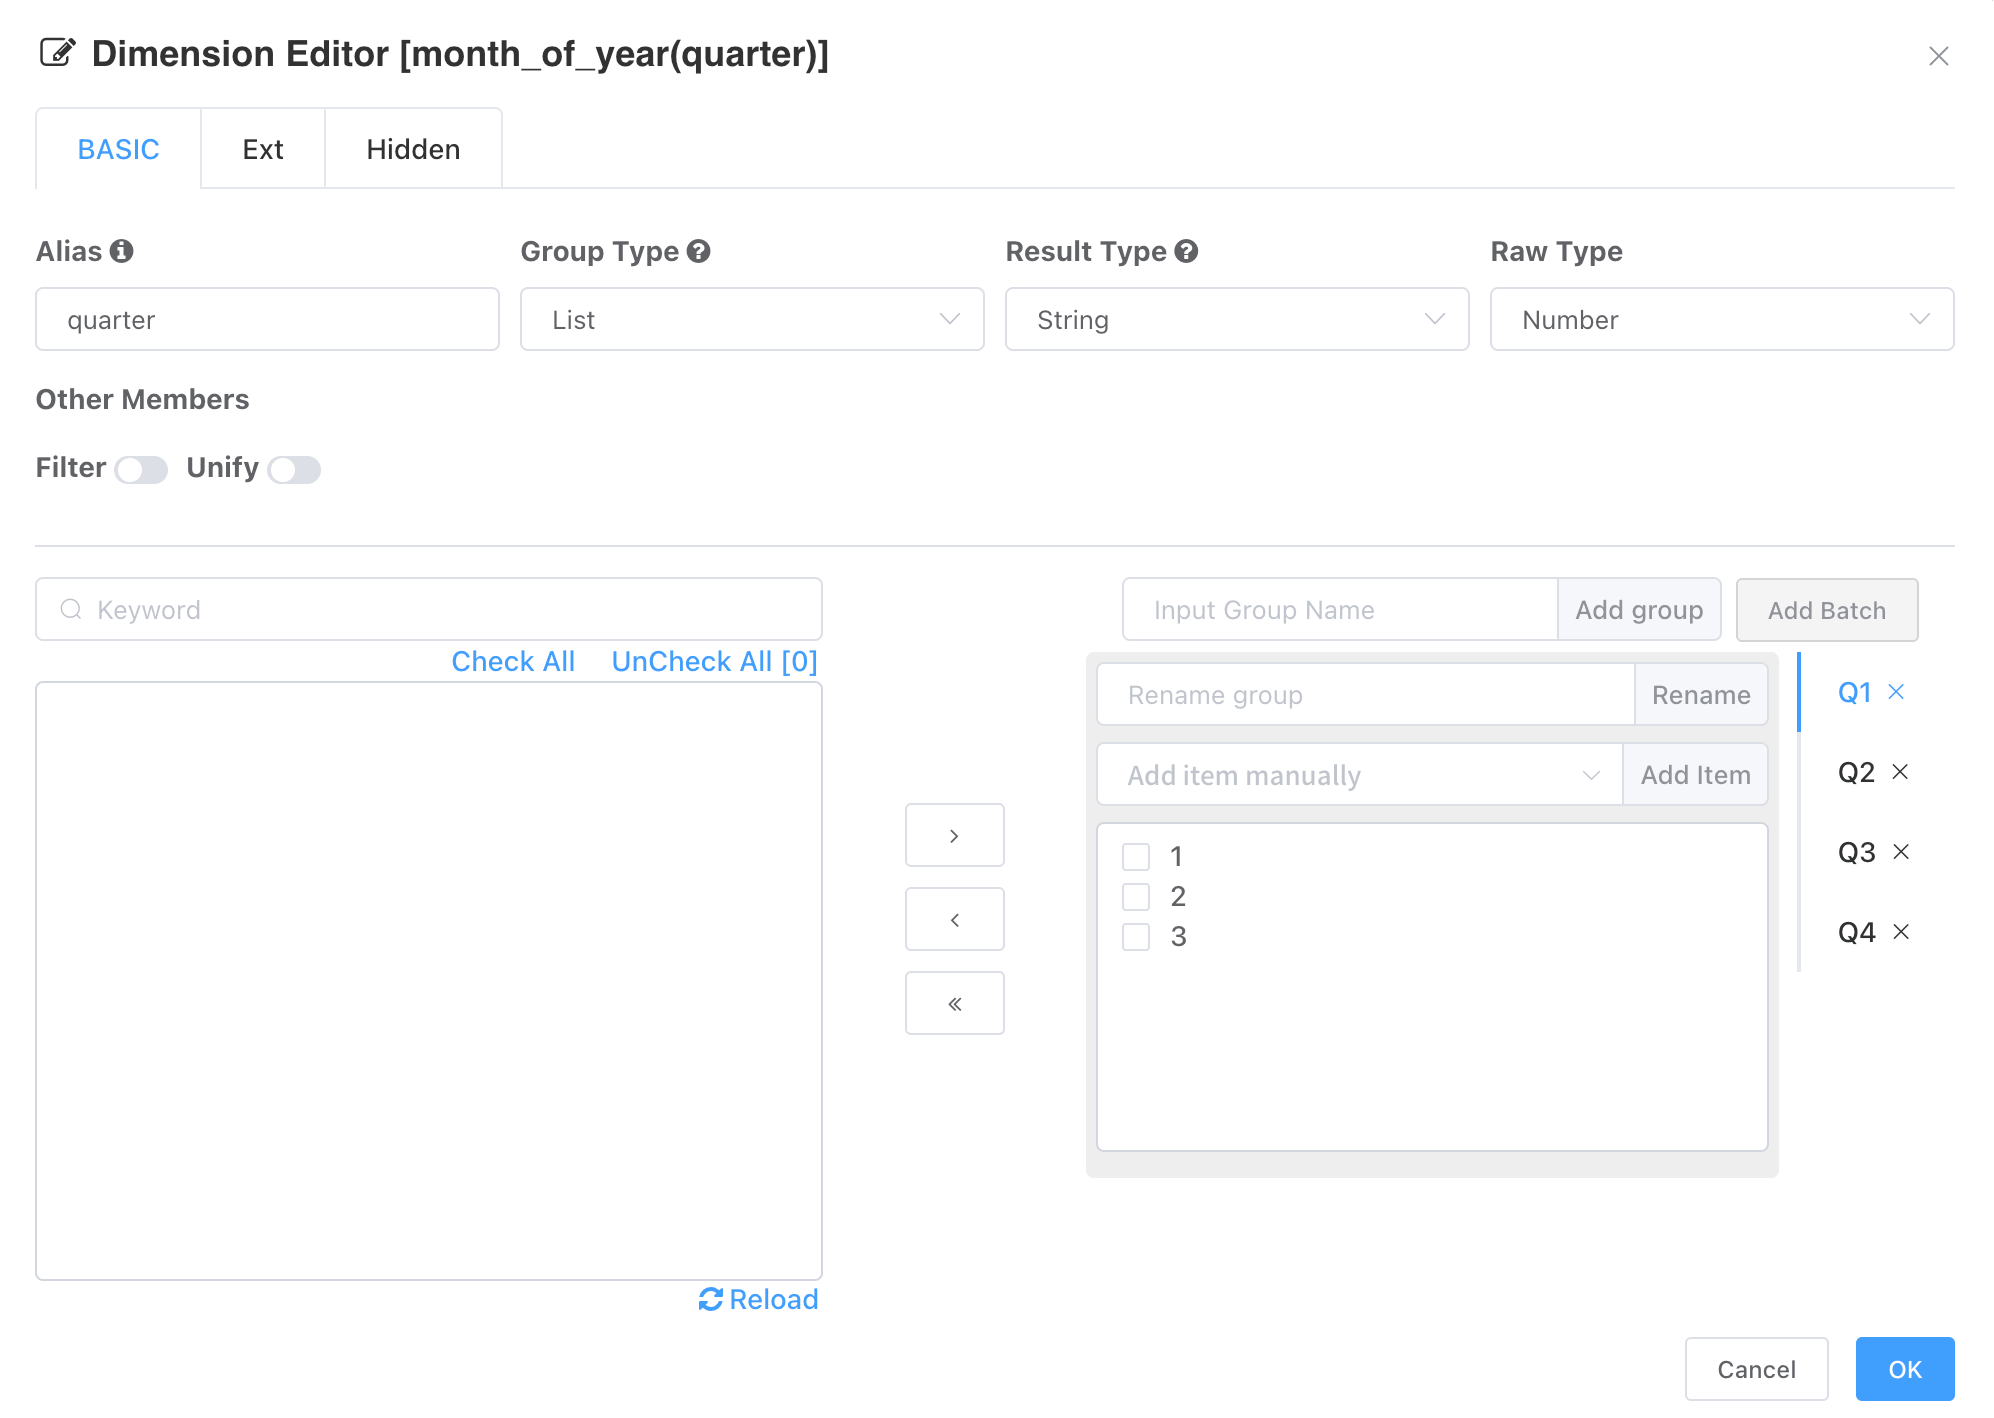
The left column lists the values from the raw data column, and the right column defines the groups.
- Enter an alias.
- In the top input box of the right column, enter a group name and click Add Group.
- Activate the group tab, then rename the group and define its members. You can manually enter member values — this is convenient when the group members are few and easy to list, or when the column has a large result set making it impractical to browse all values.
- Values not belonging to any group will be categorized as
Other Group. - Grouping a dimension often changes the original column's data type. To ensure the server generates correct query scripts, it is best to specify the
Data Typeafter grouping in the first row of the dialog. If not specified, it defaults to string. - After editing groups, click Save; Cancel discards the current edits.
Range Group
Select Range for Group Type. Range grouping is suitable for grouping numeric-type dimensions.
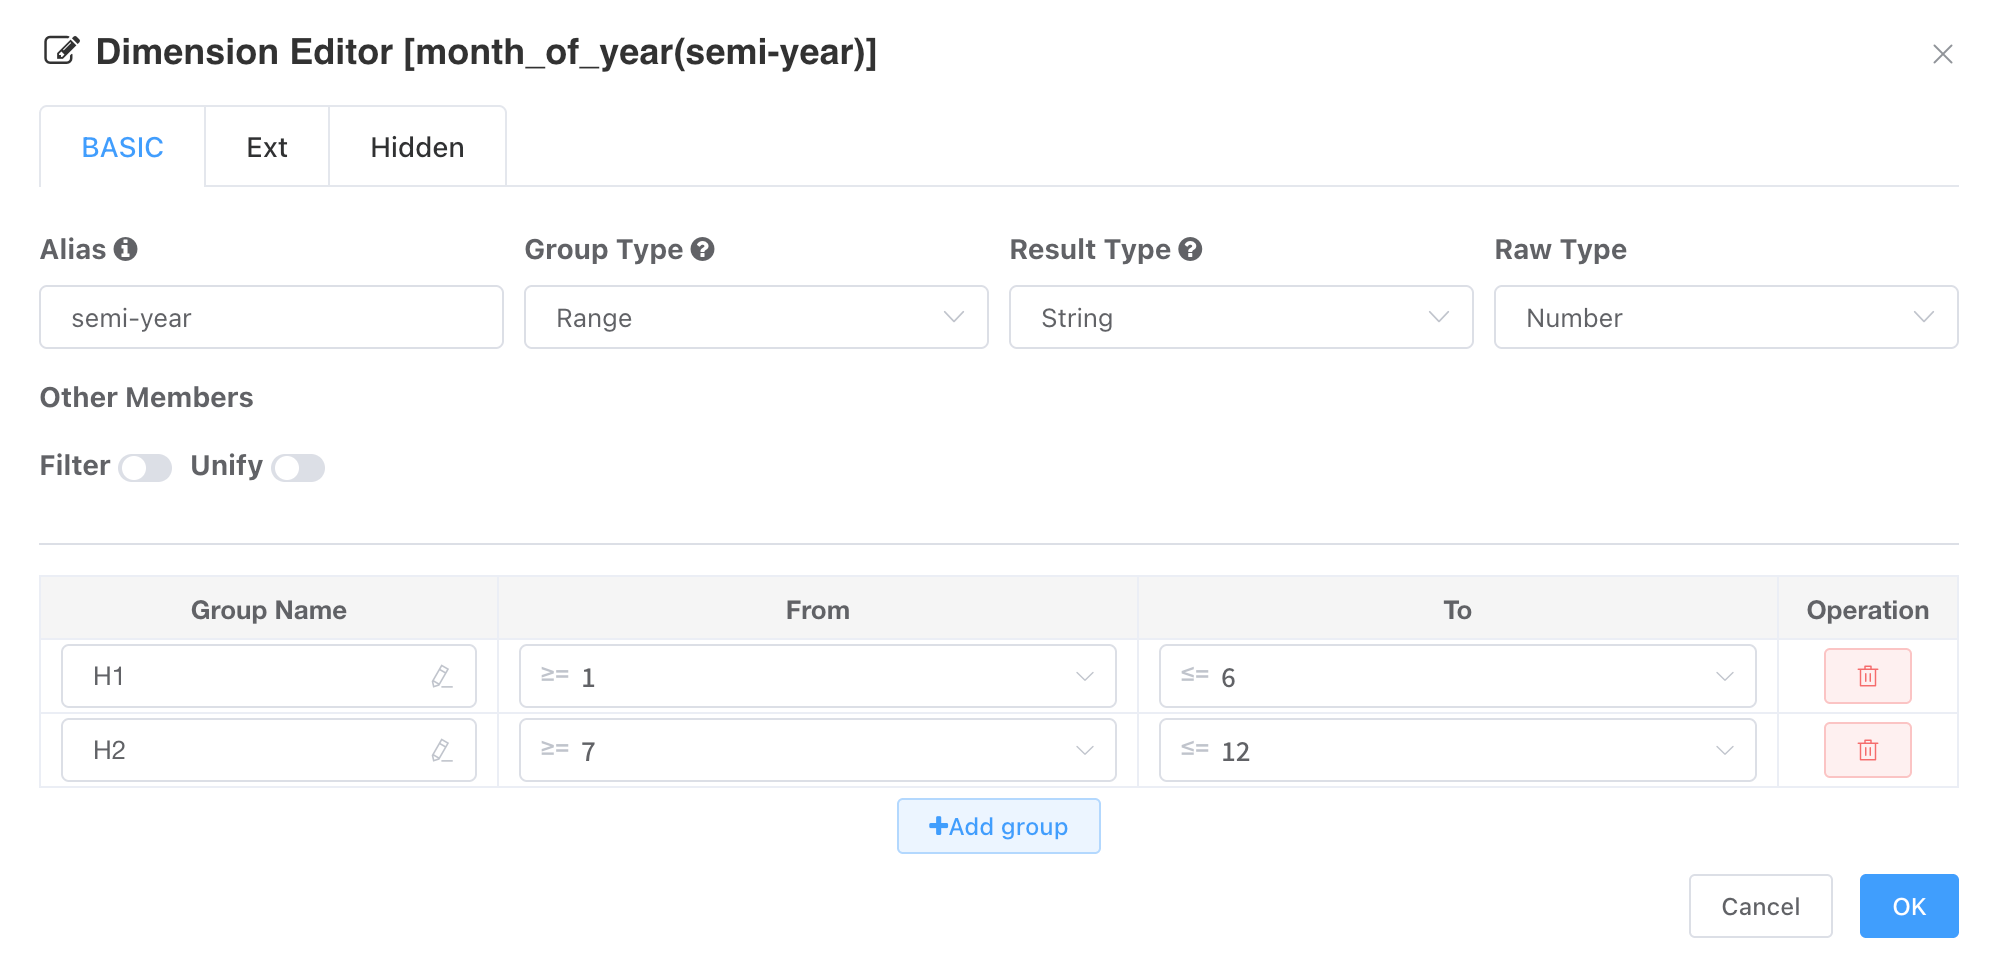
- Enter an alias.
- Select the data type after grouping. Here, we change the original numeric months 1–12 to the two text members
First HalfandSecond Half, so choose character as the data type. - Add Group
- Edit the group name,
Fromvalue, andTovalue. Note that the grouping interval is inclusive (both bounds included). - Save when done.
Script Group
Select Script for Group Type. Script grouping is suitable for users familiar with SQL, allowing the definition of arbitrarily complex groups.
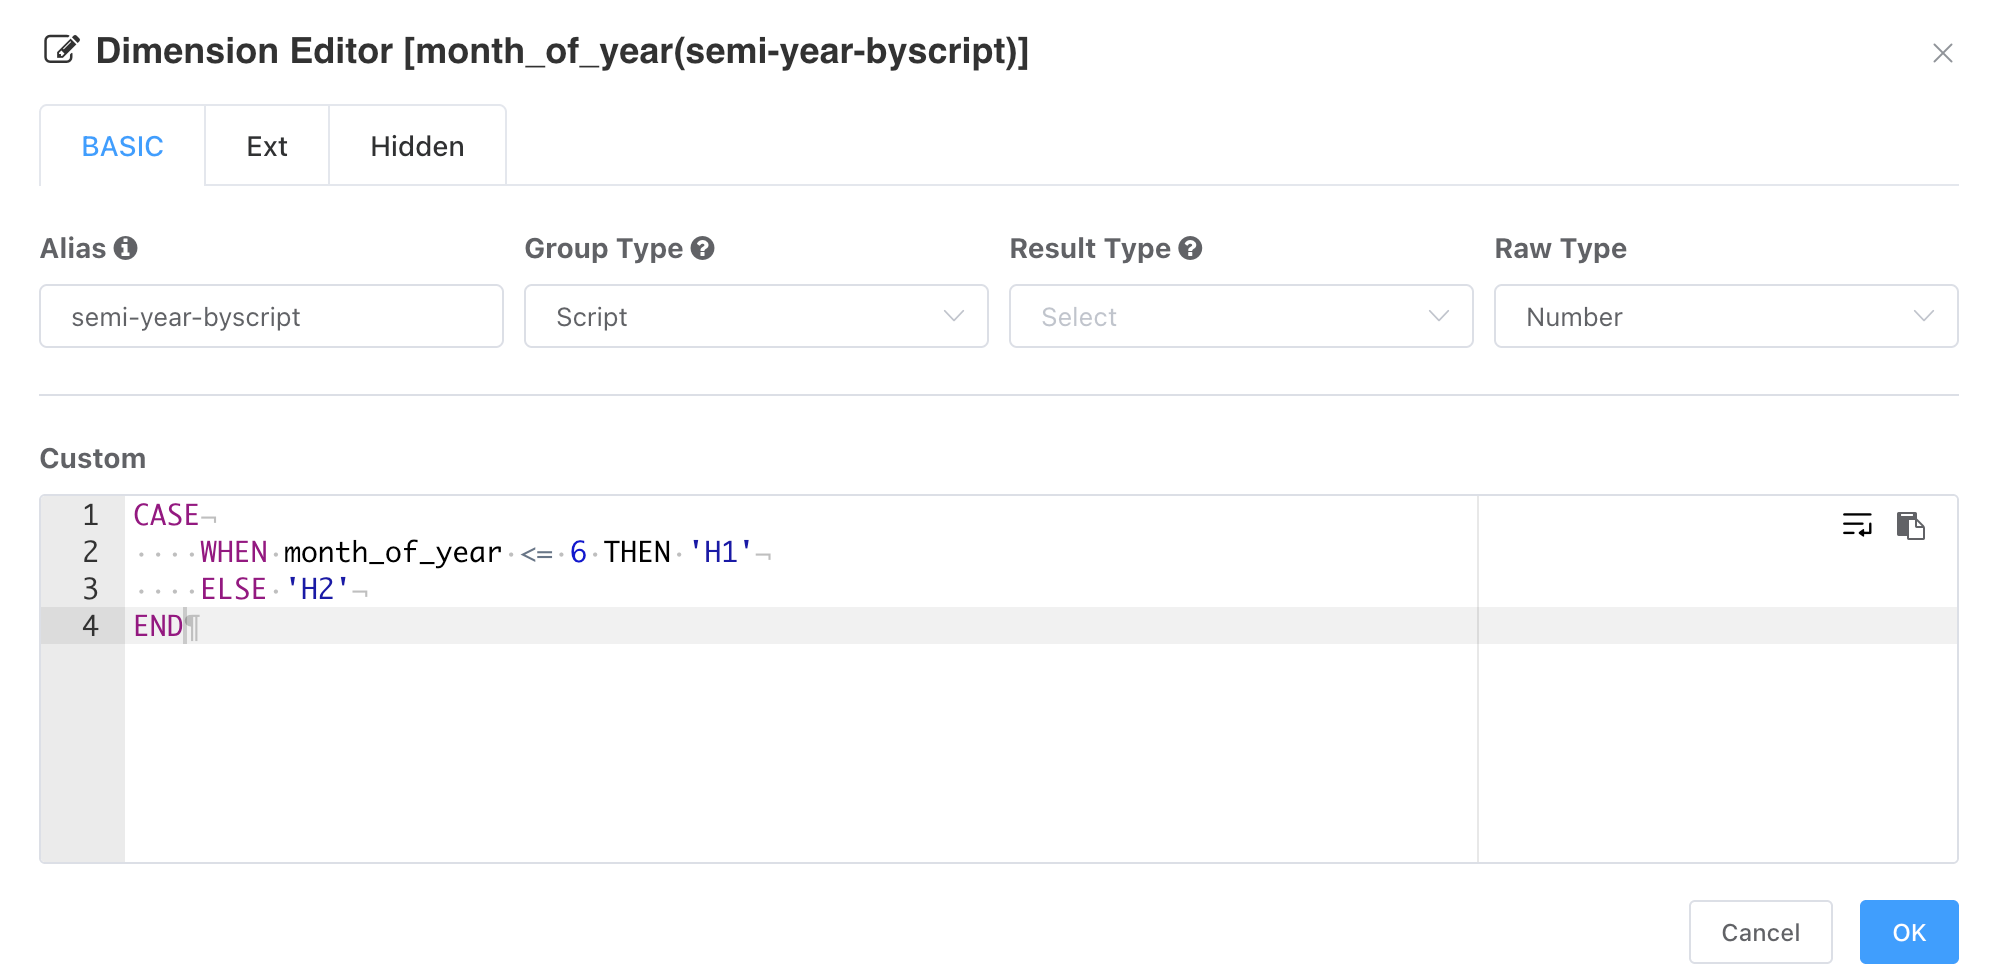
Important
Grouping scripts do not need to specify an alias.
Non-Group Members
For dimension members outside any defined group, you can configure how they are handled.
The default behavior is to keep the original value. You can also choose to replace them with a unified value.
If non-group members should not be displayed or counted, you can filter them out.
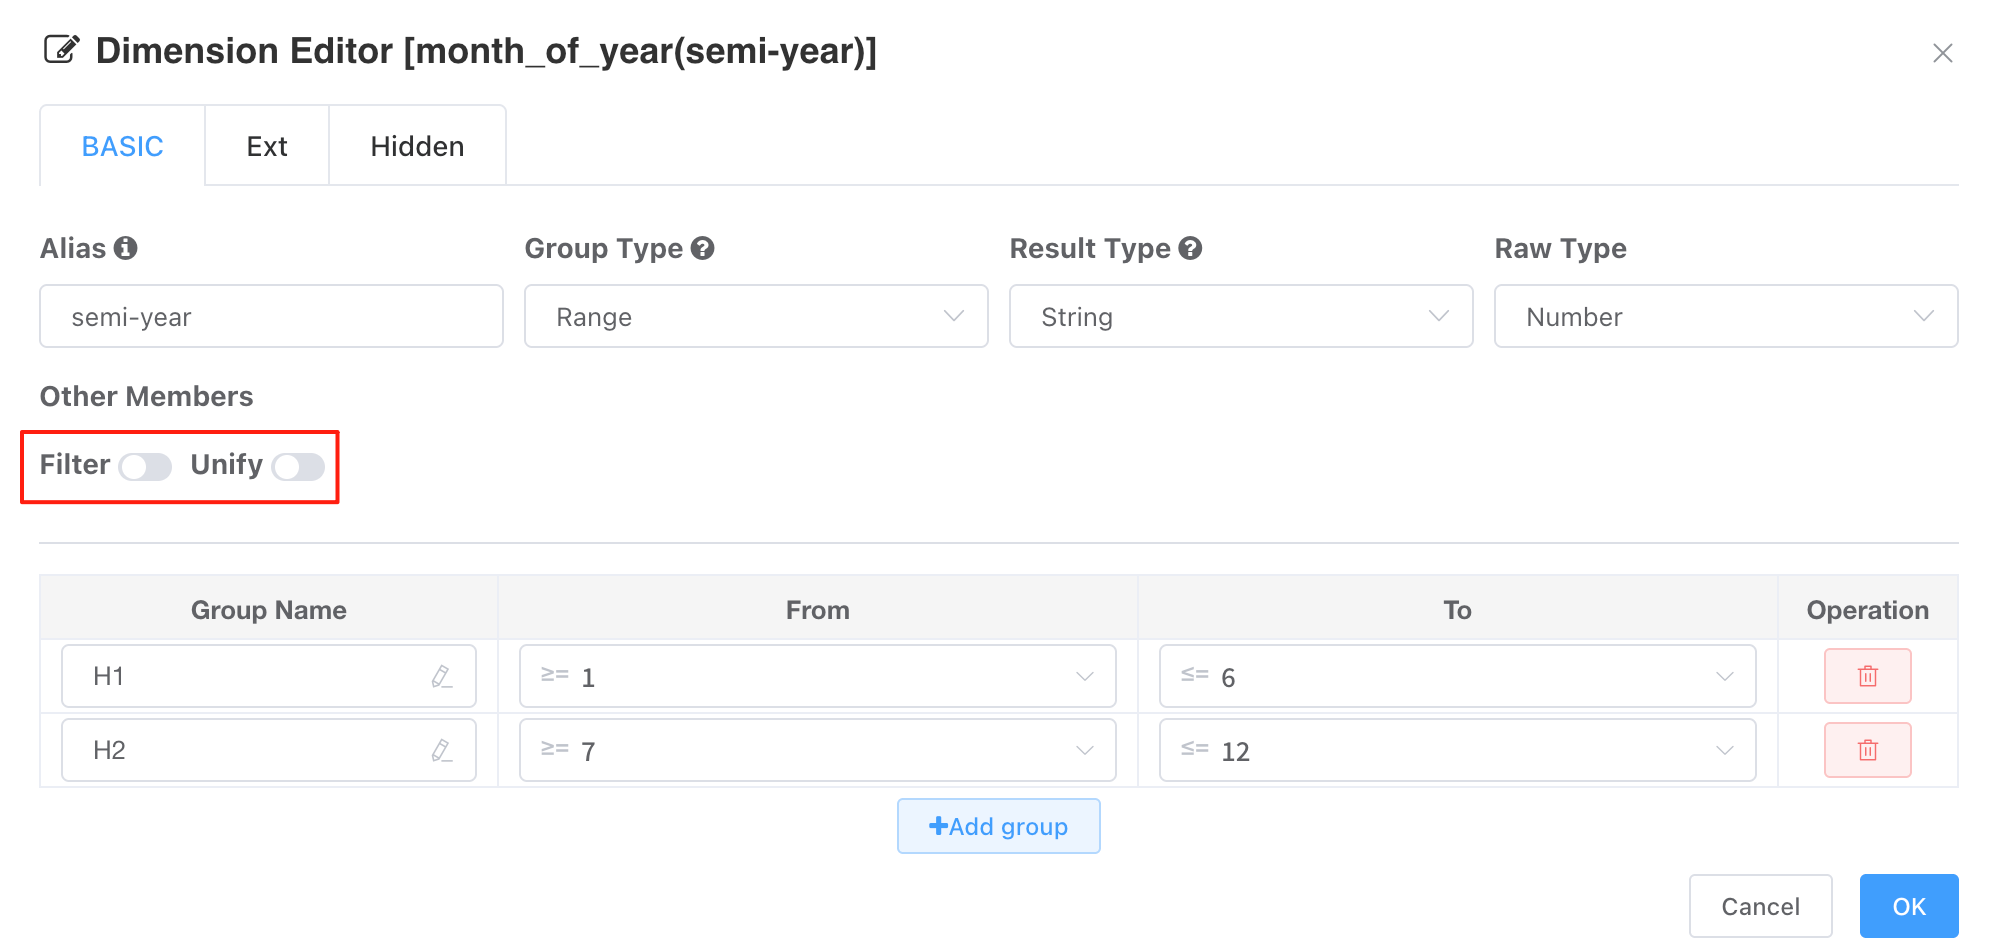
Important
If the data type of a derived dimension is inconsistent with the original field's data type, ClickHouse will report an error. For example, if a CASE branch contains both strings and numbers, and the database has not performed compatibility handling, it will cause an error. The solution is to set a unified value for non-group members or filter them out.
SELECT
    `the_year` AS c_0,
    CASE
        WHEN `month_of_year` IN (1, 2, 3) THEN 'First Half' -- String type
        ELSE `month_of_year` -- Numeric type
    END AS c_1,
...
SQL Error [386] [07000]: Code: 386. DB::Exception: There is no supertype for types String, Int8 because some of them are String/FixedString and some of them are not;
Dimension Dictionary
Dimension dictionary configuration is located in Dataset Edit → Dimension Node Advanced Settings → Dimension Dictionary (formerly Dimension Optional Value Query).
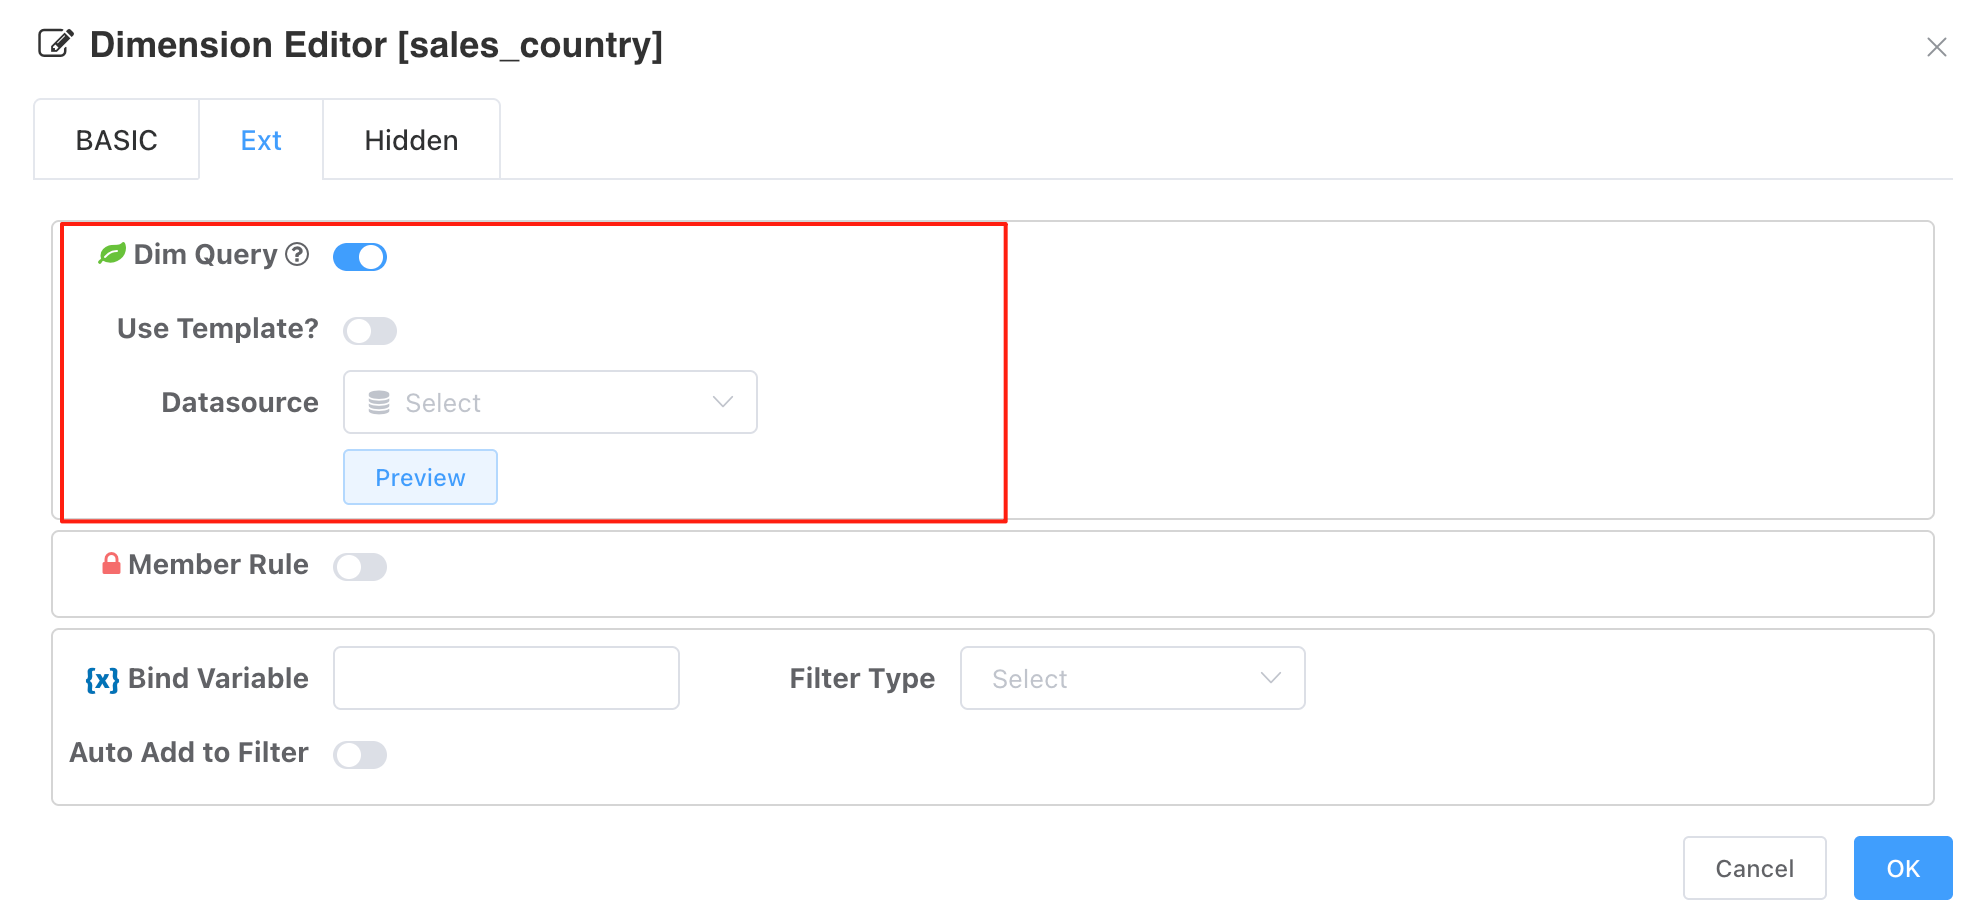
- Supports many-to-one mapping.
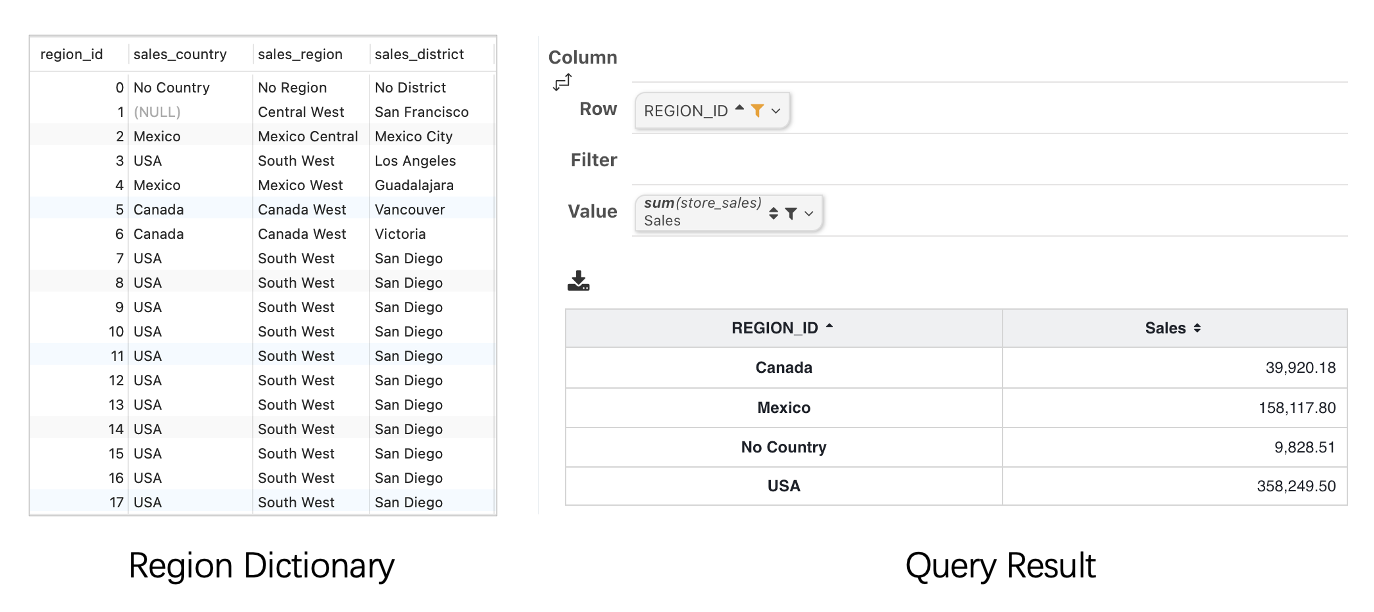
Aggregated Data Query
Configuring a dimension dictionary does not change the structure of the summary query.
From the case above, you can see that the aggregation field is still region_id, and region_id has a many-to-one relationship with country (multiple region_id values correspond to the same country).
The summary query aggregates by region_id, but the data engine performs an additional aggregation calculation based on this to achieve aggregation at the granularity of the dictionary-mapped value sales_country.
SELECT `REGION_ID` AS c_0,
       SUM(`store_sales`) AS v_0
  FROM (
  -- dataset view
) cb_view
WHERE `REGION_ID` NOT IN (1)
GROUP BY `REGION_ID`
Cross-Database / Cross-Source Association
Dimension dictionary queries can come from a different data source. Therefore, dimension dictionaries can be used to implement cross-database and cross-source data associations. A typical scenario is mapping dimensions from an Elasticsearch dataset to a dictionary table in a relational database.
Dictionary Filtering
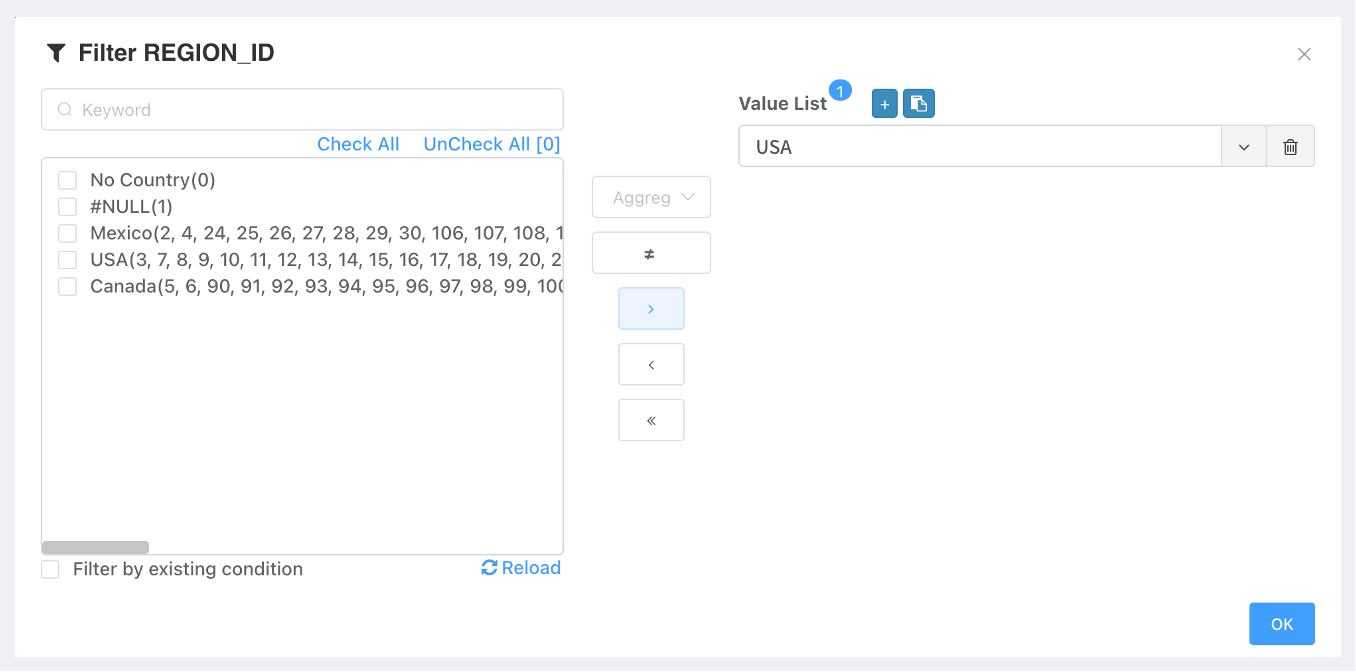
For dimensions configured with a dimension dictionary, when filtering, the dimension members are displayed grouped according to the mapping result.
The selected values are the mapped values. The multidimensional analysis engine converts the mapped values back to the original values for filtering.
Users can also directly input raw values as selected values.
If the input filter value has no mapping relationship in the dictionary table, no mapping is performed, and the original value is used directly for filtering.
SELECT `REGION_ID` AS c_0, `sales_region` AS c_1,
       SUM(`store_sales`) AS v_0
  FROM (
-- dataset view
) cb_view
WHERE `REGION_ID` NOT IN (3,7,8,9,10,11,12,13 ....)
GROUP BY `REGION_ID`, `sales_region`
Summary Expressions
Dataset calculation expressions are primarily used for secondary computation on already-aggregated data — that is, performing further calculations based on the results of initial aggregations.
Key Aggregation Functions:
- sum(
col): Computes the total of a numeric column, such as summing all store_cost to get total expenses. - count(
col): Counts the number of non-null entries in a column. For example, count(unit_sales) counts how many sales records exist. - avg(
col): Calculates the average value of a numeric column, equivalent to sum(col)/count(col). - max(
col) / min(col): Retrieves the highest or lowest value in a column. - distinct(
col): Equivalent tocount(distinct col)in SQL, which counts the number of unique, non-duplicate values in a column. For example, distinct(gender) counts how many unique gender categories exist in the dataset.
-
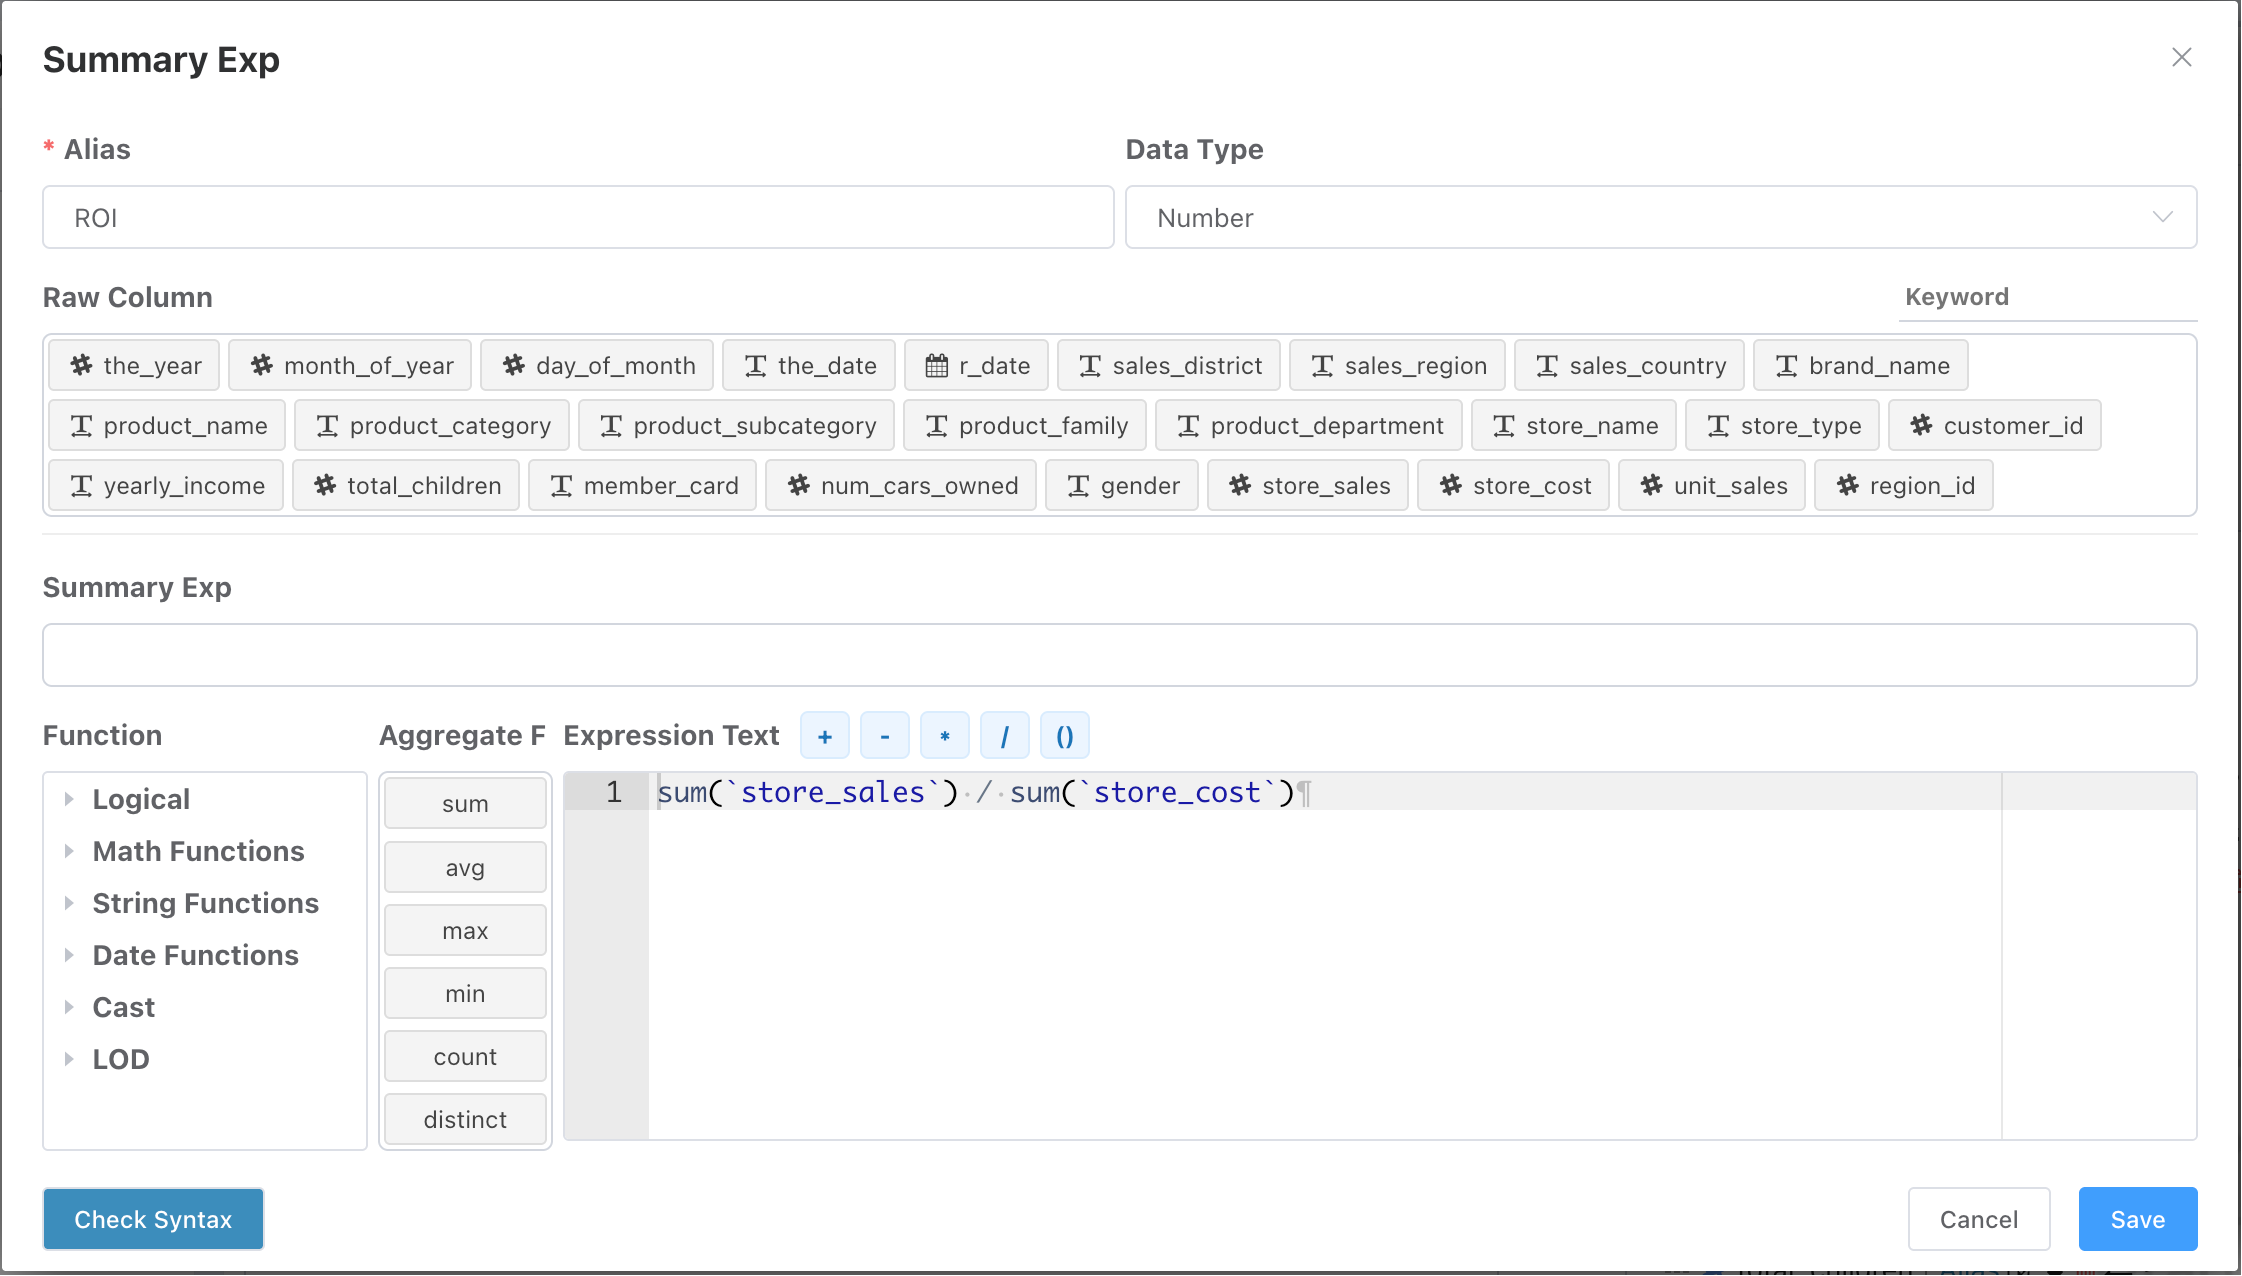
Write and test the aggregation expression. Expressions are used for calculations after aggregation. For example:
sum(store_sales)/sum(store_cost) -
Input Assistant:
- When writing expressions, you can click to select columns and functions from the
Raw ColumnandFunction Treepanels to assist input. - Expressions can reference already-defined expressions. When referencing defined expressions from
Summary Exp, ensure there are no circular references, which would cause infinite parsing loops.
Important
Fields used in Summary expressions must be wrapped with aggregation functions; otherwise, the unaggregated field will affect the aggregation granularity and cause calculation errors.
For example, if a dimension uses year, the corresponding SQL aggregation is GROUP BY year. If an aggregation expression references a field not in the GROUP BY clause, the query becomes incorrect.
-- Correct
SELECT year, SUM(cost)
  FROM t
GROUP BY year

-- Incorrect
SELECT year, unit * SUM(cost)
  FROM t
GROUP BY year- Predefined aggregation expressions in datasets cannot be modified during chart design.
SQL's count distinct
distinct(col) in expressions is equivalent to count(distinct col) in SQL. Writing count(distinct col) directly is incorrect syntax in this context.
Conditional Aggregation
count(case when col > 10 then 1 else 0 end) is supported by default.
Predefined Filter Group
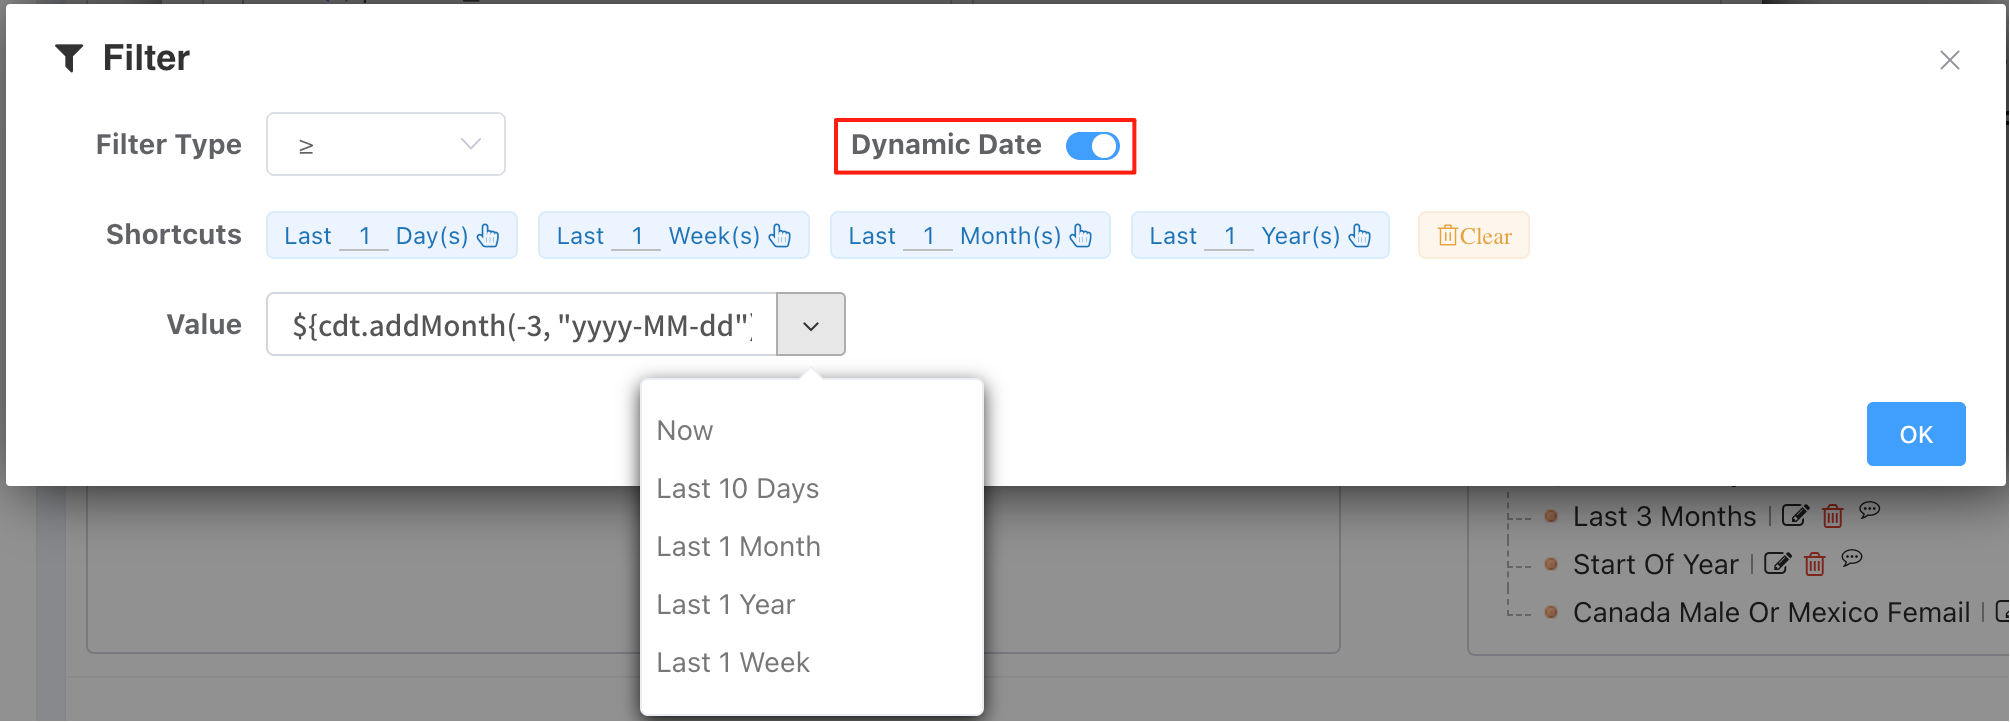
Dynamic Date Range
You can use Filter Group to predefine dynamic date windows. Click the dropdown to select a dynamic time expression template. Values in the template are editable, allowing you to modify them to any desired time window size.
Filters Group
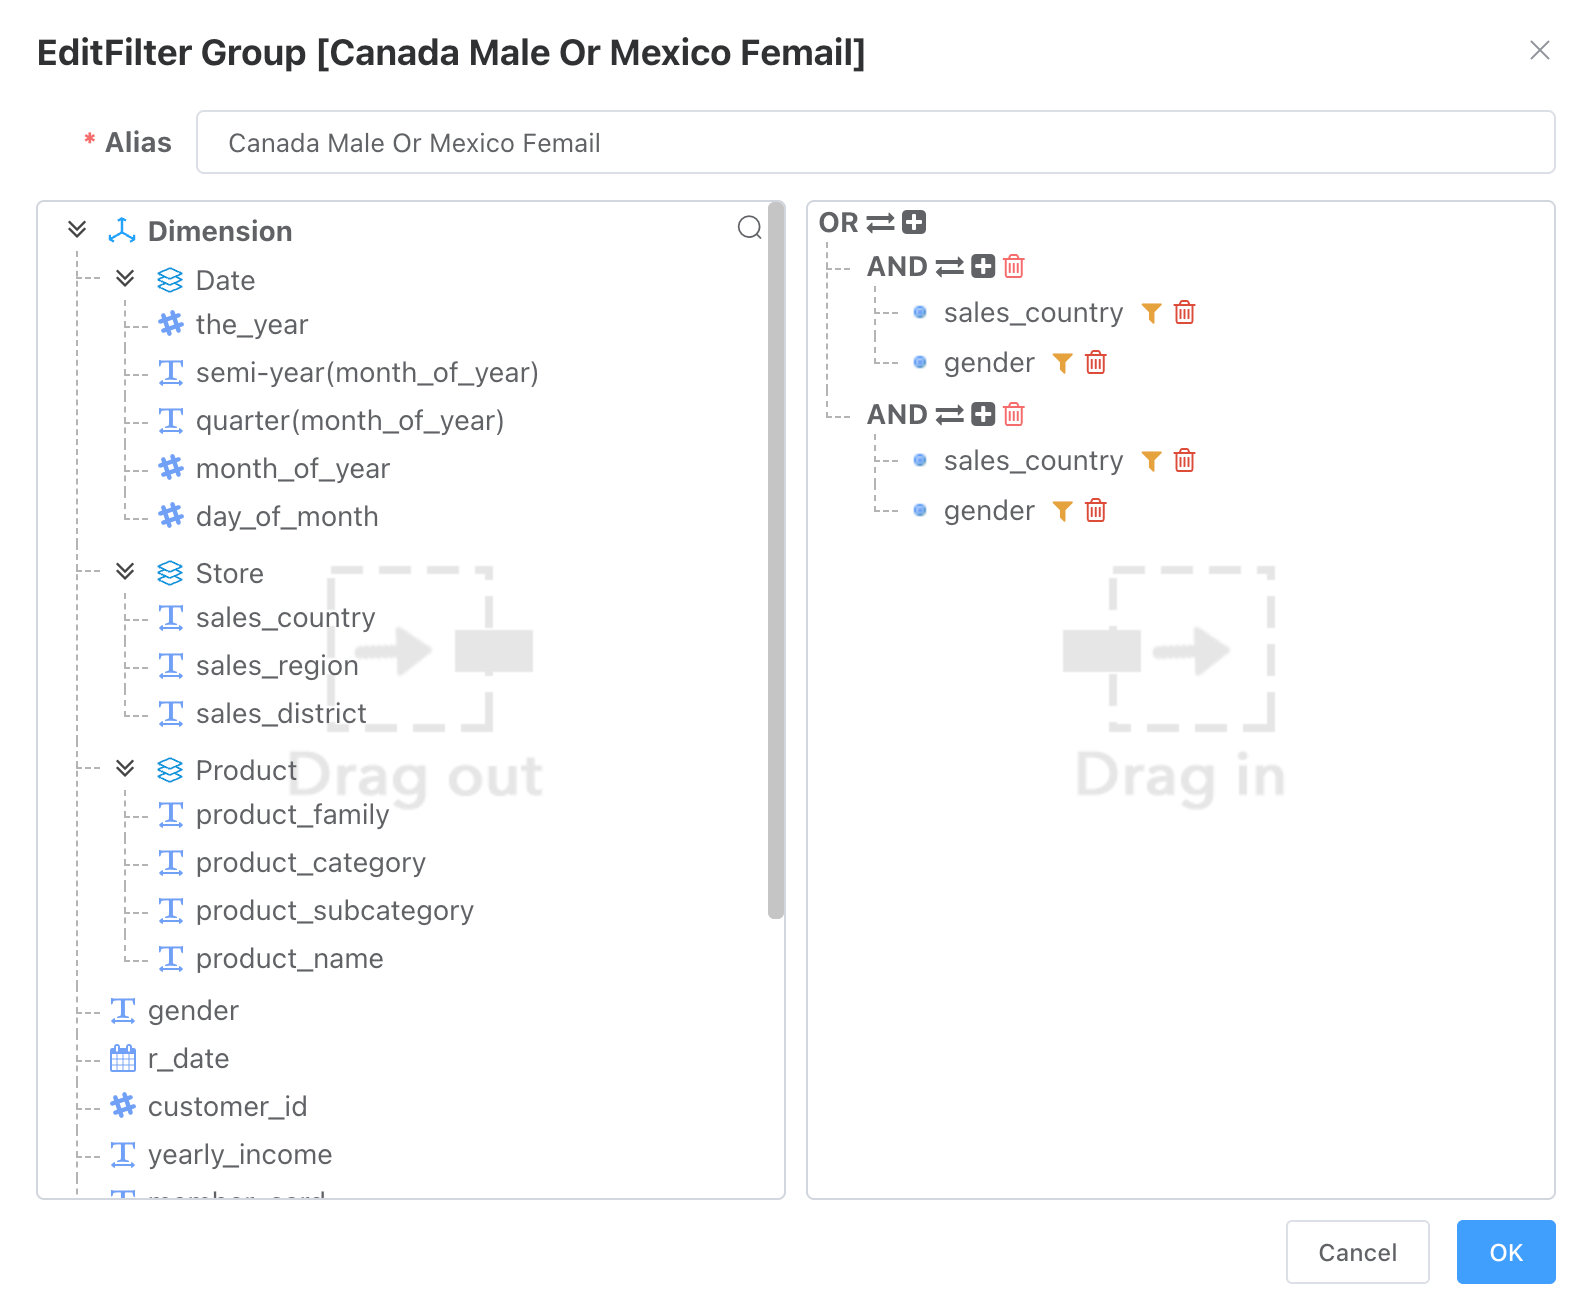
The Filters Group lets you build complex filtering rules by nesting AND and OR logical operators.
Basic Structure
- The editor uses a drag-and-drop interface. Drag dimension fields (such as
sales_country,gender) from the left panel into the filter canvas on the right. - Filters are grouped into logical blocks connected by
AND/ORoperators, which define how the conditions are combined.
Dashboard Refresh
How are dashboards refreshed?
A dashboard can combine charts from different datasets, but not all charts from all datasets need refreshing. Therefore, chart refresh is bound to the dataset. When designing a dataset, set the real-time refresh interval. It can be left empty (no background refresh). If a value greater than 0 is set, when the dashboard is displayed and contains charts built from datasets with a refresh interval configured, those charts will re-fetch data and update according to the set interval.
Dataset Permission
Dataset permission templates control data access permissions for different users on a dataset. Query templates can query external system permission data, making it convenient to integrate BI system permissions with external system permissions.
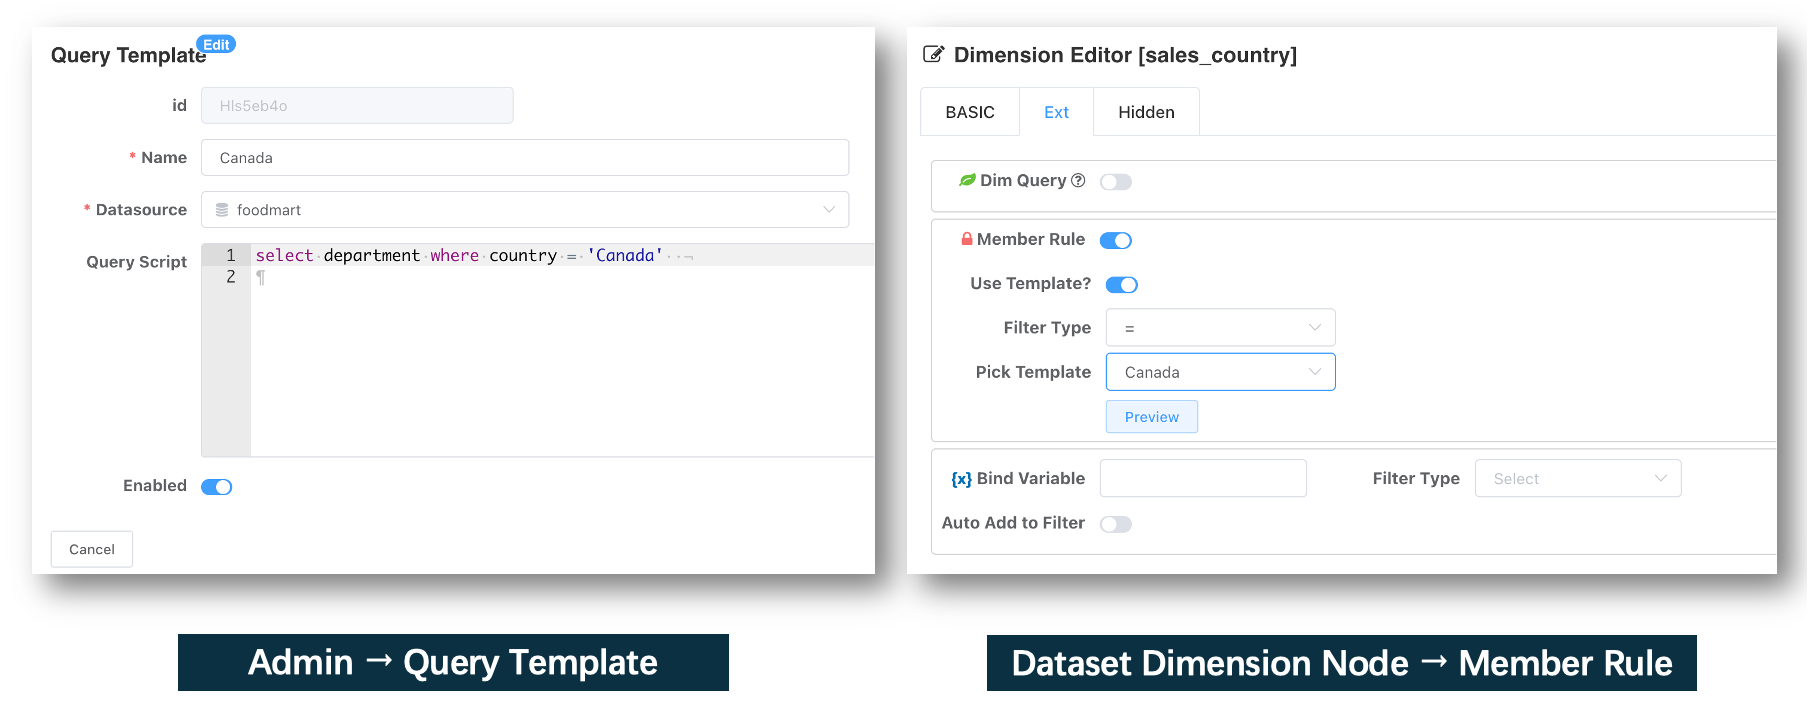
Steps:
- Edit a dimension node, and turn on the permission rule switch in the Advanced Settings section.
- Use direct query: select the data source connection where the permission data resides → write a query. The query can use the
${loginName}variable to differentiate user permission scopes. The first column of the query result should be the data scope values that the current dimension is limited to. - Alternatively, use predefined templates from the permission template (query template).
Environment Variable Declaration
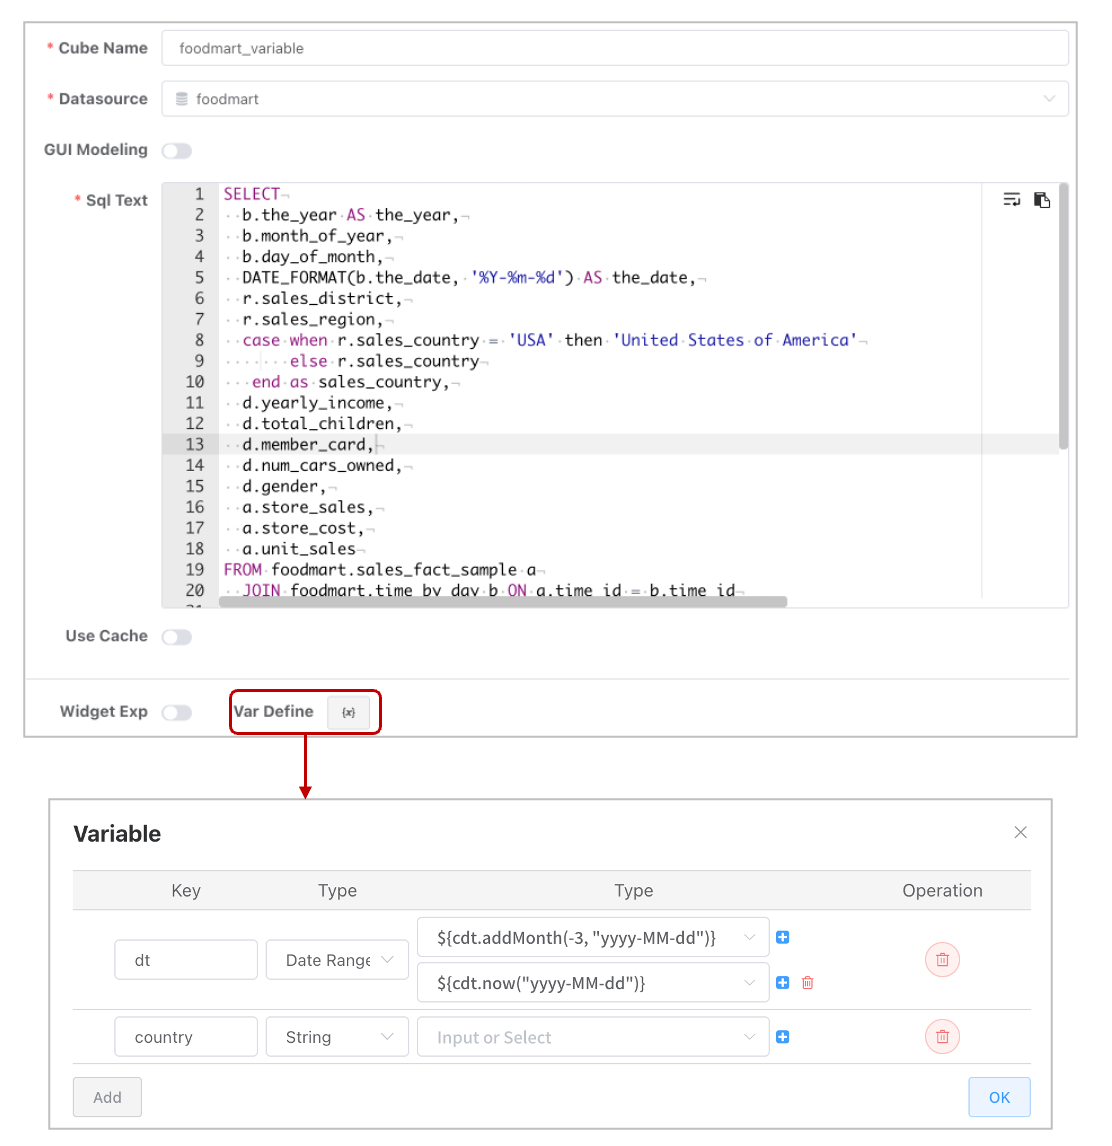
Using variables in dataset queries does not require prior declaration; they take effect as long as they are assigned values downstream in self-service analysis. However, a drawback is that on the self-service analysis page, users may not know which variables are used in the dataset or what their types are. Considering the typical user roles associated with the dataset and self-service analysis modules — dataset designers are usually technically skilled, while self-service analysis targets business users — to make it more convenient for business users when working with datasets, variables and their types can be pre-defined during the dataset development stage.
Variable declaration during dataset design supports:
- Configuring variable types. Different variable types correspond to different input forms on the self-service analysis page when assigning values.
- Setting default values for variables (optional).
- Default values support using other variables.
Note
For array variables in dataset queries, it is recommended to use the arr.get() function for parameter passing, as arr.get() can more safely handle default values when the variable is either an empty string or null.
Dimension Binding Variable
After binding a dataset dimension to a variable, during self-service analysis, dimension filter conditions can implicitly assign values to the variable. This enables a seamless and simplified variable assignment process, lowering the barrier for business users to work with variable assignments.
- Filter Type restrictions ensure the correctness of variable assignments. For example, a date range query filter type is a closed interval and must set two values.
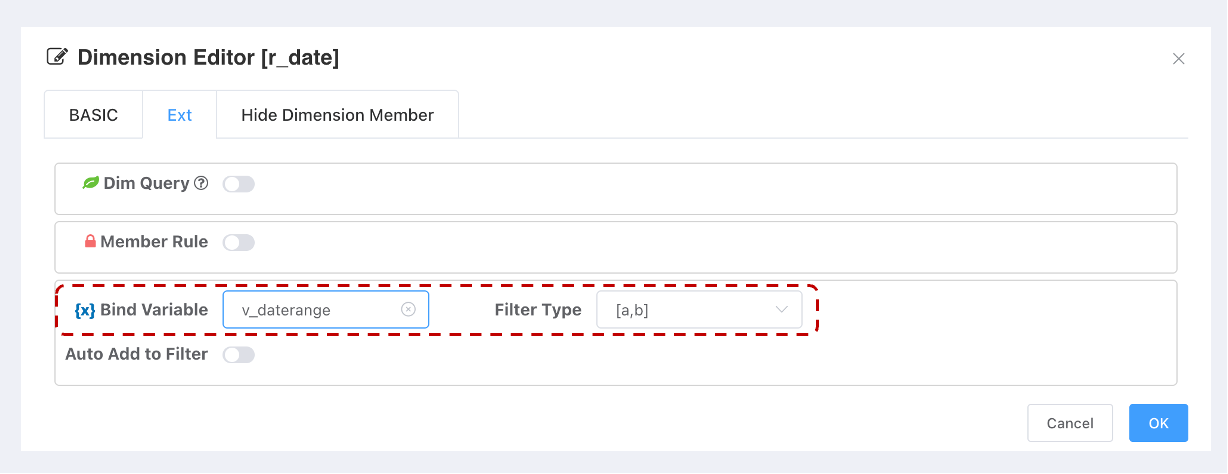
Chart-Level Expressions
Whether to allow creating expressions during the chart design phase. This feature might conflict with dimension and measure column permissions because expressions can query fields not within the model's visible scope, e.g., quoted expressions.