
Overview
Easy Pivot — User Manual
Easy Pivot — User Manual
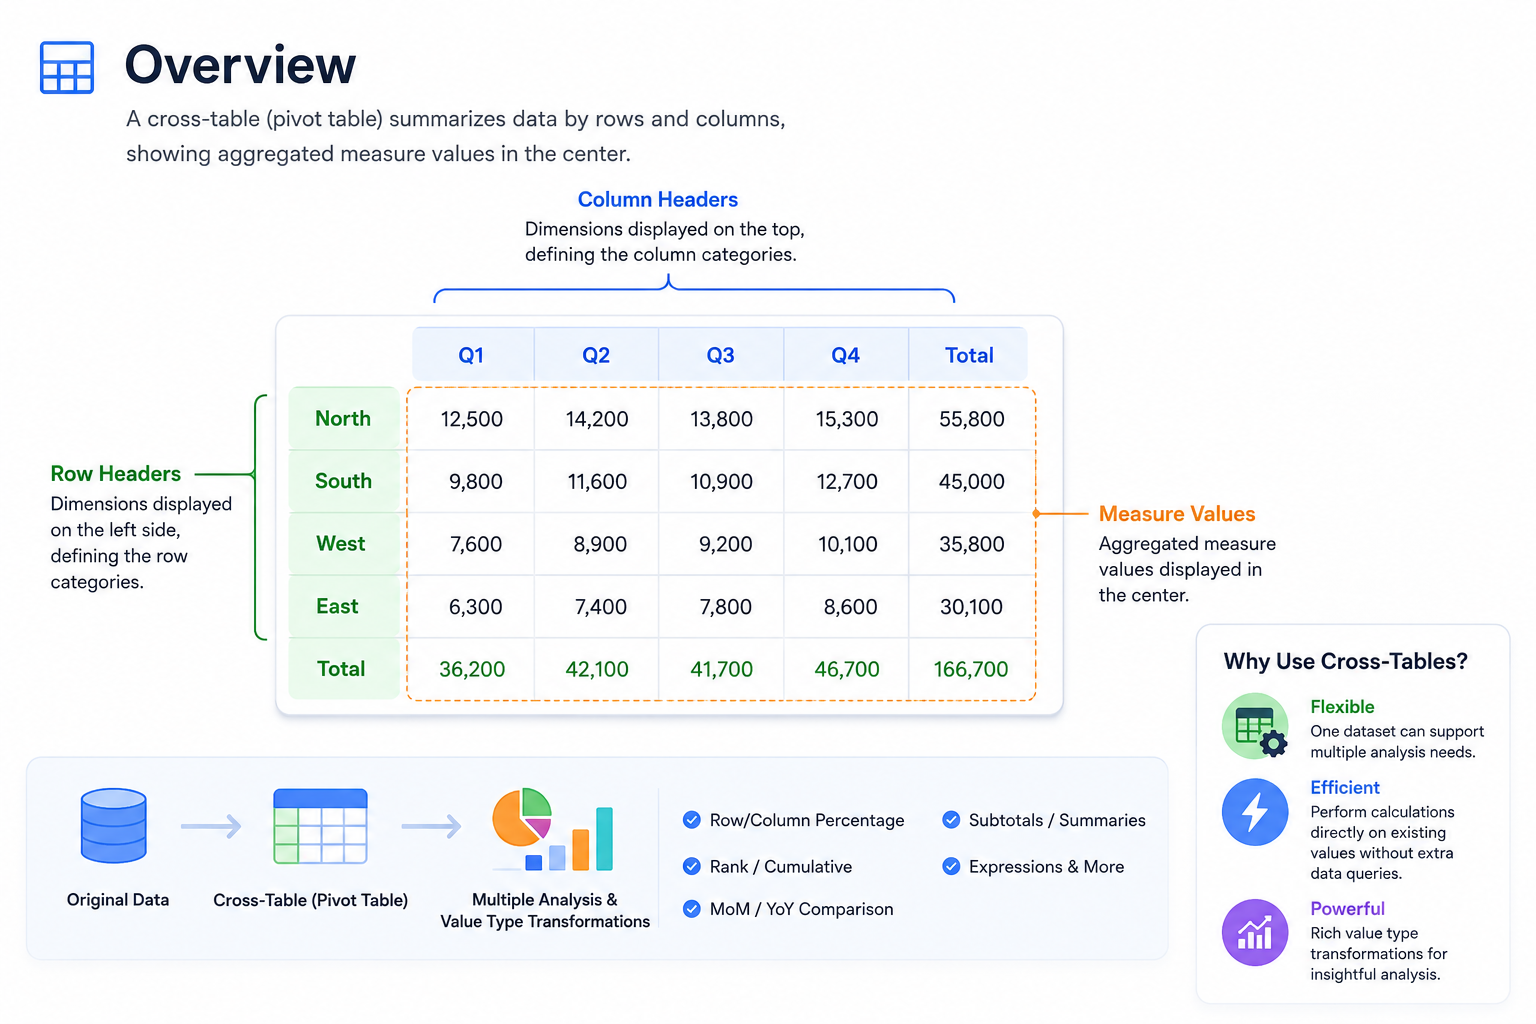
Easy Pivot is a lightweight data analysis platform centered around data pivot — Just drag-and-drop dimensions and measures, and instantly generate cross-tables (pivot tables), charts, and dashboards. The core value is enabling rapid view calculations on aggregated data: row/column percentages, YoY/MoM comparisons, rankings, cumulative totals, and custom expressions — all without re-querying the data source.
Typical Workflow
Build Dataset
Query the datasource, define fields, calculations, and filters as the foundation for all visualizations.
Go to DatasetCreate Charts
Drag and drop dimensions and measures to build cross-tables, bar charts, line charts, maps, and more.
Go to ChartsBuild Dashboard
Combine charts, text, and interactive controls into a unified view for data monitoring and analysis.
Go to DashboardShare & Administer
Publish dashboards through Portal, manage users and roles, and connect to external systems.
Go to PortalGetting Started
- Make sure you have the platform installed and a user account with appropriate permissions.
- If you are new to Easy Pivot, start with Datasource and follow the workflow above.
- For administrators, refer to User and Role and Folder System for configuration guides.
- For developers, see Restful API for integration documentation.