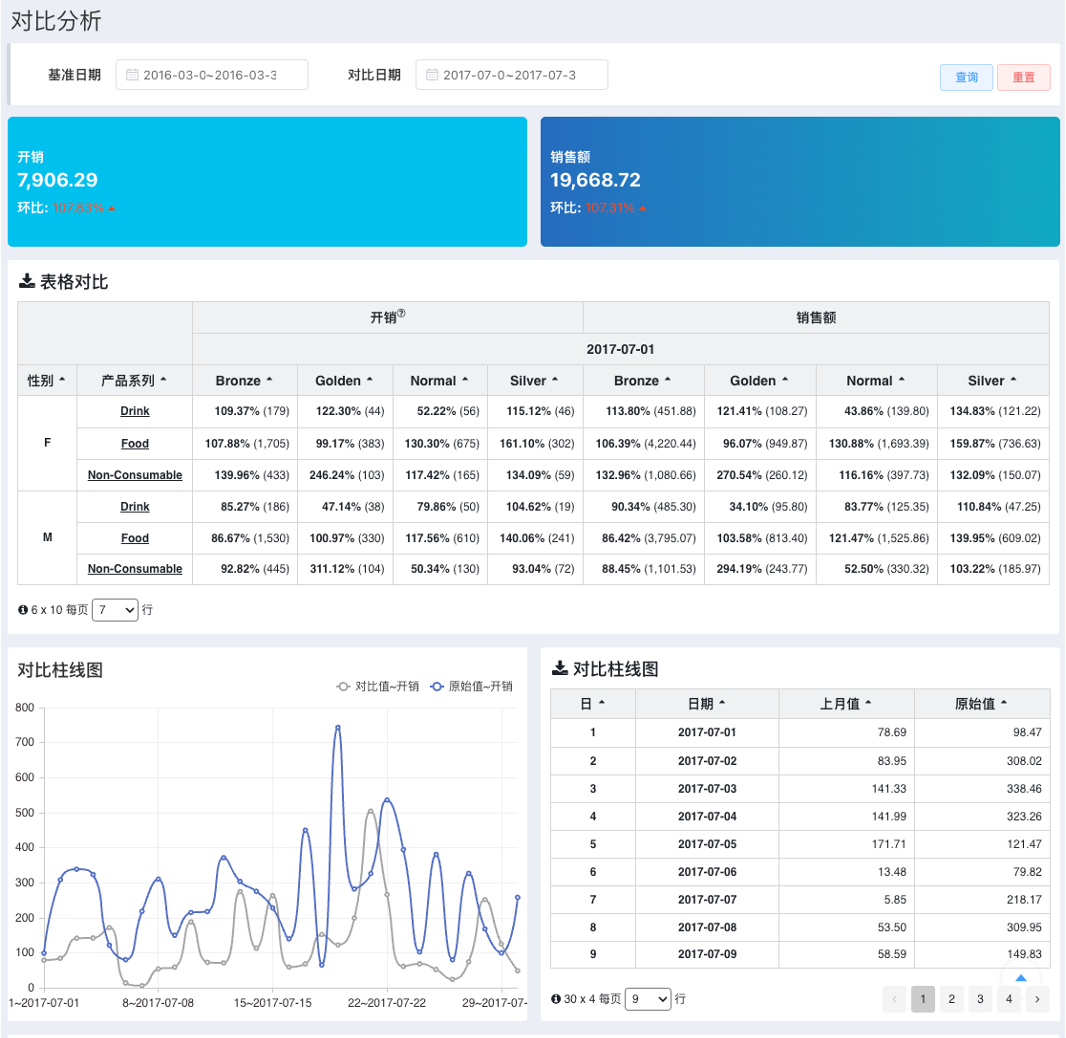
Comparative Analysis
Comparative Analysis
Concept
Comparative analysis is a common pattern in data analysis, typically used to compare data differences between binary dimensions, such as differences in metrics between two date periods or two products.
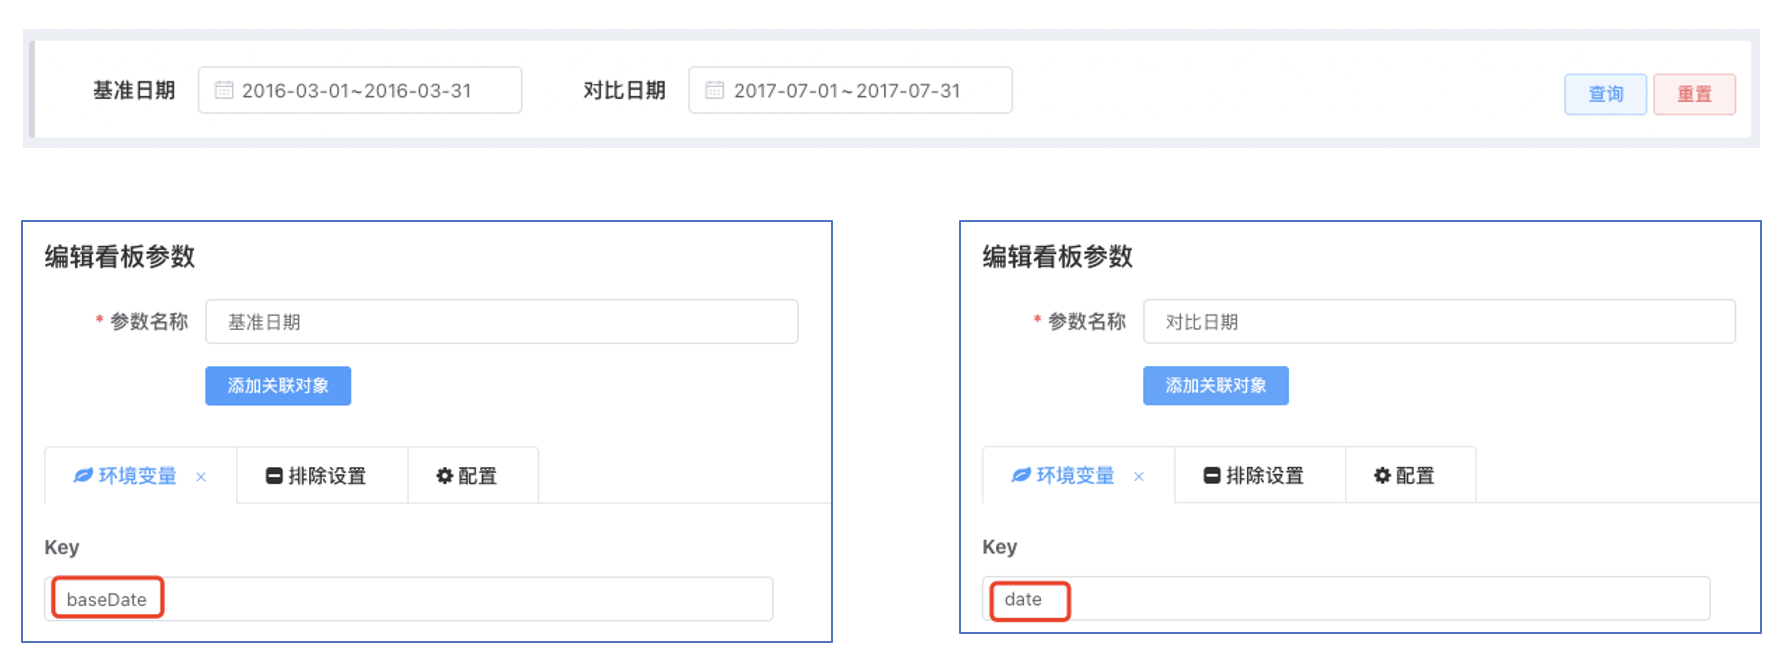
The case study below demonstrates date-range comparative analysis, using two dashboard parameters: Base Date and Comparison Date, which can be selected independently.
New Functionalities Involved
- Range-derived dimension start/end values support variables.
- Derived dimension filter excludes values outside groups.
- Value type: Lag comparison
- Row-wise calculation
- Display original value
- Use original value when lag lookup fails
- Dimension expand hidden items.
Comparative Dimension Configuration
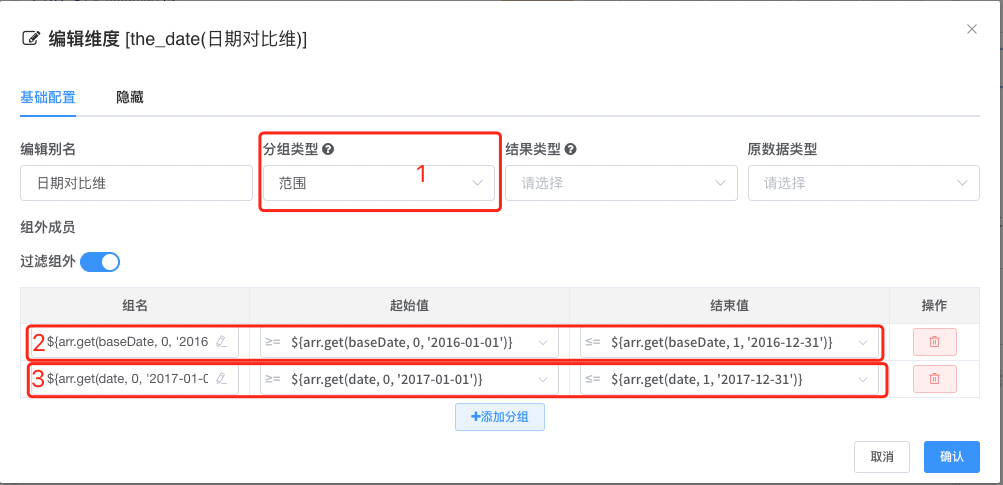
In the dataset configuration, add a new date dimension for date comparison.
- Click dimension edit. In the basic configuration tab, set
Group Datato Range Grouping. Add two range values. Both group names and start/end values use variables. In this case, two environment variablesbaseDateanddateare used, both assigned via dashboard parameters. - The first record is the base date range. Start value is set to
${arr.get(baseDate, 0, '2016-01-01')}, end value is${arr.get(baseDate, 1, '2016-12-31')}, corresponding to the base date range dashboard parameter. - The second record is the comparison date range. Start value is set to
${arr.get(date, 0, '2017-01-01')}, end value is${arr.get(date, 1, '2017-12-31')}, corresponding to the comparison date range dashboard parameter. - Enable
Filter Out-of-Group Valuesto filter values outside the two date ranges.
Group Name
- Group names can be set according to actual needs. The case uses the start value of the date range as the group name, with content identical to the start value setting.
- Comparative dimension configuration can be set uniformly in dataset editing, achieving a "configure once, use many times" effect.
Comparative Metric Card
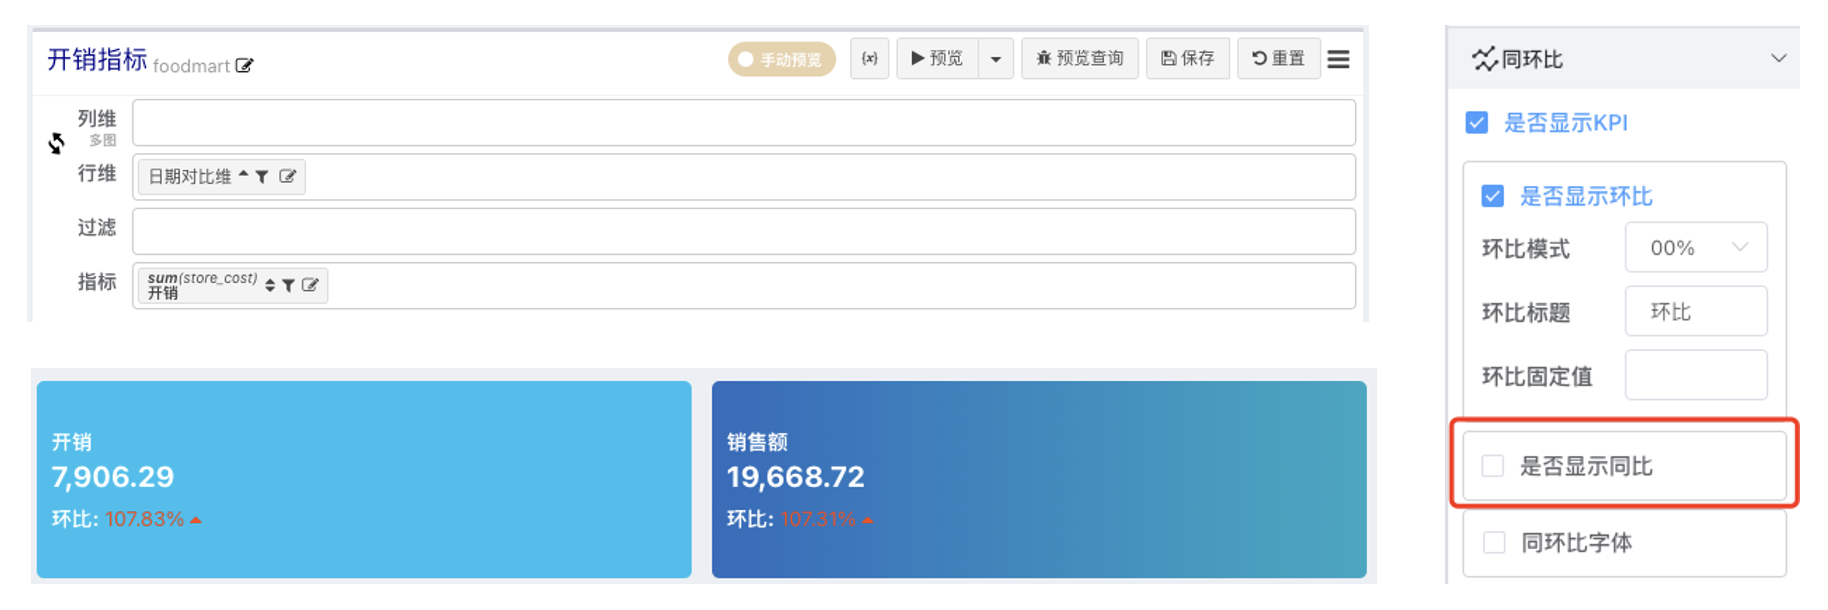
Metric card configuration is relatively simple, as shown below. Configure the comparative dimension on the row dimension, drag in the metric. By default, it calculates the period-over-period change between the two row values. In the configuration panel, deselect the YoY display. Please refer to [Chart Design -> Metric Card Principle Explanation].
Comparative Table Configuration
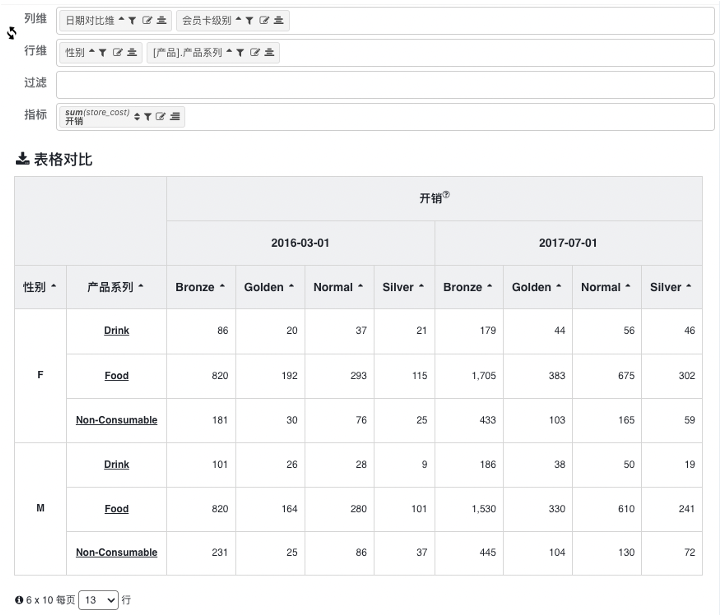
- Drag and drop the corresponding dimensions and metrics according to the table structure, resulting in the following table with two sets of metrics within the comparative date range.
Align Metrics
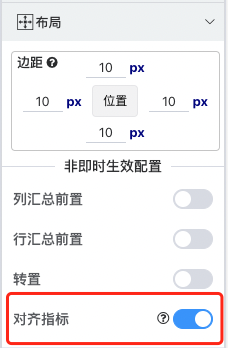
Observant users may notice the above table differs slightly from a normal cross-table: the metric name header is placed in the first row. This effect can be achieved via the header or configuration by aligning metrics.
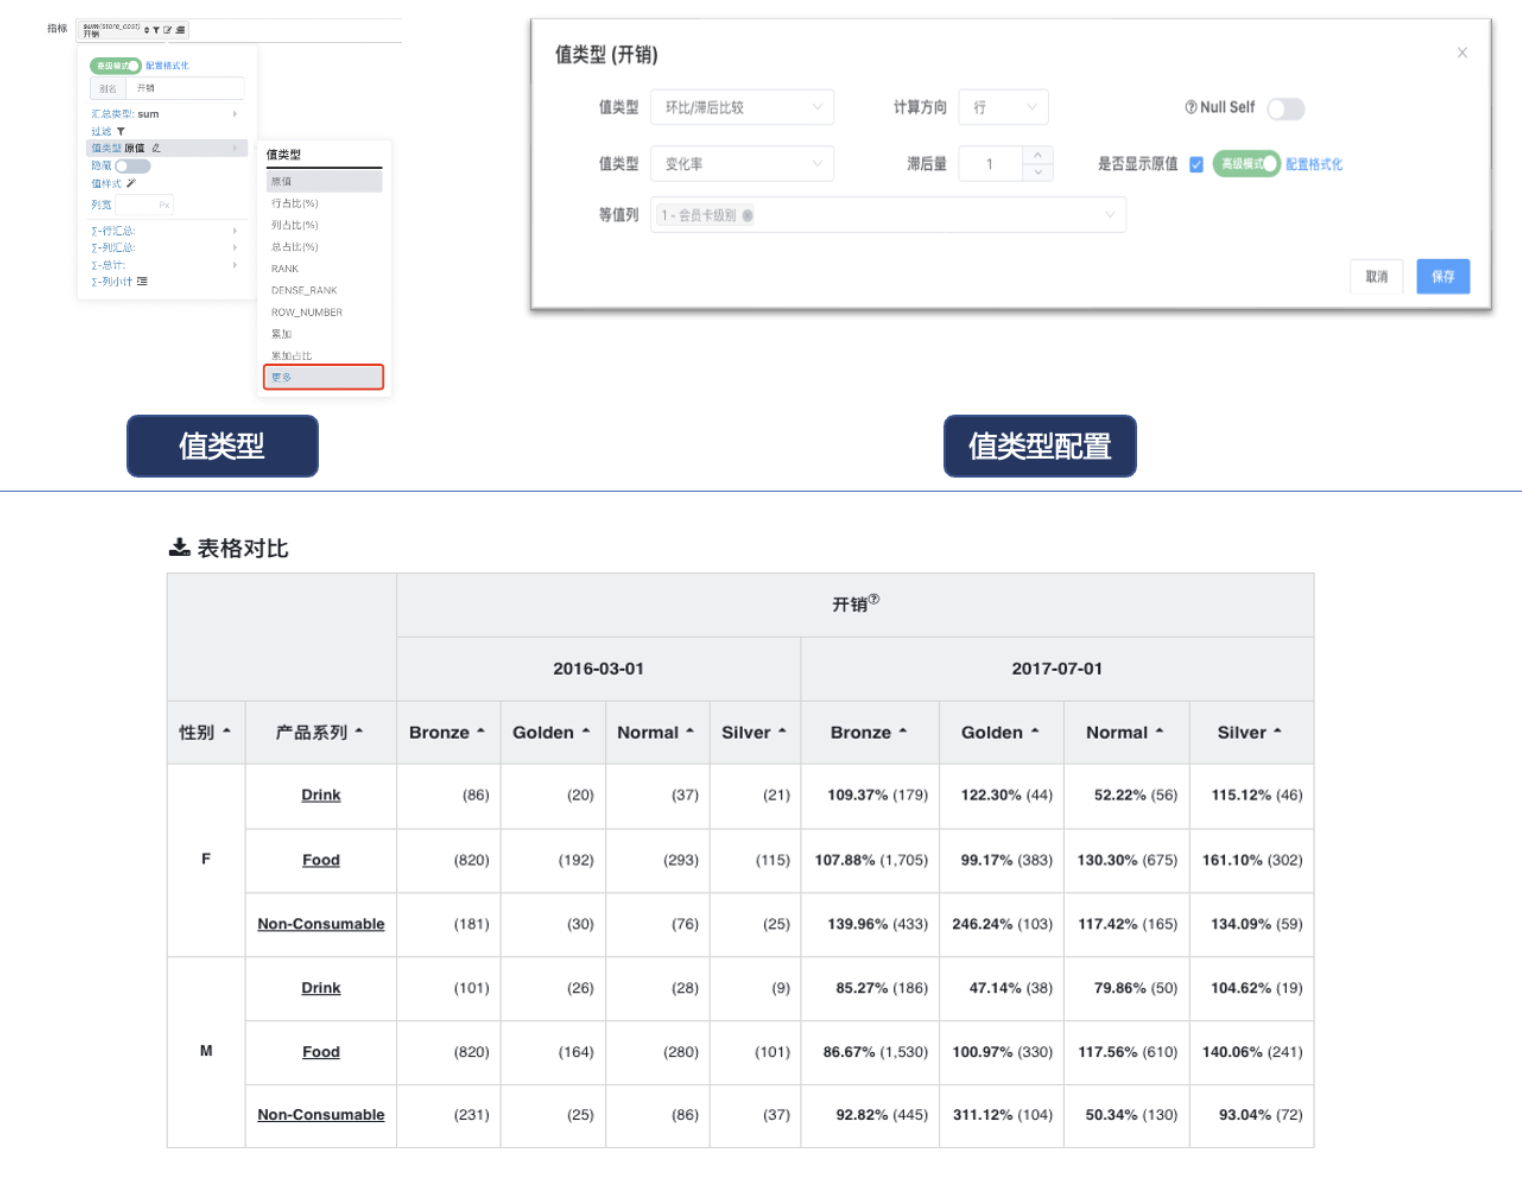
- Set value type to display comparative values.
- Edit the metric
Value Typeconfiguration. In the "More" pop-up, selectMoM/Lag Comparisonvalue type. - Choose
Rowfor Calculation Direction. - For the value type after the second row changes, select
Change Rate, lag amount 1, and checkDisplay Original Value(the formatting on the right is for the original value, distinct from change rate formatting). - For Equal Columns, select other dimensions after the binary dimension. In this case, only member card level is used on the column dimension, so select it.
- In the metric formatting configuration, set the change rate value type to percentage.
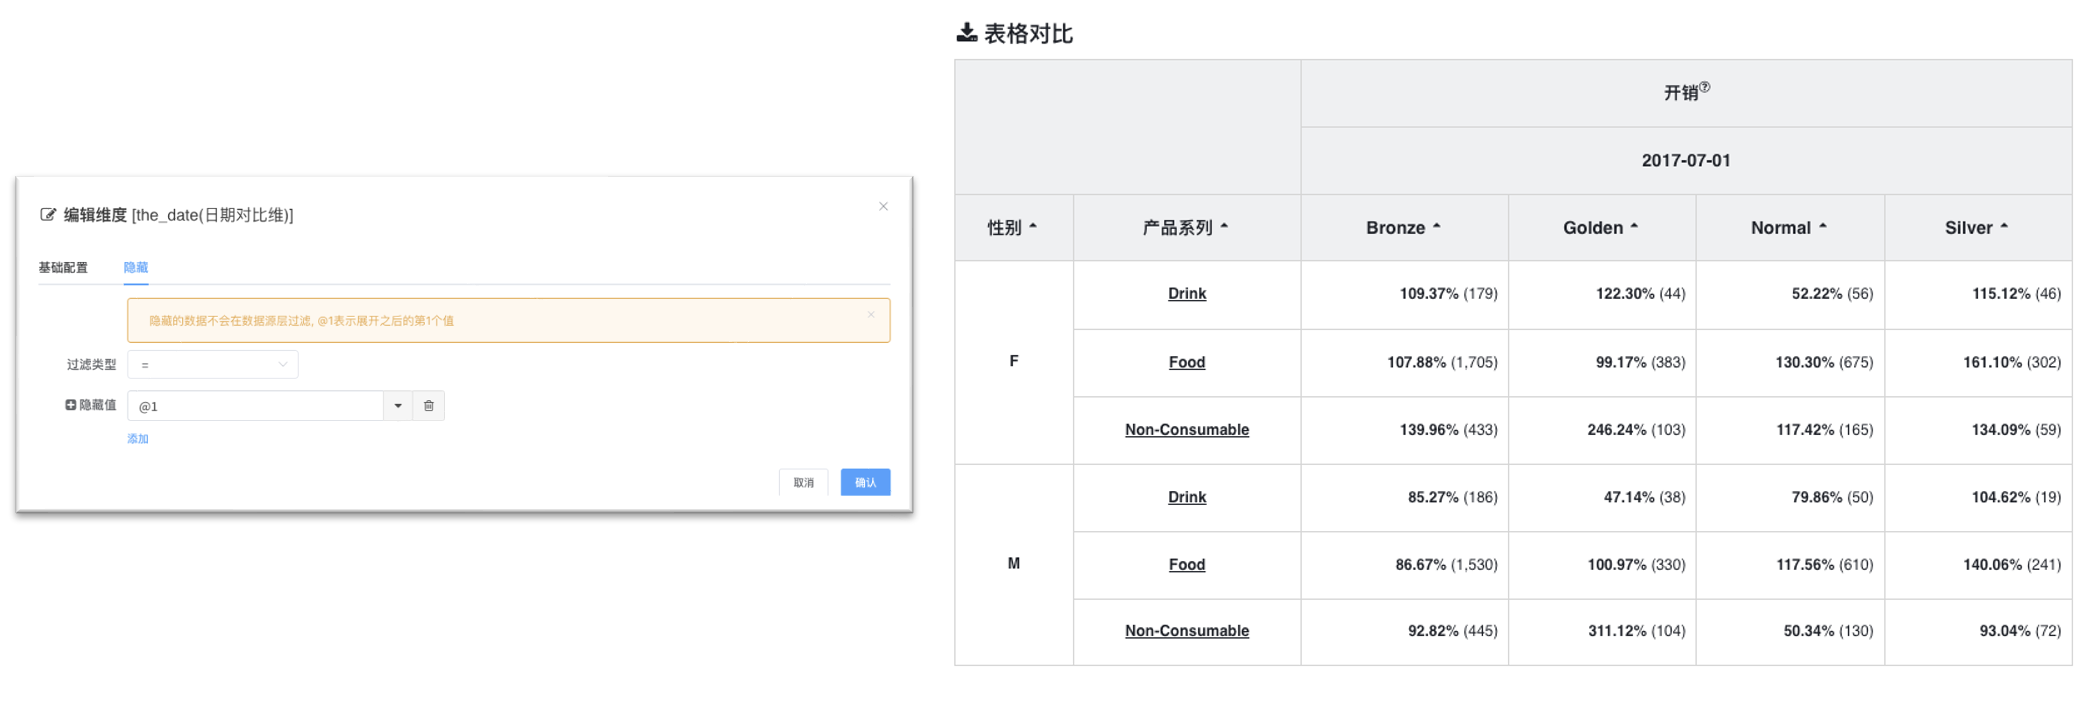
- Hide the base metric.
Open the comparative dimension edit again. In the Hide tab, add hidden value @1 representing the first value after expansion, i.e., all columns corresponding to the base value.
- To add other comparative metrics, repeat step 2.
Comparative Series Side-by-Side Display
- Basic data configuration as below.
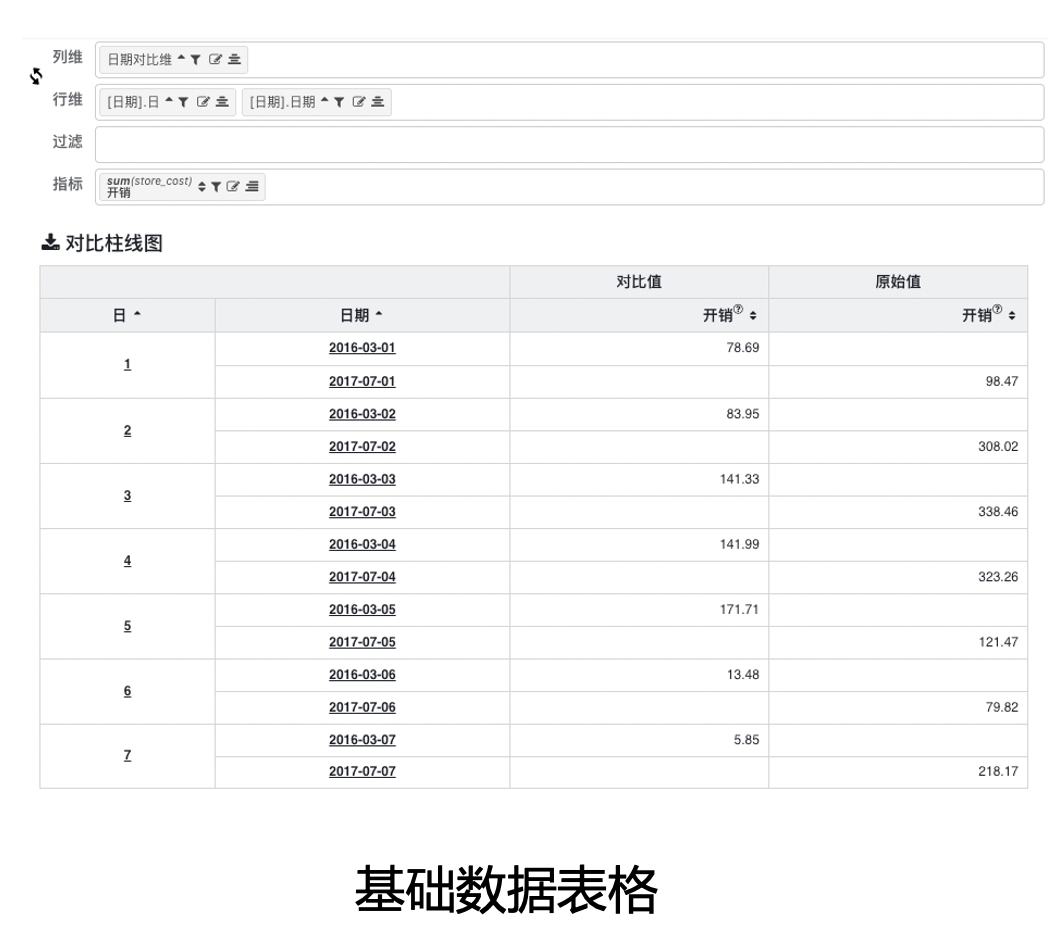
- Set lag comparison. As illustrated below, setting "Day Equal" for lag comparison yields the middle table effect. Only the comparison value column has values; the original value column cannot find lag values. Therefore, configure NullSelf in the value type to use the original value when lag value is not found, resulting in the bottom table effect.
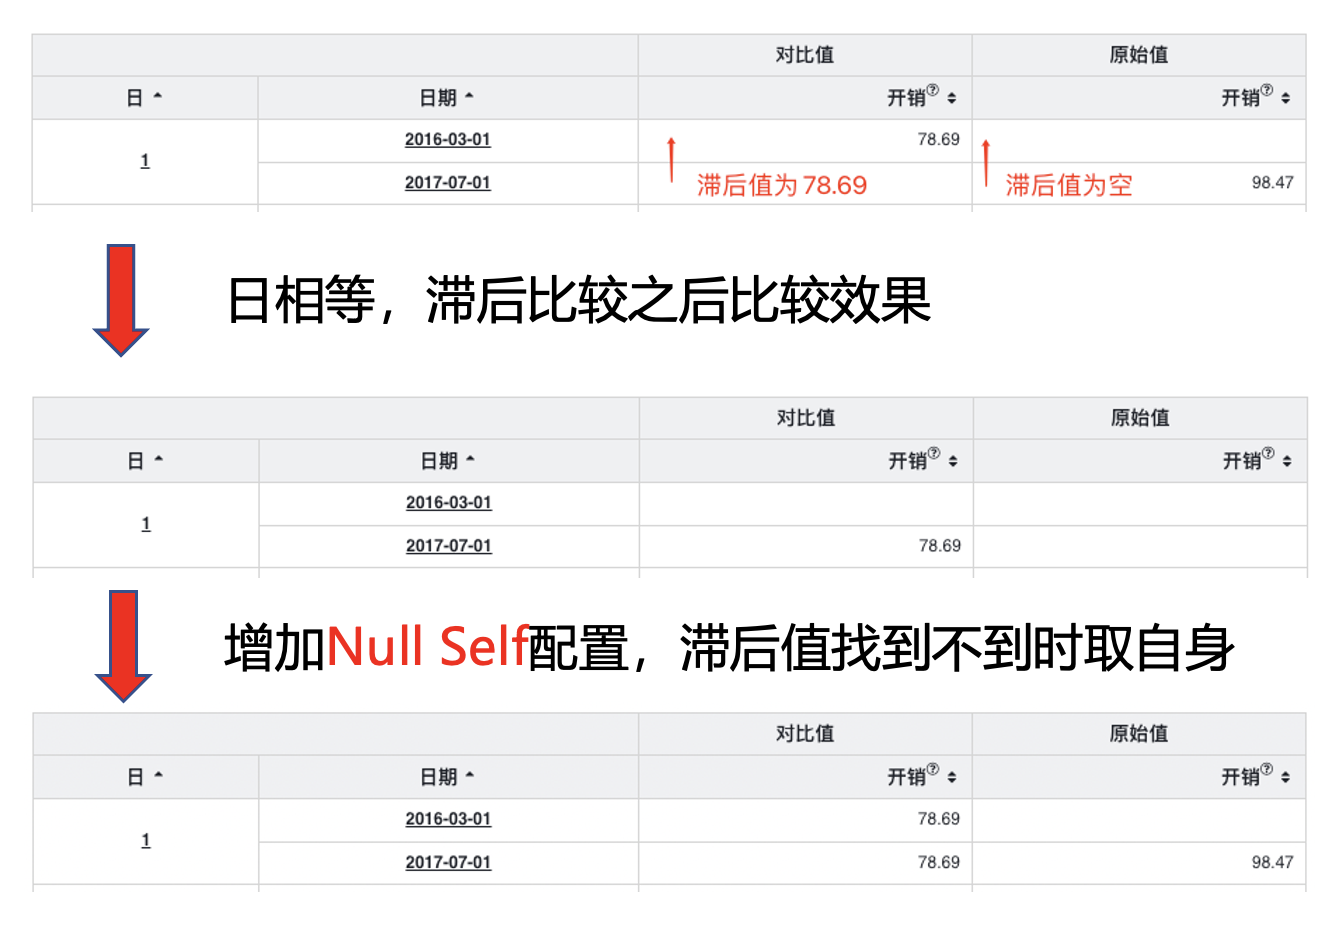
Complete value type configuration:

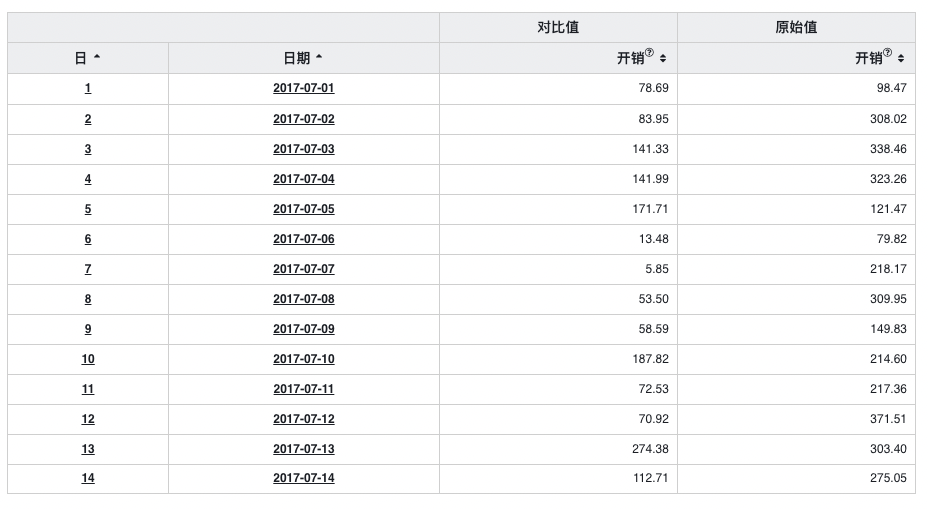
- Hide base date row.
Edit the Date Dimension on the row dimension, hide the first item after expanding each date dimension group.

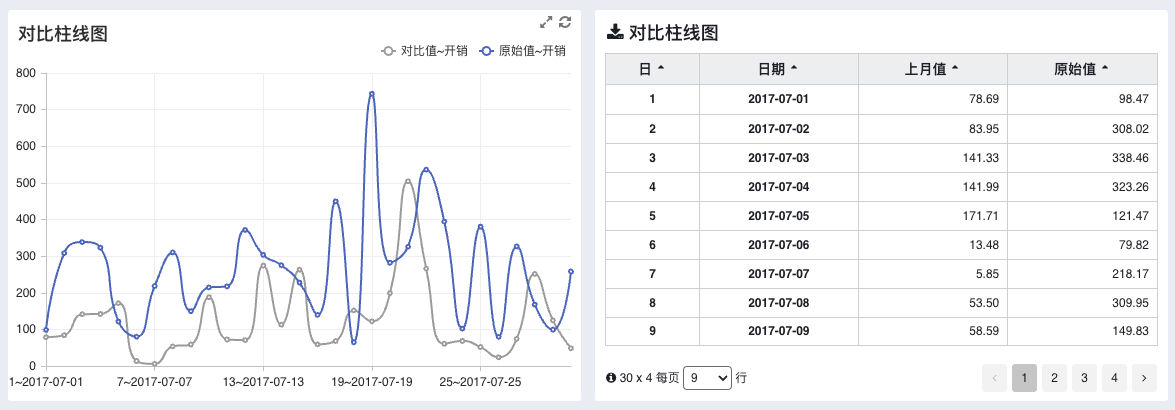
- Switch to line chart to display comparative trend.
Date Parameter Configuration