
Dashboard Monitoring
Dashboard Monitoring
Dashboard monitoring tasks allow the BI system to perform automated, scheduled checks for data anomalies. When anomalies occur, data alerts are triggered, helping you understand important information more efficiently and accurately.
Tip
Monitoring tasks need to simulate access to data dashboards on the server side. Therefore, before enabling dependencies, please check and confirm whether the Email Sending and Server-side Export Plugin has been correctly installed and configured.
Opening Dashboard Monitoring
Currently, dashboard monitoring is available to users who have edit permissions for the dashboard. Each user can define different data monitoring based on their own focus points. Of course, the monitoring content is also related to the user's data permissions; users cannot monitor data beyond their own visible data permissions.
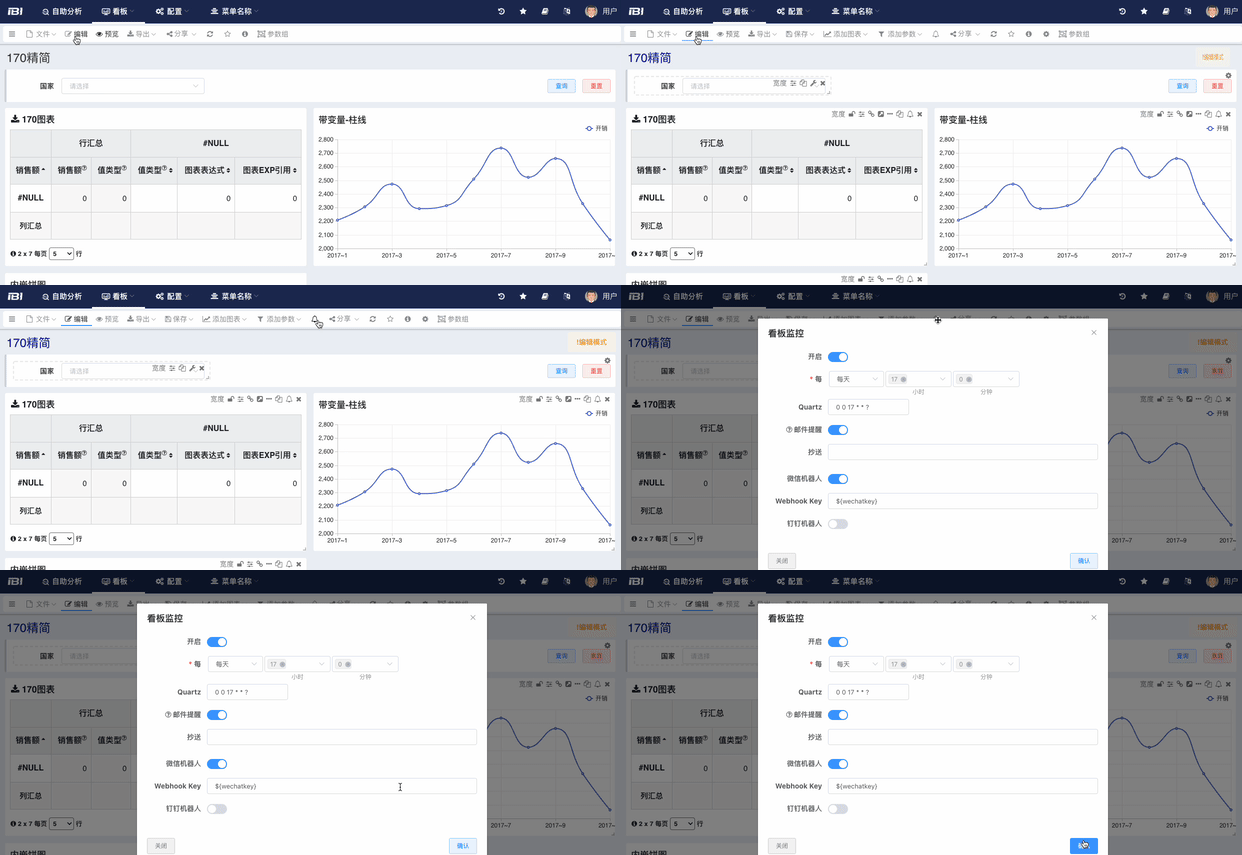
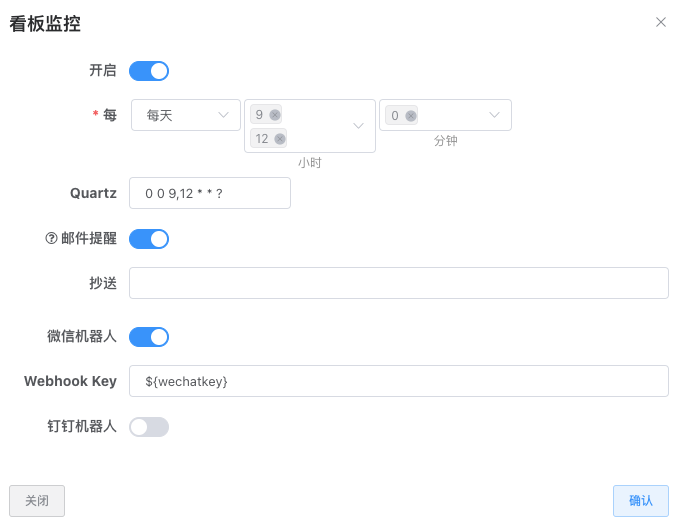
The following forms of monitoring alerts are supported:
- Email:
- The default recipient is the email registered in the account information, which can be maintained in the user basic information pop-up window.
- Add CC recipients via the input box; separate multiple users with English semicolons.
- Enterprise WeChat Robot:
- To enable an Enterprise WeChat group robot, click this link. Then scan the QR code with Enterprise WeChat to view the tutorial, or search for third-party tutorials via a search engine.
- The WeChat robot webkey supports system variables. Administrators can maintain commonly used webhook Keys in the
Management -> System Configurationmenu. Select Configuration for key type, not Variable.
- DingTalk Robot:
- To enable a DingTalk robot, click this link.
- The robot webkey supports system variables. Administrators can maintain commonly used webhook Keys in the
Management -> System Configurationmenu. Select Configuration for key type, not Variable.
Opening Chart Monitoring Settings
After dashboard monitoring is enabled, most non-detail data charts can be monitored.
- Click the monitoring bell icon in the upper right corner of the chart in edit mode.
Adding Monitoring Items
- Set different names for each monitoring item.
- A single chart can have multiple different monitoring items.
Editing Monitoring Items to Set Monitoring Conditions
- Monitoring conditions consist of 1 or more dimension/metric comparisons with thresholds.
- Multiple conditions can be set to trigger when all are satisfied (AND) or when any one is satisfied (OR).
- Thresholds support variables, commonly used for monitoring data under dynamic dates.
