
Getting Started
Getting Started
Getting Started
Parent-Child Cells
Calculation Model
In short, the calculation model of the Report module can be summarized as: parent cells drive child cells to expand iteratively, combined with calculations between cells.
In Report, there are dependencies between cells. For any cell, you can set its left parent cell and top parent cell.
- The parent cells of a cell are optional. By default, the left parent of a cell is the nearest cell to its left in the same row, and the top parent is the nearest cell above it in the same column.
- If a cell is in the first row, it has no top parent by default. Similarly, if it is in the first column, it has no left parent by default.
- In the Report Designer, you can view the default top or left parent of any selected cell in its property panel, as shown below:
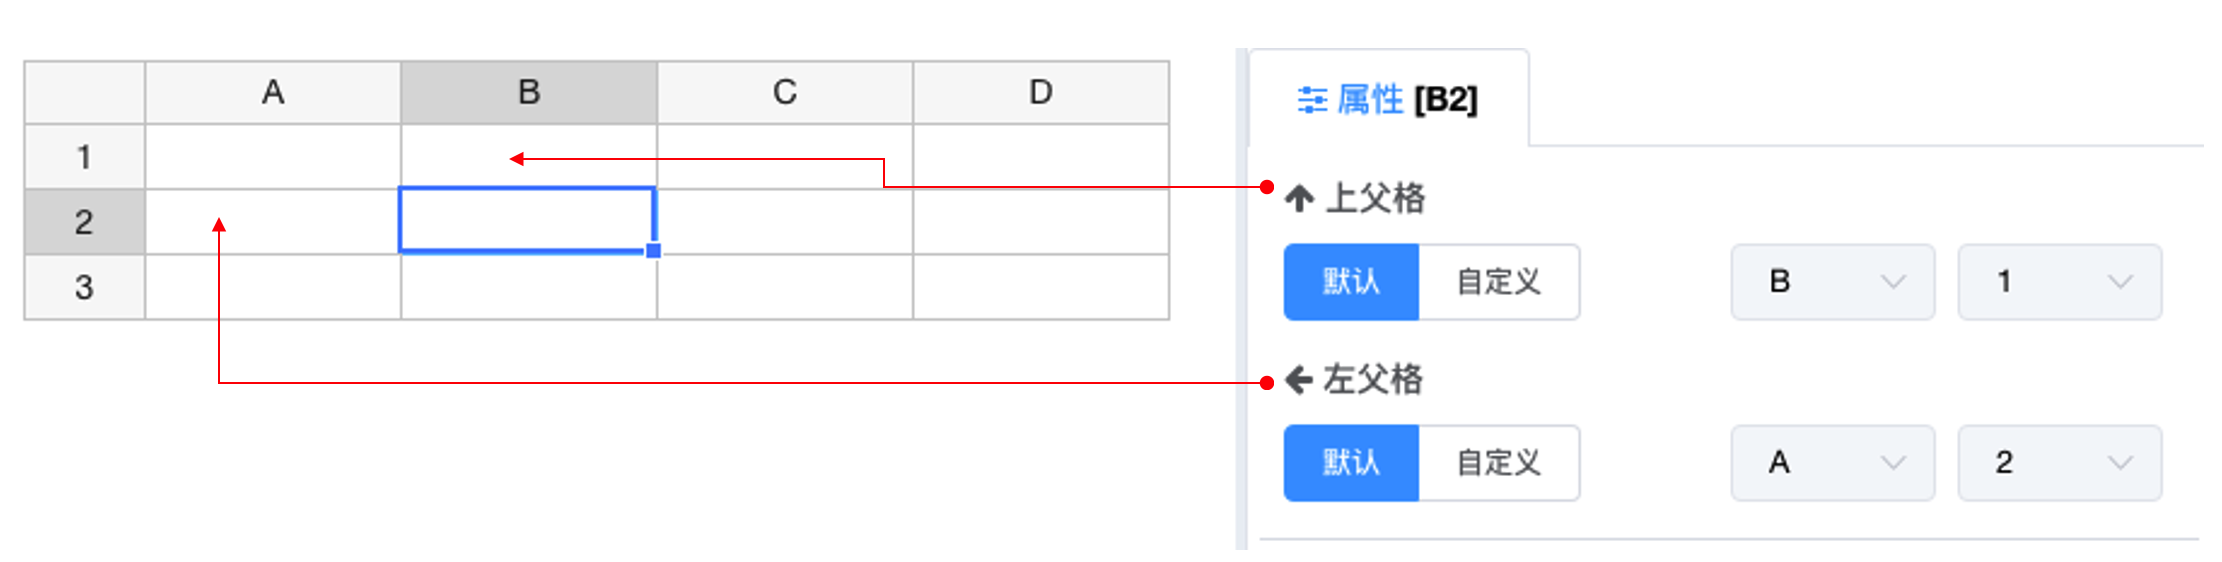
For a specific cell, you can manually change its left parent, top parent, or set the parent to "None."
When a cell is bound to a field in a dataset, if that field contains more than one data record, the cell can expand to display all data. For parent cells, when they expand, they drive their child cells (and their child cells’ children) to expand as well. For example, if a parent cell expands downward, all its child cells and their descendants will also expand downward.
Additionally, if the dataset bound to a child cell belongs to the same dataset as its parent cell, the data in the child cell will be constrained by the parent cell. When the dataset field bound to a child cell expands, it will also drive its own child cells to expand, and if the parent cell of the current child cell is in the same row or column, it will stretch the parent cell.
By leveraging this iterative cell expansion feature, we can create various complex report layouts. Mastering the characteristics of this report calculation model is a prerequisite for developing reports.
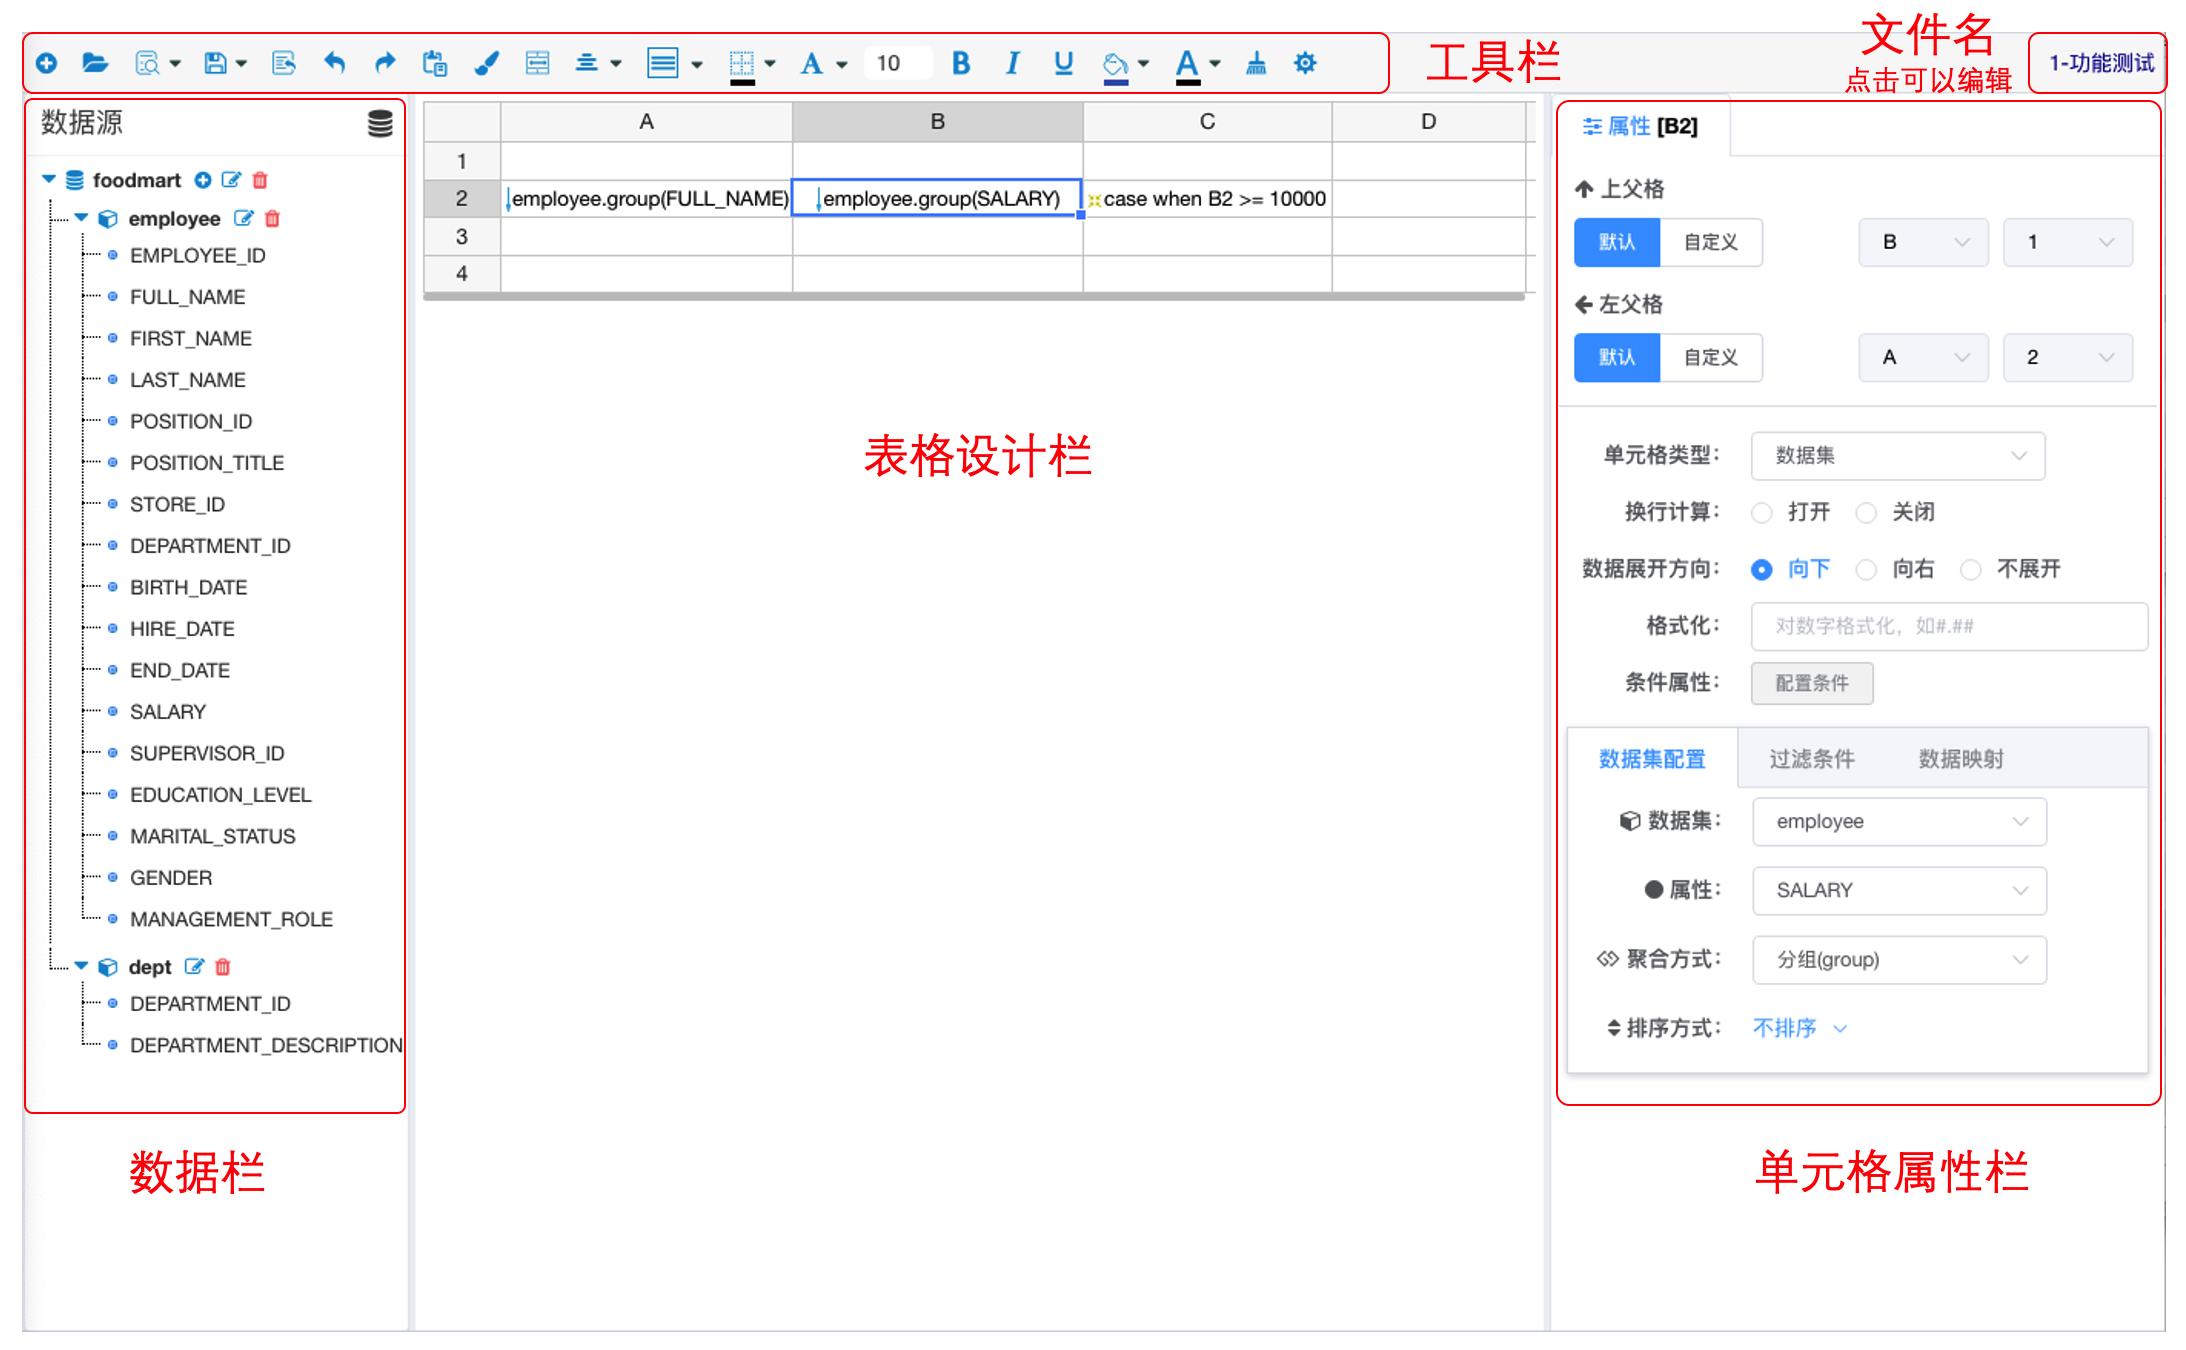
Design Area Introduction
Data Source Configuration
Important Notes
- The Report calculation model requires loading the detailed data corresponding to the dataset query into JVM memory to perform arbitrary aggregation calculations later. However, BI datasets are generally large and have specific themes, so they cannot be directly used as report datasets.
- Starting from
v1.10, the BI multidimensional query engine can be used to load aggregated data as report datasets. - Report queries can be configured with multiple queries from different sources. Datasets (from different data sources like MySQL and Oracle) can be associated and calculated in memory.
- To prevent memory overload from dataset loading, we have set a maximum limit of 100,000 records per dataset. This will be adjusted and optimized in the future, or users will be allowed to configure it based on their server performance.
flowchart LR
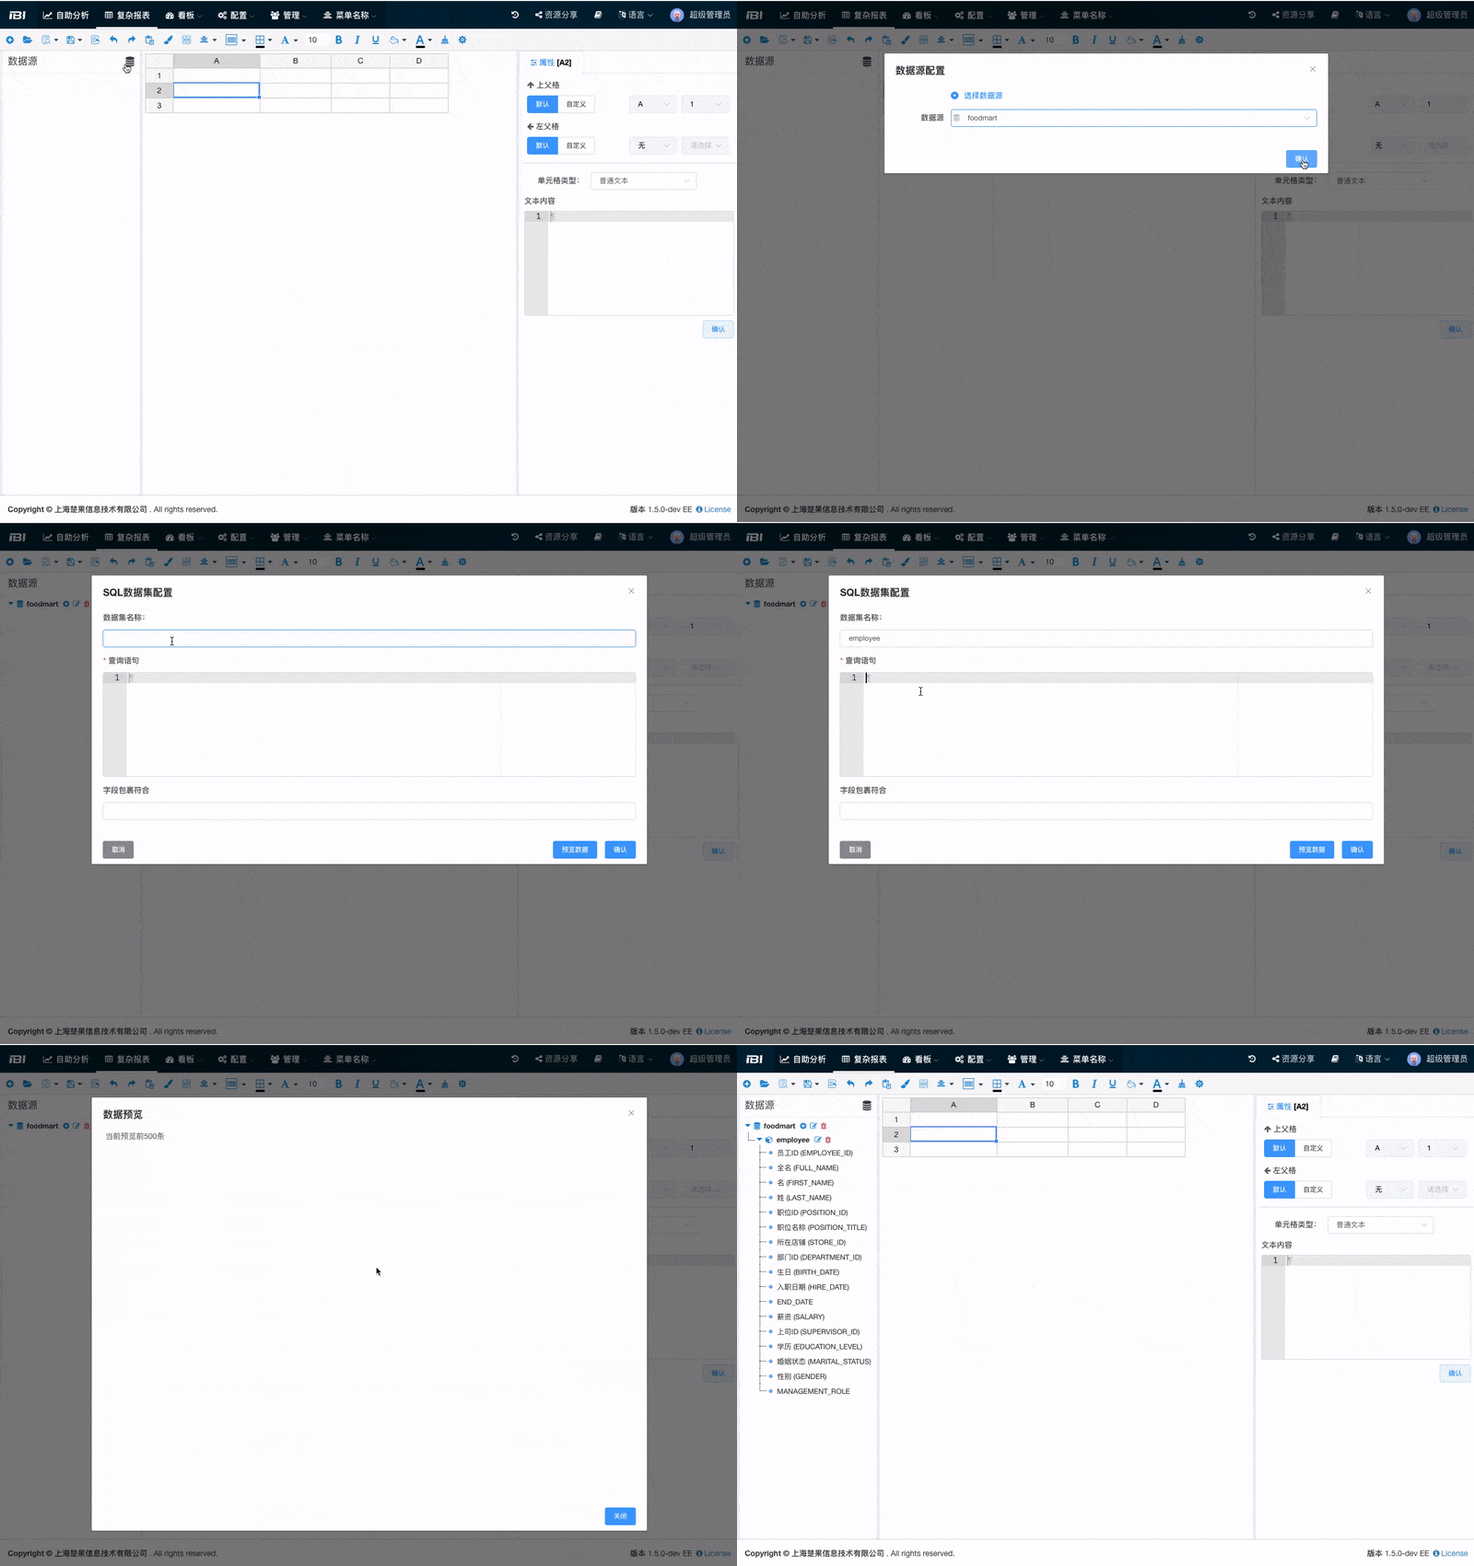
st([Start]) */} dsr[Add Ad Hoc Data Source] */} dst[Add Dataset] */} query[Enter Query Statement] */} e([End])- Click the data source add icon in the top-right corner of the data panel.
- A data source selection pop-up will appear.
- Click the button to the right of the data source node, enter a unique dataset name (in English, which will be reused in cells and expressions later), and edit the query to define the dataset.
- Preview the data, then confirm and close.
BI Dataset Integration
flowchart LR
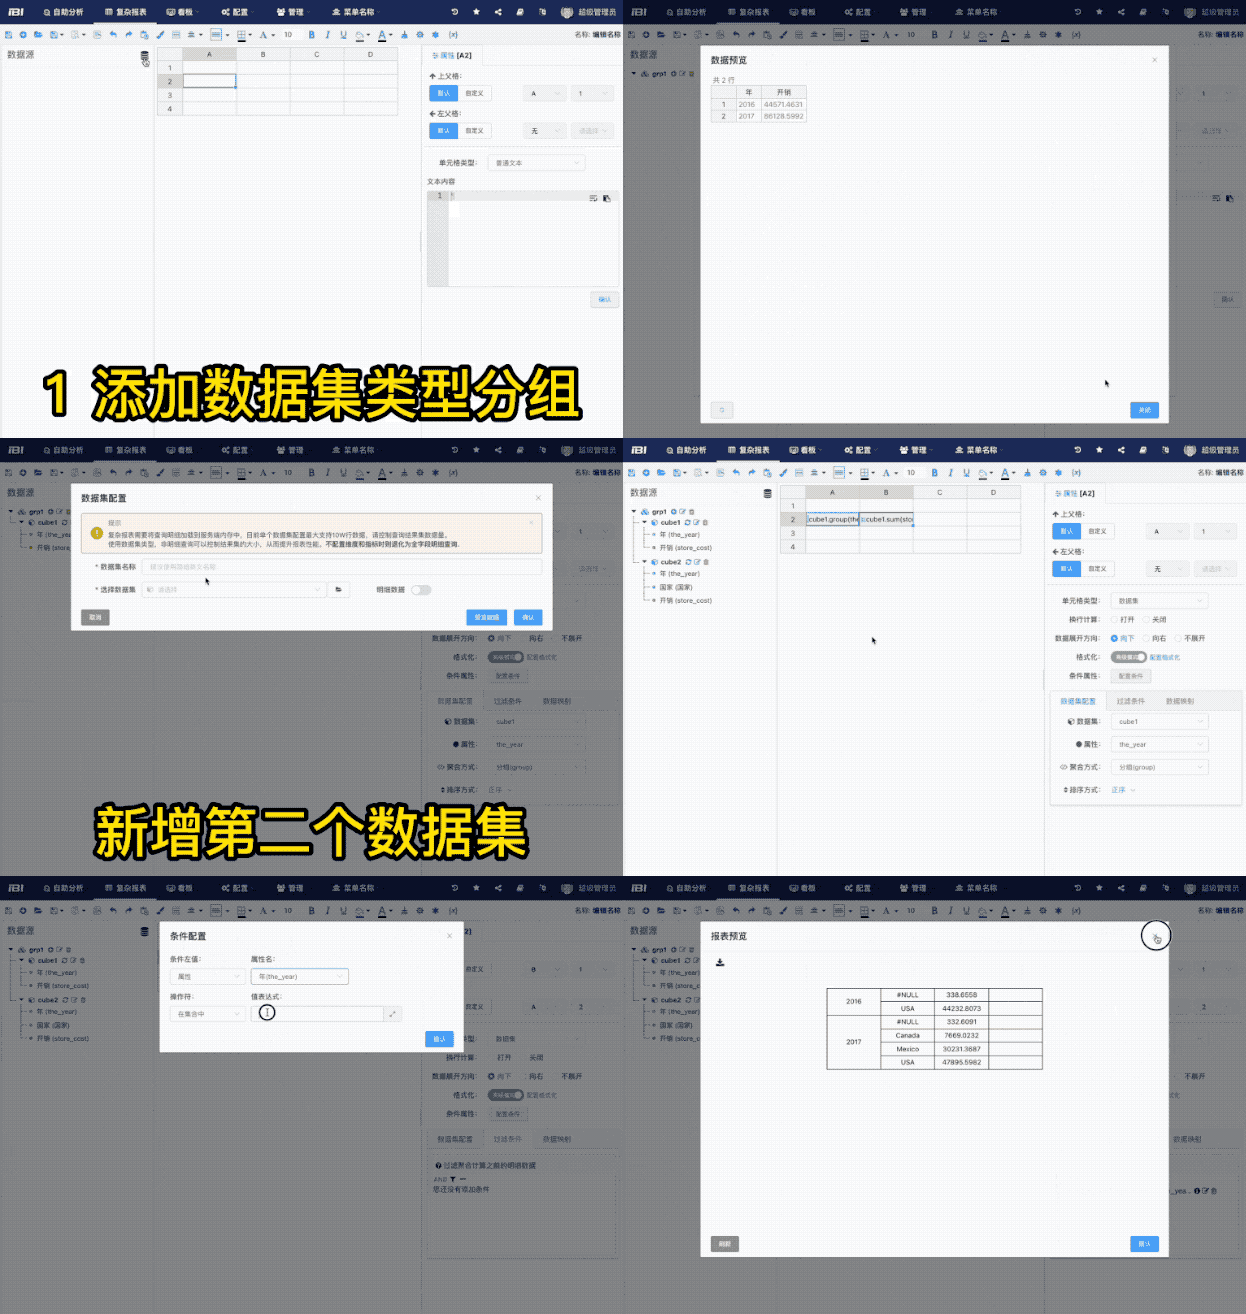
st([Start]) */} dsr[Add Dataset Group] */} dst[Select BI Dataset] */} query[Drag-and-Drop Multidimensional Query] */} e([End])- Click the data source add icon in the top-right corner of the data panel.
- Create a new dataset group.
- Click the button to the right of the dataset group:
- Enter a unique dataset name (in English, which will be reused in cells and expressions later).
- Select summary dimensions and metrics to define the query.
- Preview the data, then confirm and close.
Cell Types
Note
Currently, no cell content can be directly input in the Table Design area, nor can content be dragged and dropped into cells.
Currently supported cell types are:
| Cell Type | Explanation | Input Method |
|---|---|---|
| Plain Text | Commonly used for titles, headers, descriptive text. | Select the target cell in the table, and enter text in the property panel on the right. |
| Dataset | Mainly used for dynamic data source cells. | Select the target cell in the table, and click the dataset node to automatically fill it. |
| Expression | Commonly used for direct calculations between cells. | Select the target cell in the table, choose Expression from the property panel's cell type dropdown, and enter the expression content. |
Plain Text
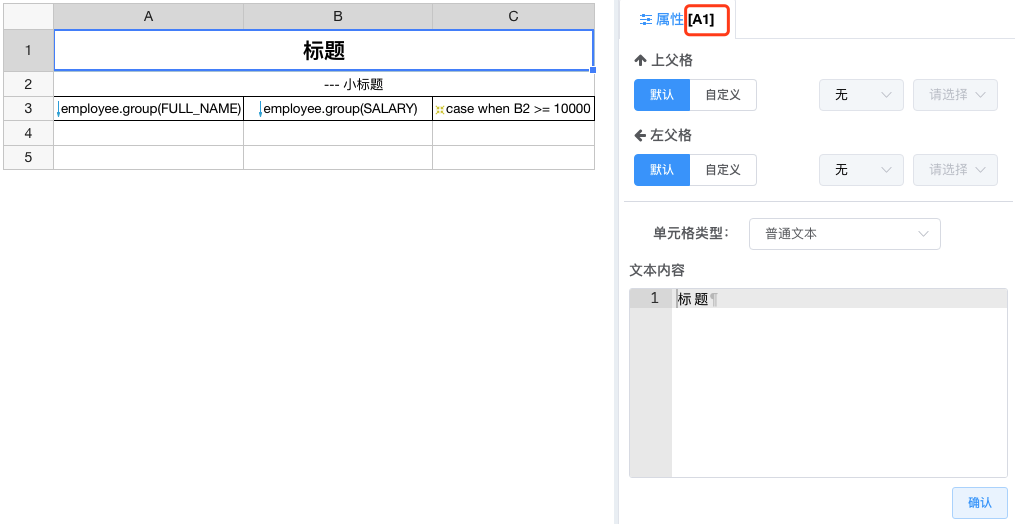
Text cells are relatively simple. You can input any descriptive static text, adjust formatting, fonts, colors, etc., similar to editing Excel cells.
- Before editing text content, ensure the cell name in the property panel is correctly set to the target cell.
- Text cells support the use of environment variables. For environment variable usage, refer to the Using Variables chapter.
- Input content usually takes effect immediately. If it does not, try clicking the
Confirmbutton to manually update.
Expansion Configuration
When the data bound to a cell contains multiple values (e.g., the cell type is Dataset and the Aggregation Method is grouped as a list, or the cell type is Expression), you can configure the Data Expansion Direction.
The next chapter will introduce dataset-type cell configuration.