
Report
Adding Reports to Dashboards
Adding Reports to Dashboards
Adding Reports to Dashboards
Adding Report Dashboards
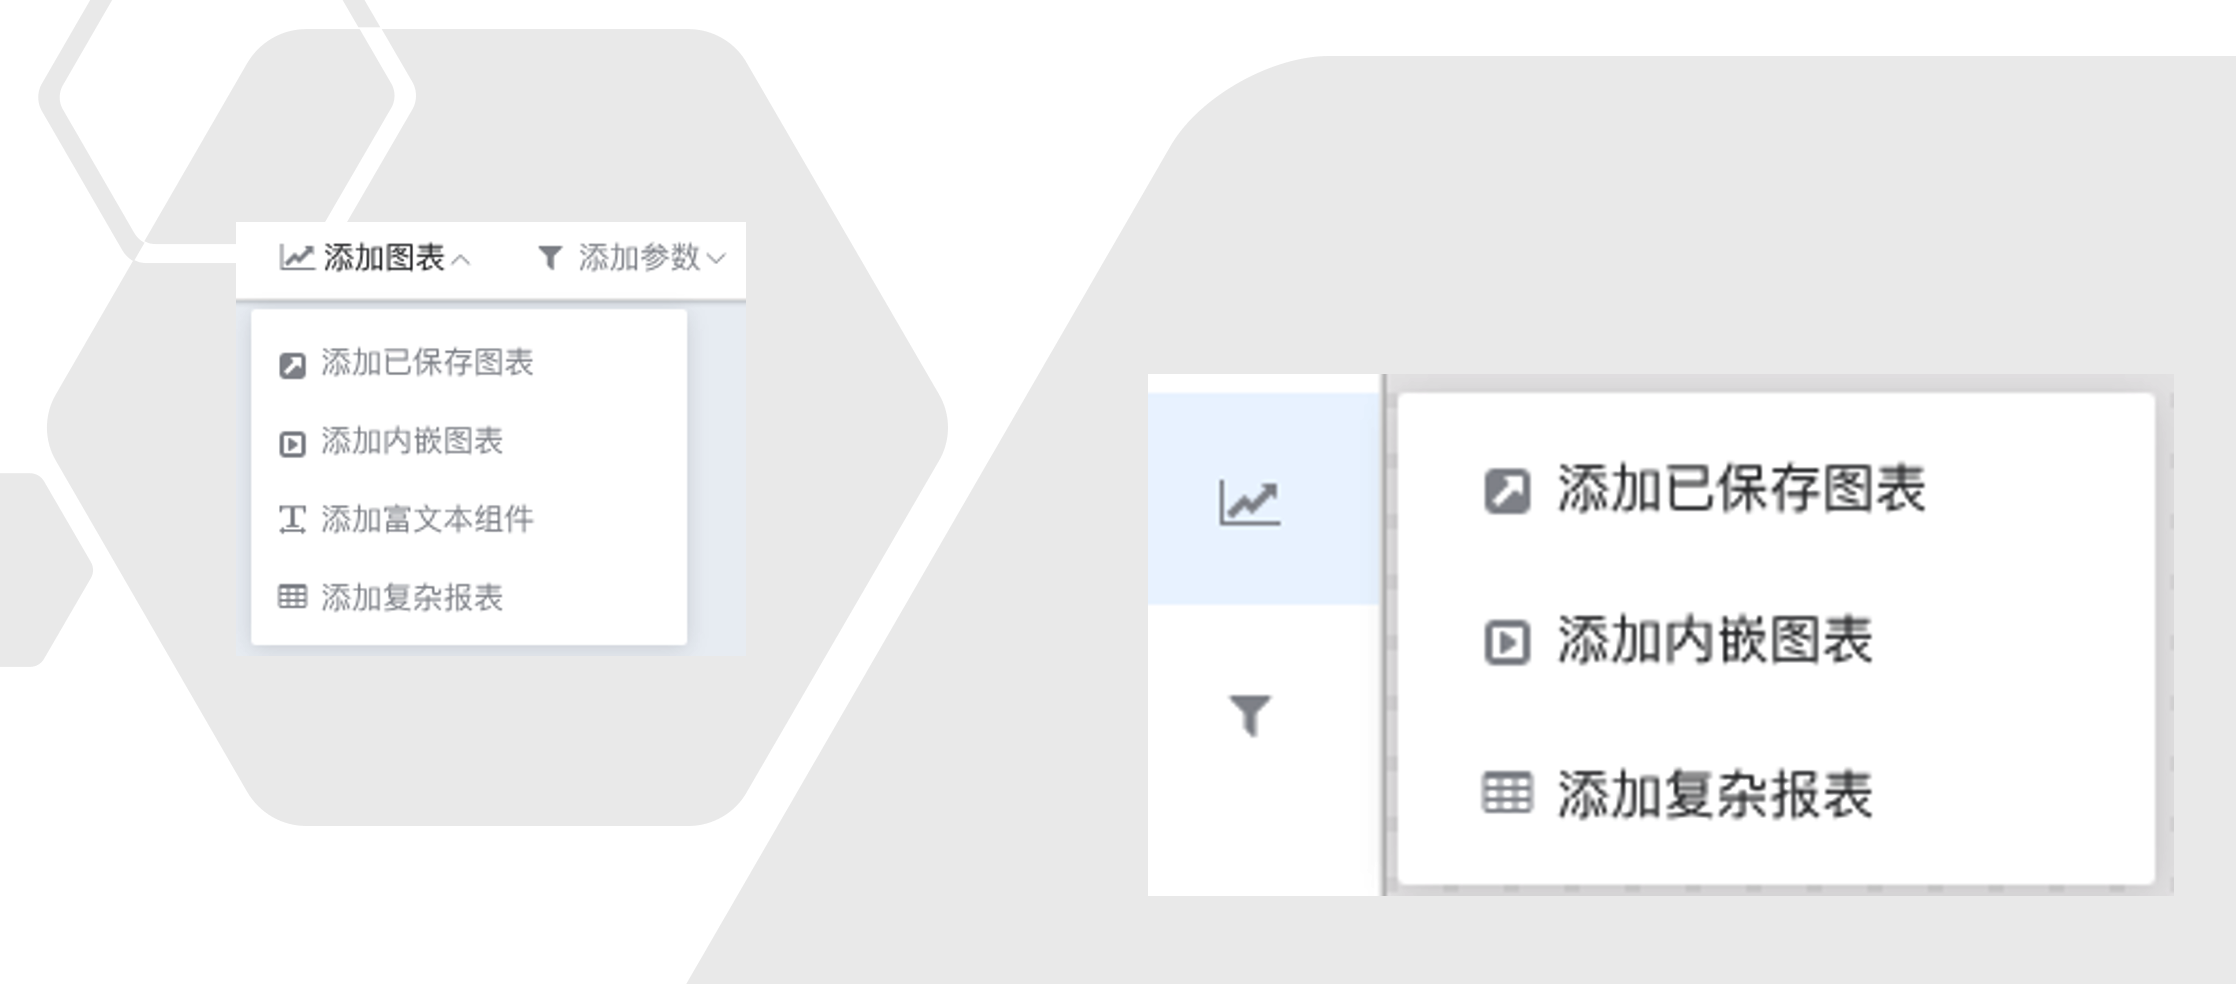
In grid layout and cockpit dashboards, you can add designed reports to the dashboard via the menu Add Chart -> Add Complex Report.
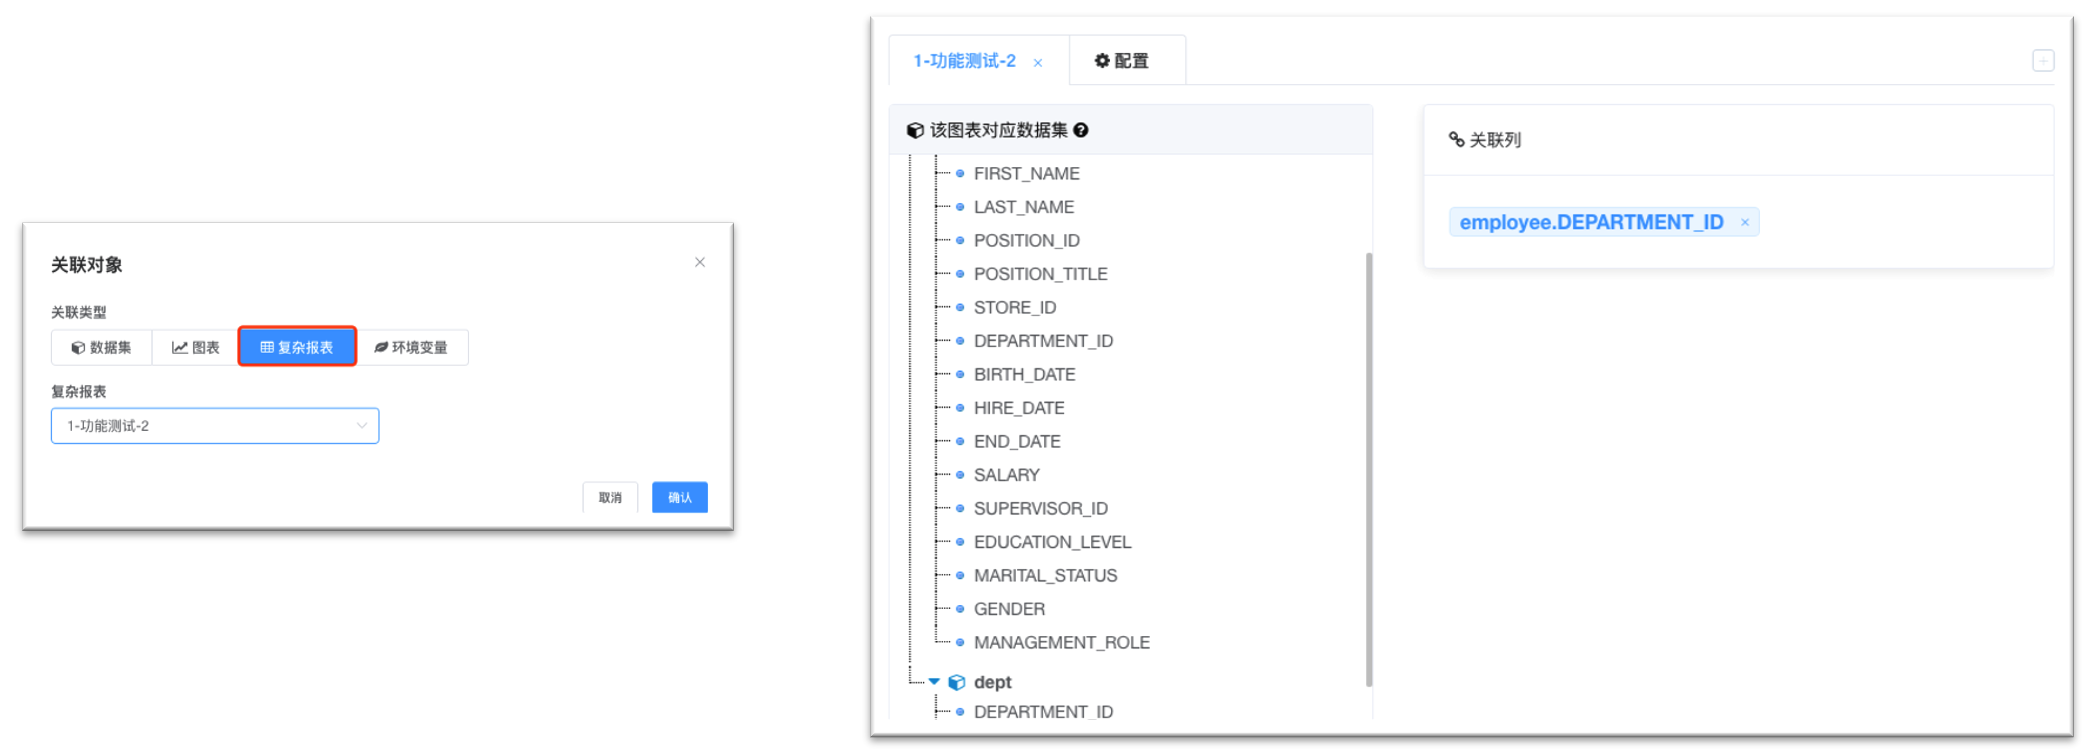
Associating Parameters
Complex Report Type has been added to the parameter linkage objects.
Note
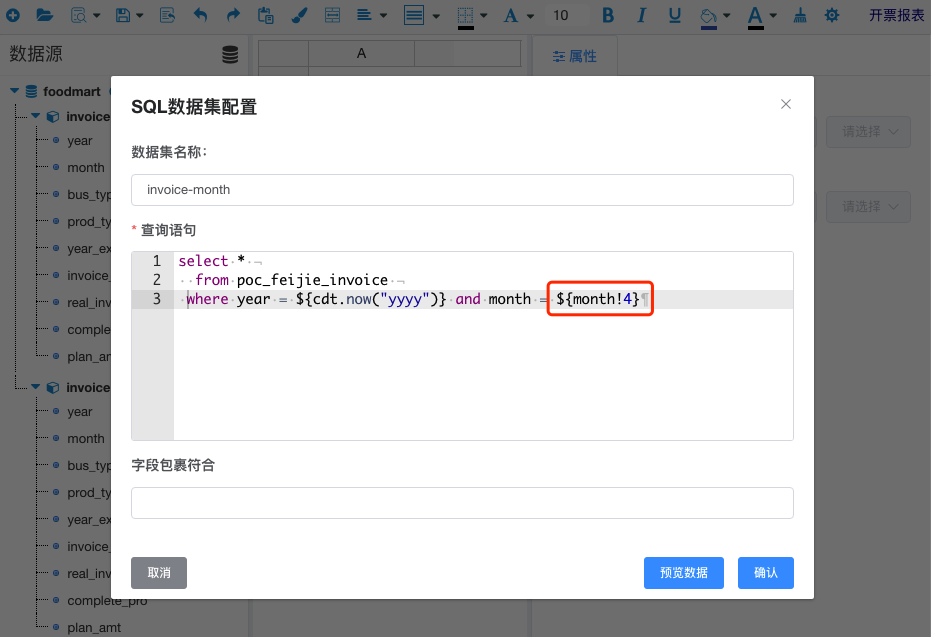
Do not associate fields with aggregated metric fields.
You can also control the data of the report dataset via environment variables.
Setting Linkages
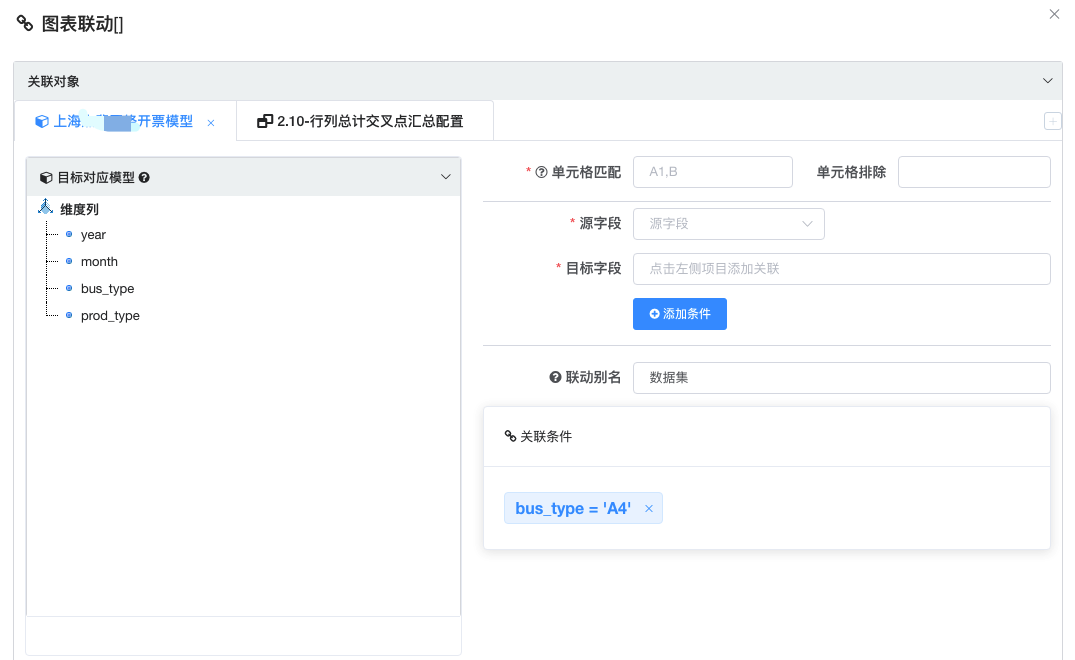
- Set the click event
Cell MatchingandCell Exclusionto select the cells that trigger linkage events.
| Matching Rule | Description |
|---|---|
| A1, B1 | Row-column positioning for detailed cells. Multiple cells can be selected separated by commas, or a single cell can be selected. |
| A, C | Select entire columns A and C. |
| 1, 2 | Select rows 1 and 2. |
Multiple selections can be made separated by commas, and different matching modes can be mixed.
- Select the source field type as
Cellfrom the dropdown and enter the value expression. The expression syntax is consistent with the report design syntax. - Click the target model tree to automatically fill in the target field.
- Add conditions.