
Examples
Examples
Examples
Detail Table
Bind the dataset cell and set the aggregation method to list.

Staggered Grouping
As shown in the designer below, set the dataset cells and customize the left parent of B2 to A1.

Output result:
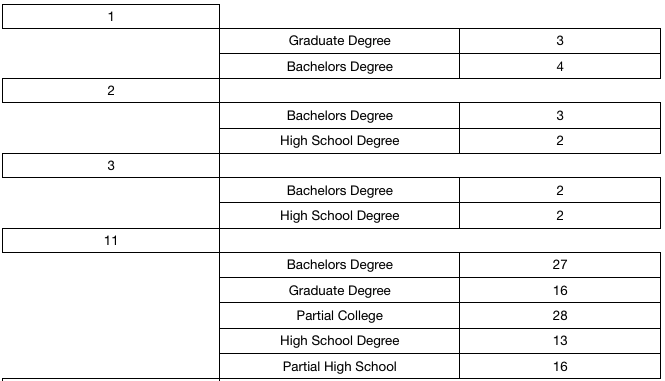
If merging cells
A1andA2, there is no need to set the parent cell for B2.
Cross Table
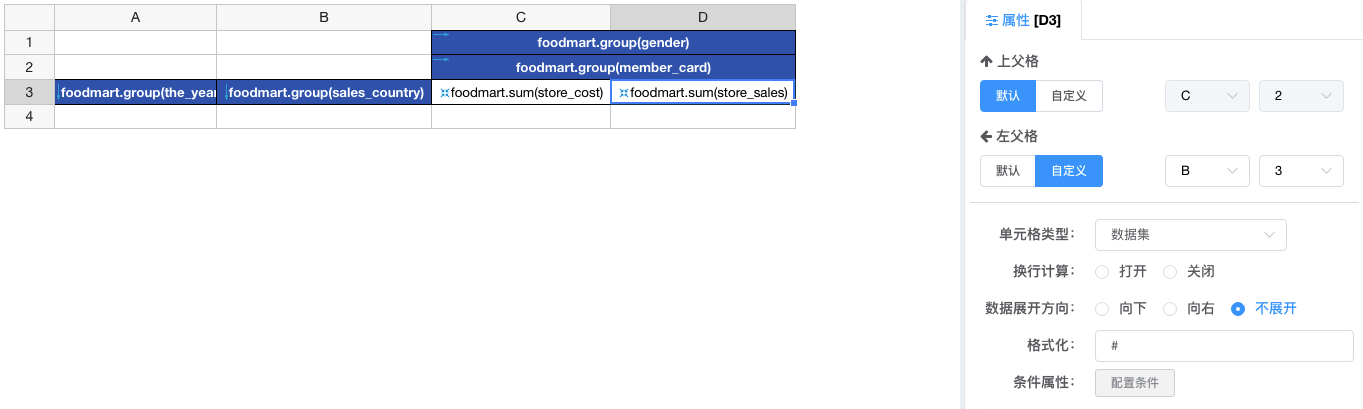
Table Headers
A3, B3: Expand downward
C1, C2: Expand to the right
Metrics
C3: No expansion, aggregation method as sum
D3: No expansion, aggregation method as sum, Since the default left parent of D3 is C3, modify its left parent to header B3
After adjusting column widths, output as follows:

Master-Detail Table
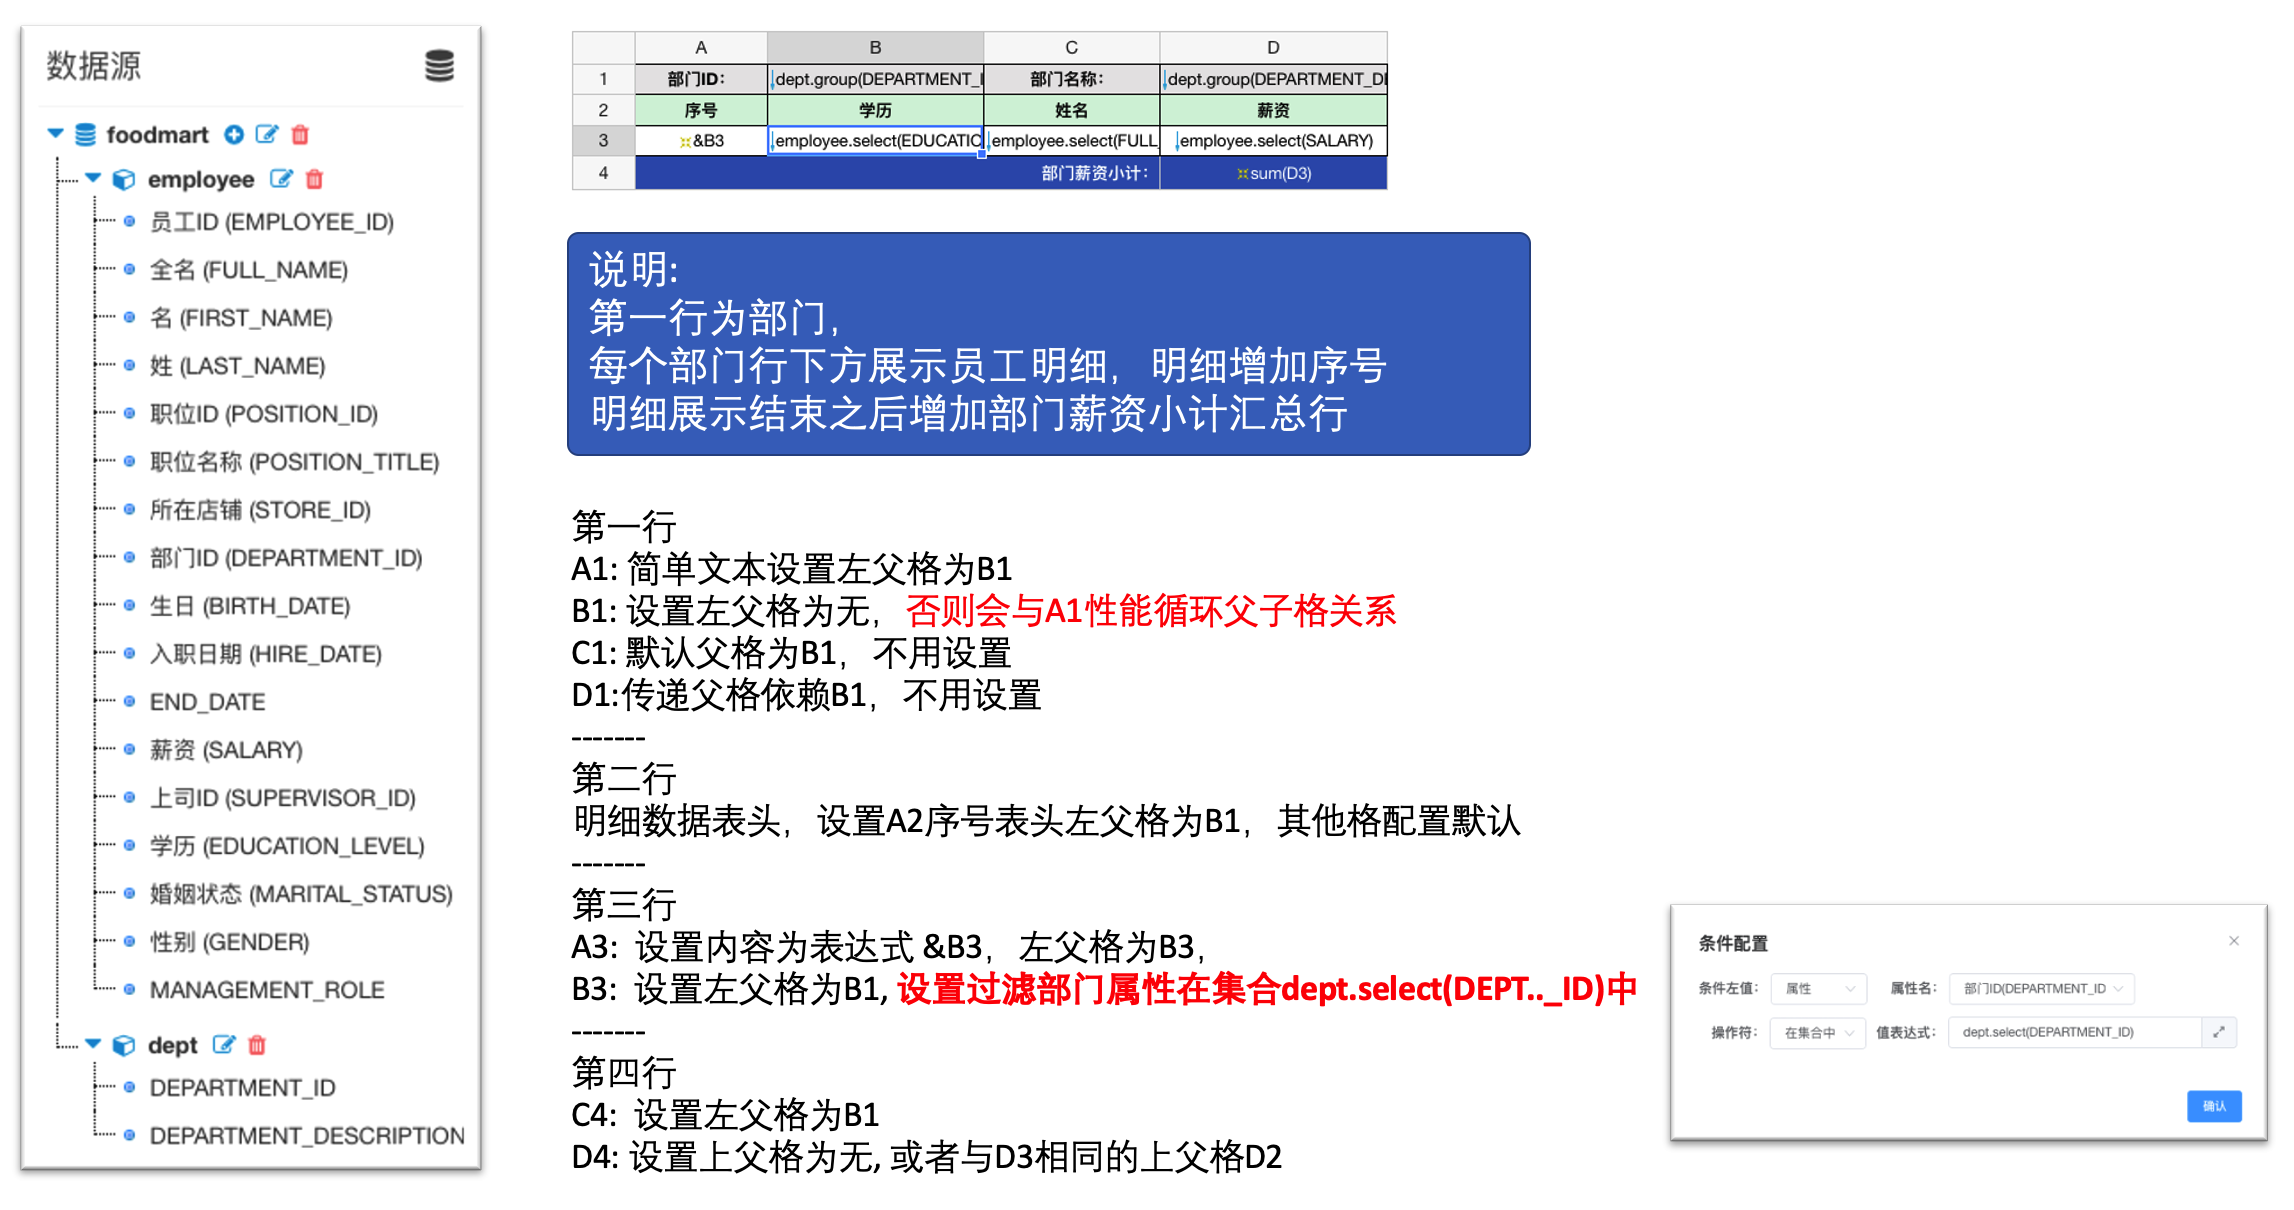
Output result:
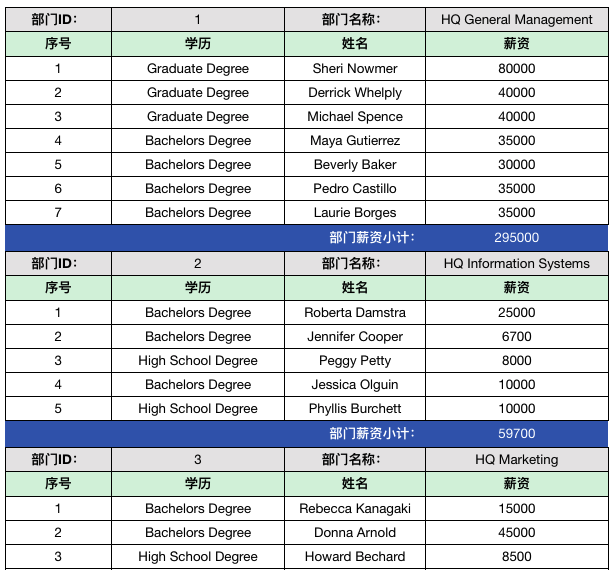
Expansion in Different Directions

A2: Expand downward
B2: Expand to the right
C2: Parent cell set to A2, aggregation method set to count
B1: To prevent B1 from being stretched by B2, set the top parent of B2 to none
Output result:

Statistical Calculations
Refer to the Cell Coordinates section in the Expressions chapter.
Subtotal and Total
Report template as follows:
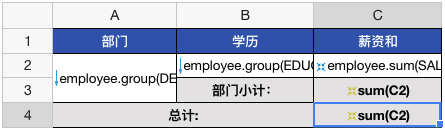
- Headers: Simple headers, no special handling required.
- Dataset Cells:
- A2: Merge A2 and A3; content of A2 is department grouping.
- B2: Education level grouping.
- C2: Salary sum.
- Statistical Expressions:
- C3: Department subtotal, expression sum(C2)
- Left Parent Configuration: Default left parent is B3 -> A2. Since each department is counted once and expands with the department, no modification is needed.
- Top Parent Configuration: To sum C2, set the top parent consistent with C2. The top parent of C2 is C1 (a simple text cell with no expansion), so the top parent can be set to C1 or none.
- C4: Total, expression sum(C2)
- Set the top parent to none.
- C3: Department subtotal, expression sum(C2)
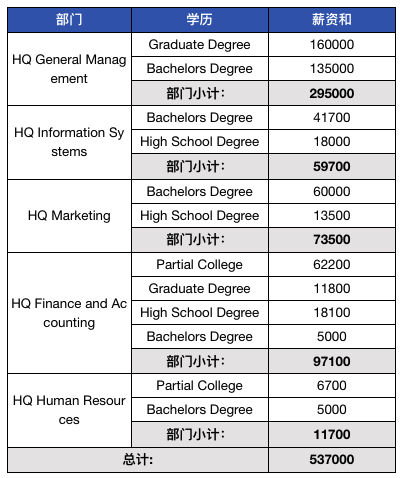
Output result:
Chain Ratio
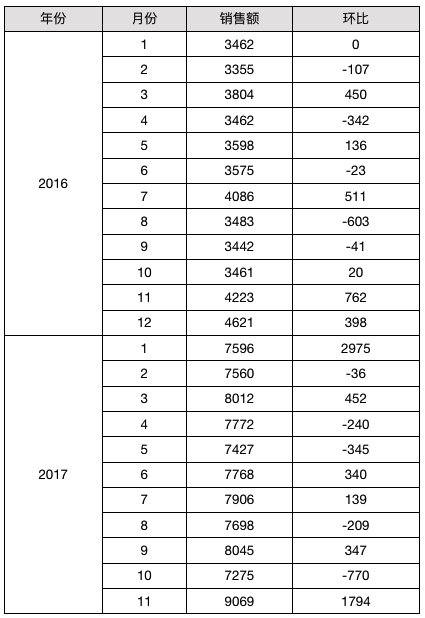
Report template as follows:

C2 - C2[B2@!-1]
C2[B2@!-1] takes the C2 cell corresponding to the B2 cell one cell above (negative value after exclamation indicates upward displacement) relative to the current cell's B2 cell.
Year-over-Year
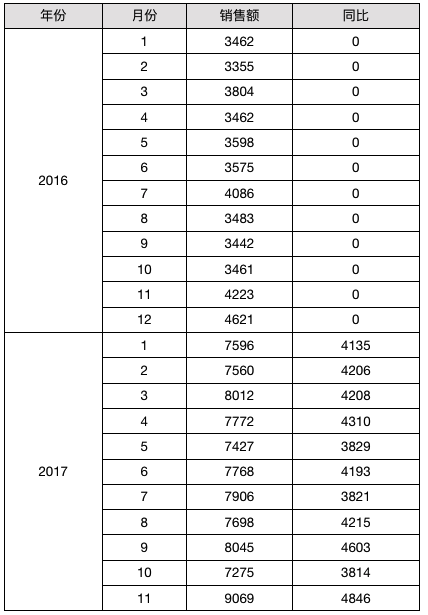
Report template as shown below:

In the template above, cell D2 first takes the value of cell C2 in the same row, then uses cell coordinates to take the previous A2 cell record (@-1 indicates coordinate upward shift) of the A2 cell in the row where D2 is located, and then takes the C2 cell corresponding to this A2. However, since there are still multiple C2 cells under it, a condition B2==$B2 is added here. The first B2 here represents the value of B2 corresponding to the row where the current cell is located, and $B2 represents the value of the B2 cell corresponding to the C2 cell after coordinate positioning. The condition is that they must be equal, essentially meaning the month must be equal, thus achieving the year-over-year purpose.
About $B2
Adding a $ symbol before the cell name indicates taking the value of the cell relative to the target cell, often used in conditional comparisons. For example, in C2[A2@!-1]{B2==$B2}, $B2 refers to the value of the B2 cell corresponding to the retrieved C2 cell.
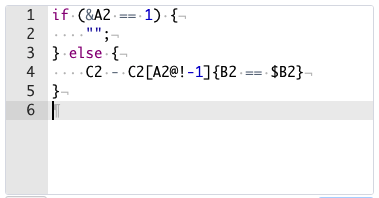
Leave the First Year Blank
You can modify the expression as follows:
About the Use of & Mark
When using "&cell name" to mark the sequence number after the target cell expands, in addition to the above, you need to note that the sequence number will be based on their common parent cell. If they have a common parent cell, the sequence number will be arranged based on the number of target cells in this parent cell. This is reflected in the video tutorial introducing the report calculation model when implementing a detailed master-detail report and numbering the detail data.
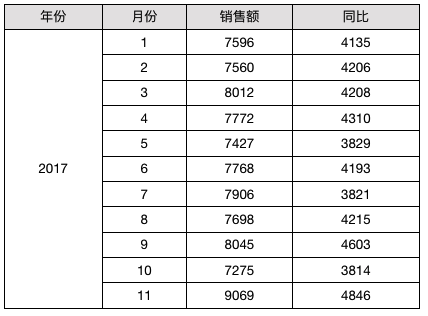
Hide the First Year
You can configure the conditional properties of D2 with &A2==1. The row height of the first element corresponding to A2 expansion is set to 0.

Effect as follows:
Accumulation
Report template as follows:

The expression corresponding to cell D2 is as follows:
C2 + D2[A2@!-1]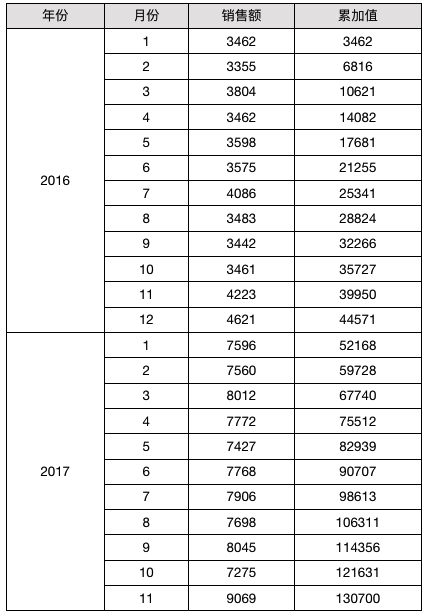
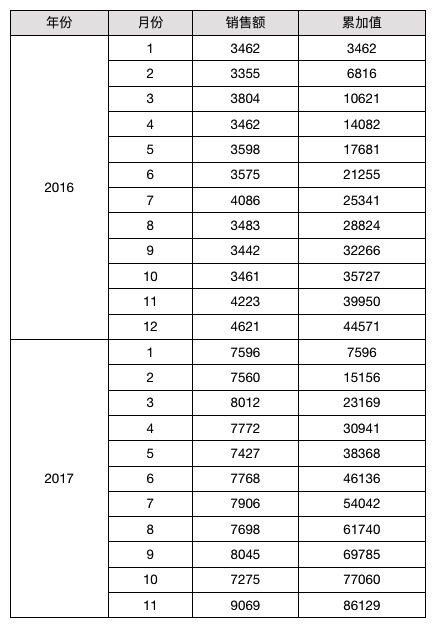
Accumulate by year grouping:
-- Reset accumulation when the new month expansion coordinate is 1
if (&B2 == 1) {
    return C2
} else {
    return C2 + D2[B2@!-1]
}
Result as follows:
Top Parent Offset
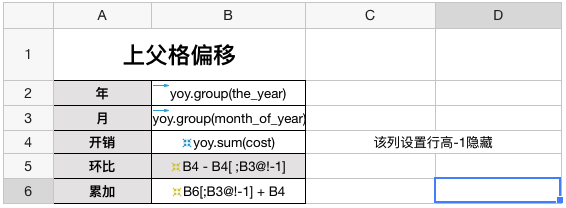
- B2, B3: Year and month dataset cells, aggregation method as grouping.
- B4: Metric summary, set any column row height to -1 in this row to hide the row.
- B5: Chain ratio difference.
- Expression cell, content:
B4 - B4[ ;B3@!-1]. - B4[ ;B3@!-1]: Only set top parent coordinate.
B3@!-1takes the content of B3 shifted left by one cell relative to the current corresponding B3 after expansion.
- Expression cell, content:
- B6: Accumulated value of B4 expenses.
- Expression cell, content:
B6[;B3@!-1] + B4. B6[;B3@!-1]: Relative to B3, take its previous value and add it to the current column's B4 expenses.
- Expression cell, content:
Final output result (month values limited for display effect):

Proportion
Used to count the sum of all data in column C2.
| Example | Explanation |
|---|---|
| C2/sum(C2[]) | Overall proportion |
| C2/sum(C2[A2, B2]) | Proportion by A2 + B2 classification |
| C2/sum(C2[]{A2 == $A2 and B2 == $B2}) | Proportion by A2 + B2 classification |
Report template as follows:

Result:
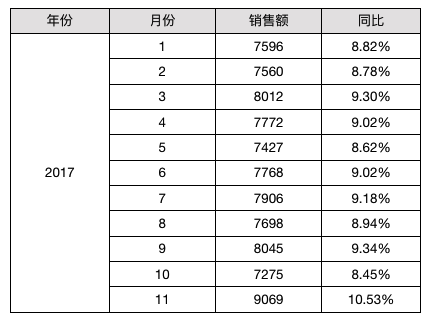
In the above accumulation denominator, after retrieving the cell array corresponding to the group, the sum() function is used. For specific function-related introductions, please refer to the Functions Chapter.