
Grid Dashboard
Grid Dashboard
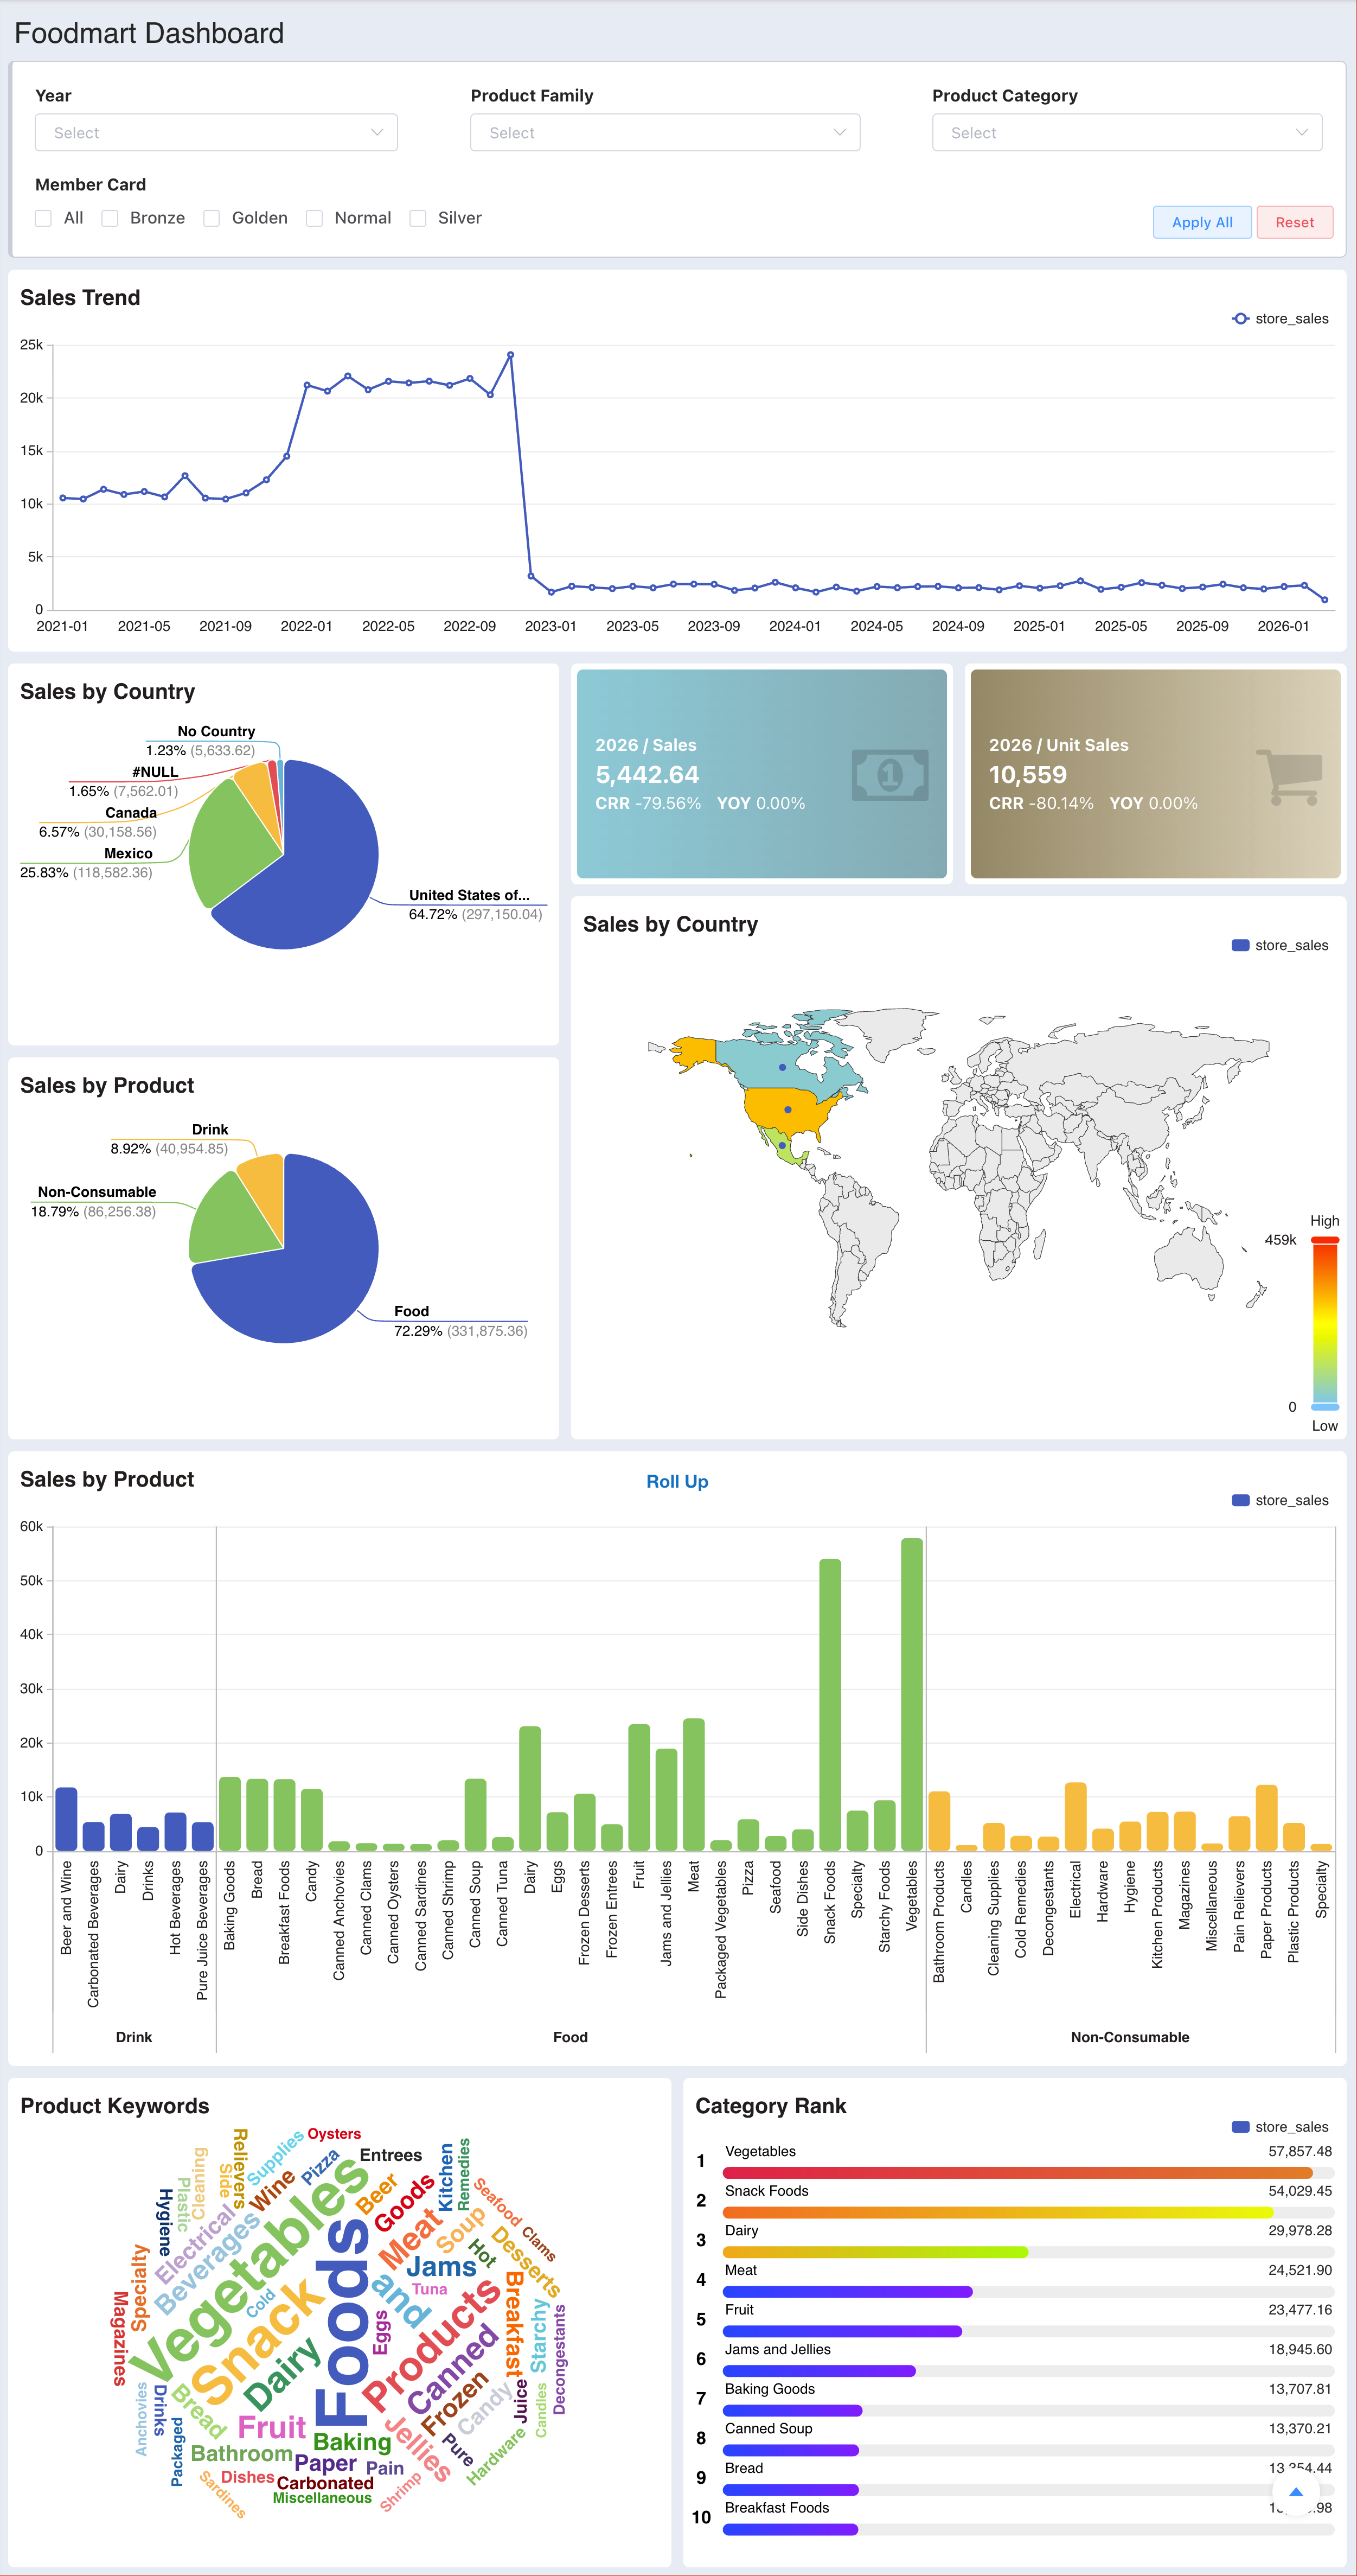
A Data Dashboard is a visualization tool used to combine and display multiple key performance indicators (KPIs), charts, and analysis results. It helps users quickly understand business conditions, monitor trends, and make decisions.
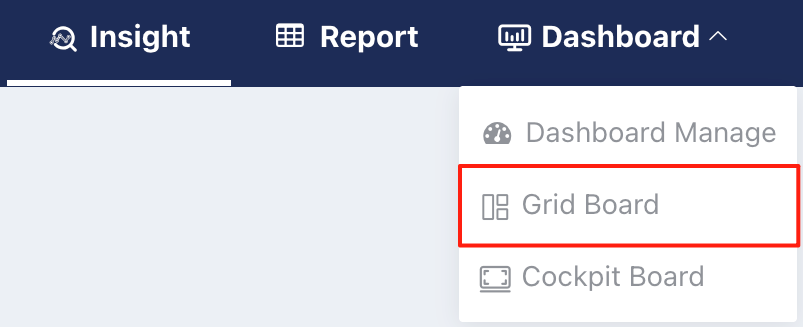
Click the top navigation bar Dashboard -> Grid Dashboard menu to enter the Grid Dashboard design page.
Designing Steps
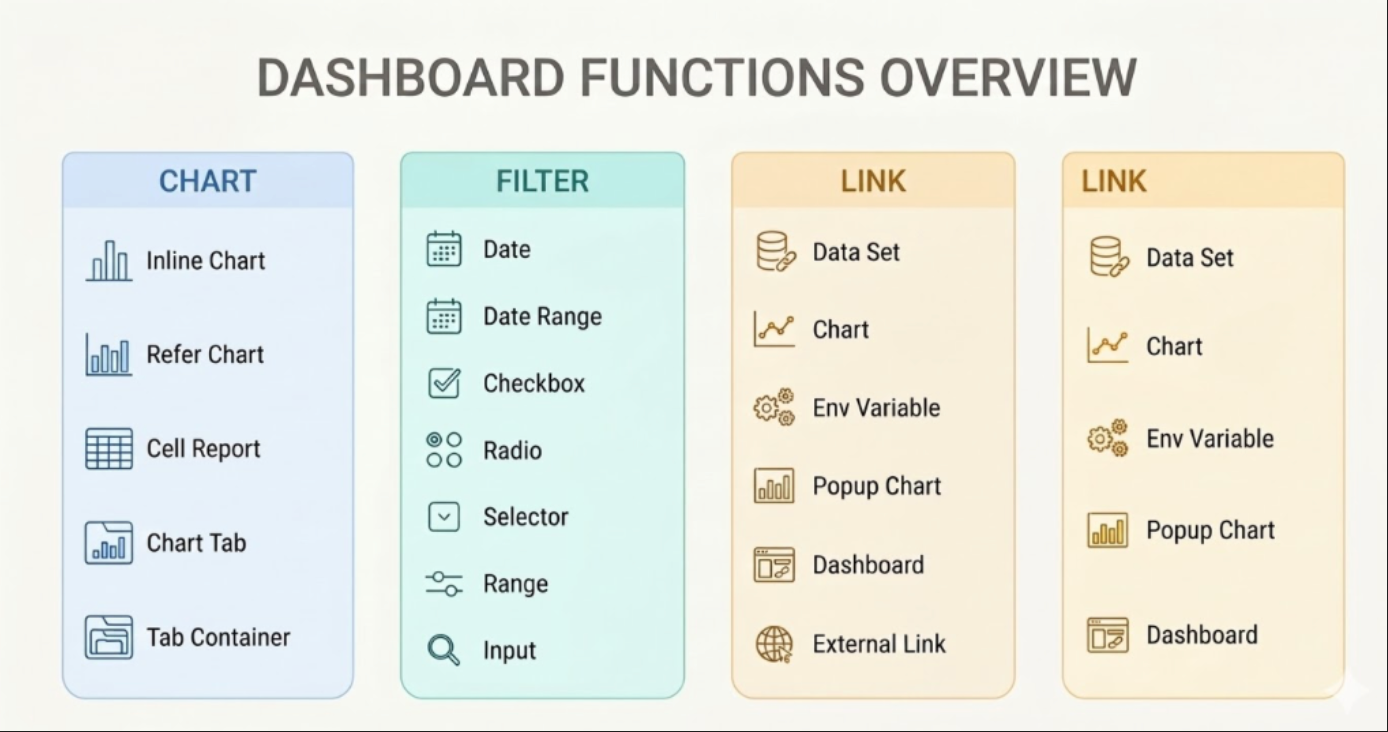
Creating a data dashboard mainly involves the following steps:
Add Charts
Select appropriate chart types for displaying data, such as bar charts, line charts, etc., and determine their layout on the dashboard.
Add Filter(Board Parameter)
Configure query conditions like date ranges, dropdown selectors, etc., allowing users to filter and view data as needed.
Set Click Link(Optional)
Define data interaction logic between different components, such as updating other chart content when clicking an element in one chart, enhancing the depth of data analysis.
Other Configurations(Optional)
Include adjusting interface details like background color, theme color, titles, and setting up sharing functionality to ensure the dashboard is both visually appealing and practical. These steps work together to help users effectively gain insights into data value.
Grid and Cockpit Board
- The canvas height of the grid layout can be extended infinitely, while the cockpit (large screen) layout canvas is designed to fit the fixed aspect ratio of a full-screen monitor.
- Components in the grid layout cannot overlap, while components in the cockpit layout can overlap freely with layer concepts (analogous to PowerPoint and Photoshop). The cockpit layout supports richer elements that can be arbitrarily combined and stacked.
Tip
The order of menu items and icon styles in the functional area may have slight adjustments during product upgrades. Please refer to the actual released version.
Creating and Opening
- File menu -> New Dashboard / Open Dashboard
- Click the Open menu, double-click a dashboard on the dashboard directory tree to open it.

Layout Auto-Width
Quick Width Setting
Remaining Width Filling
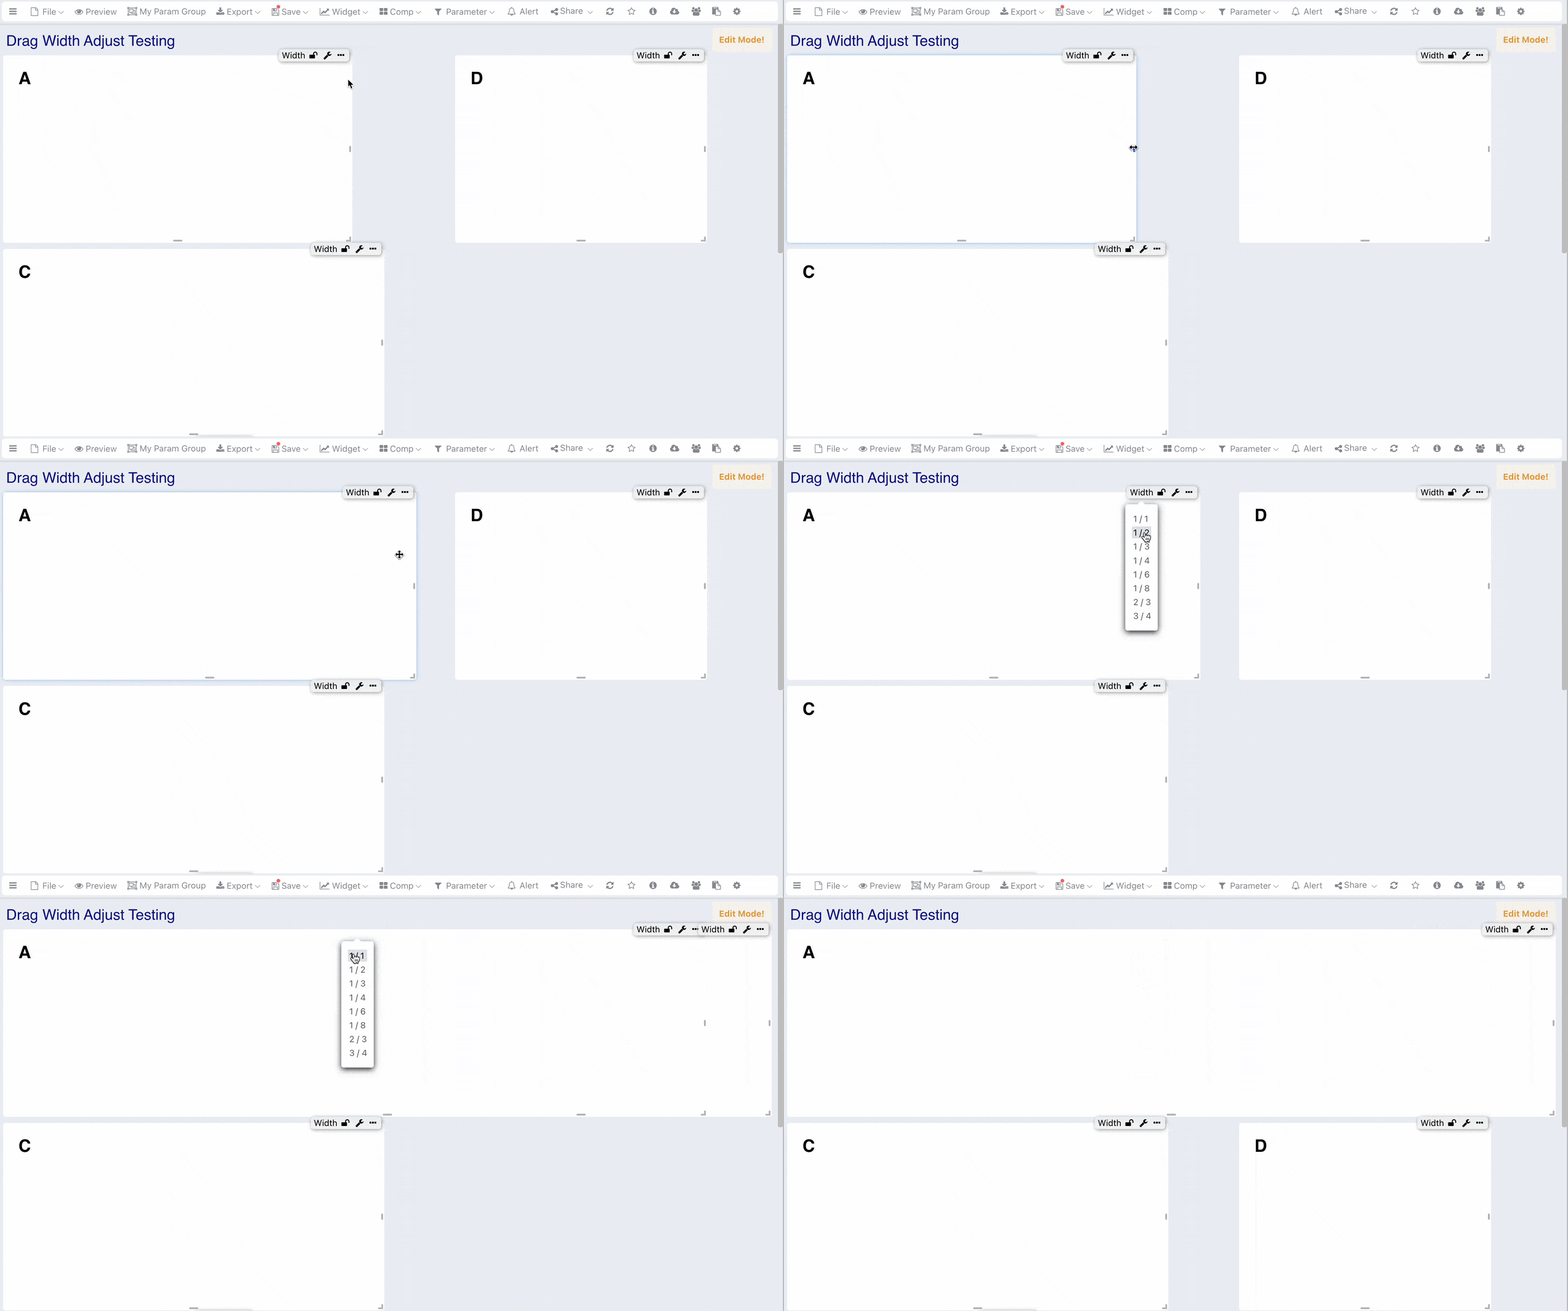
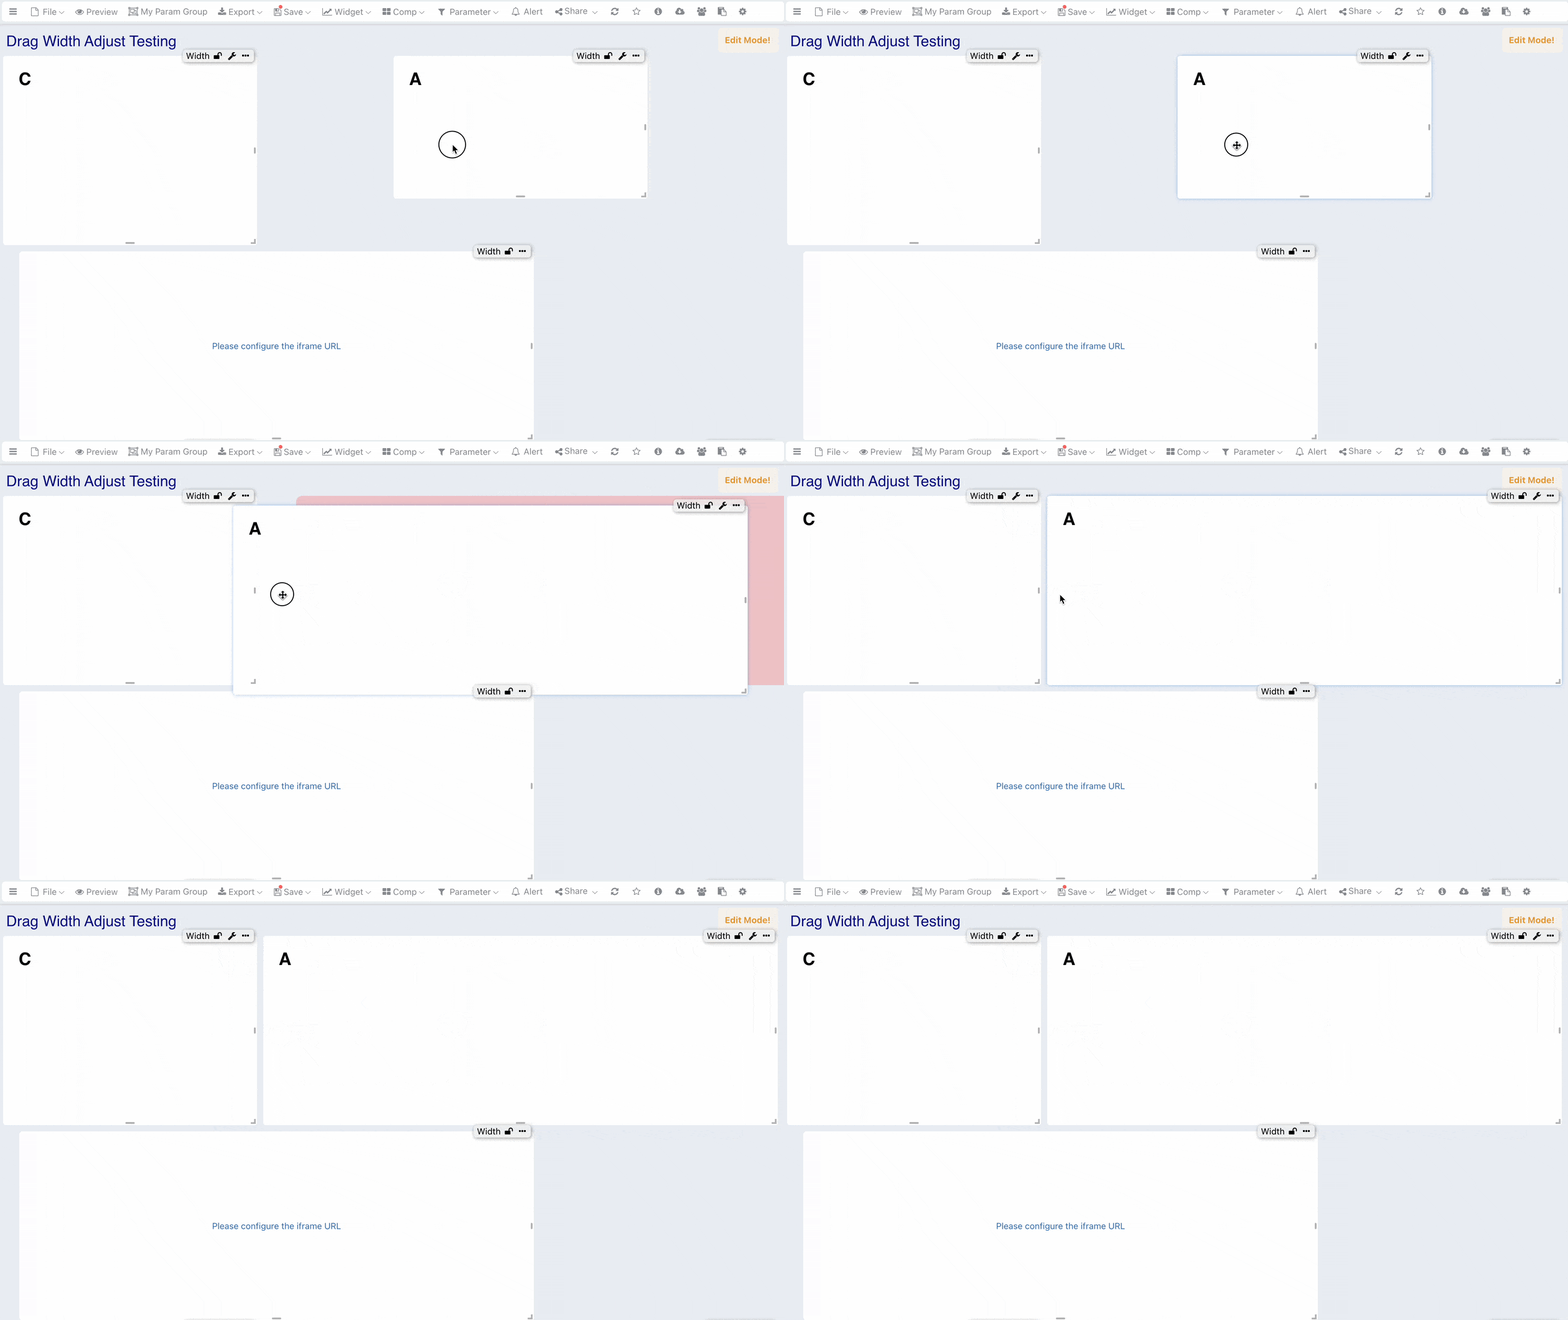
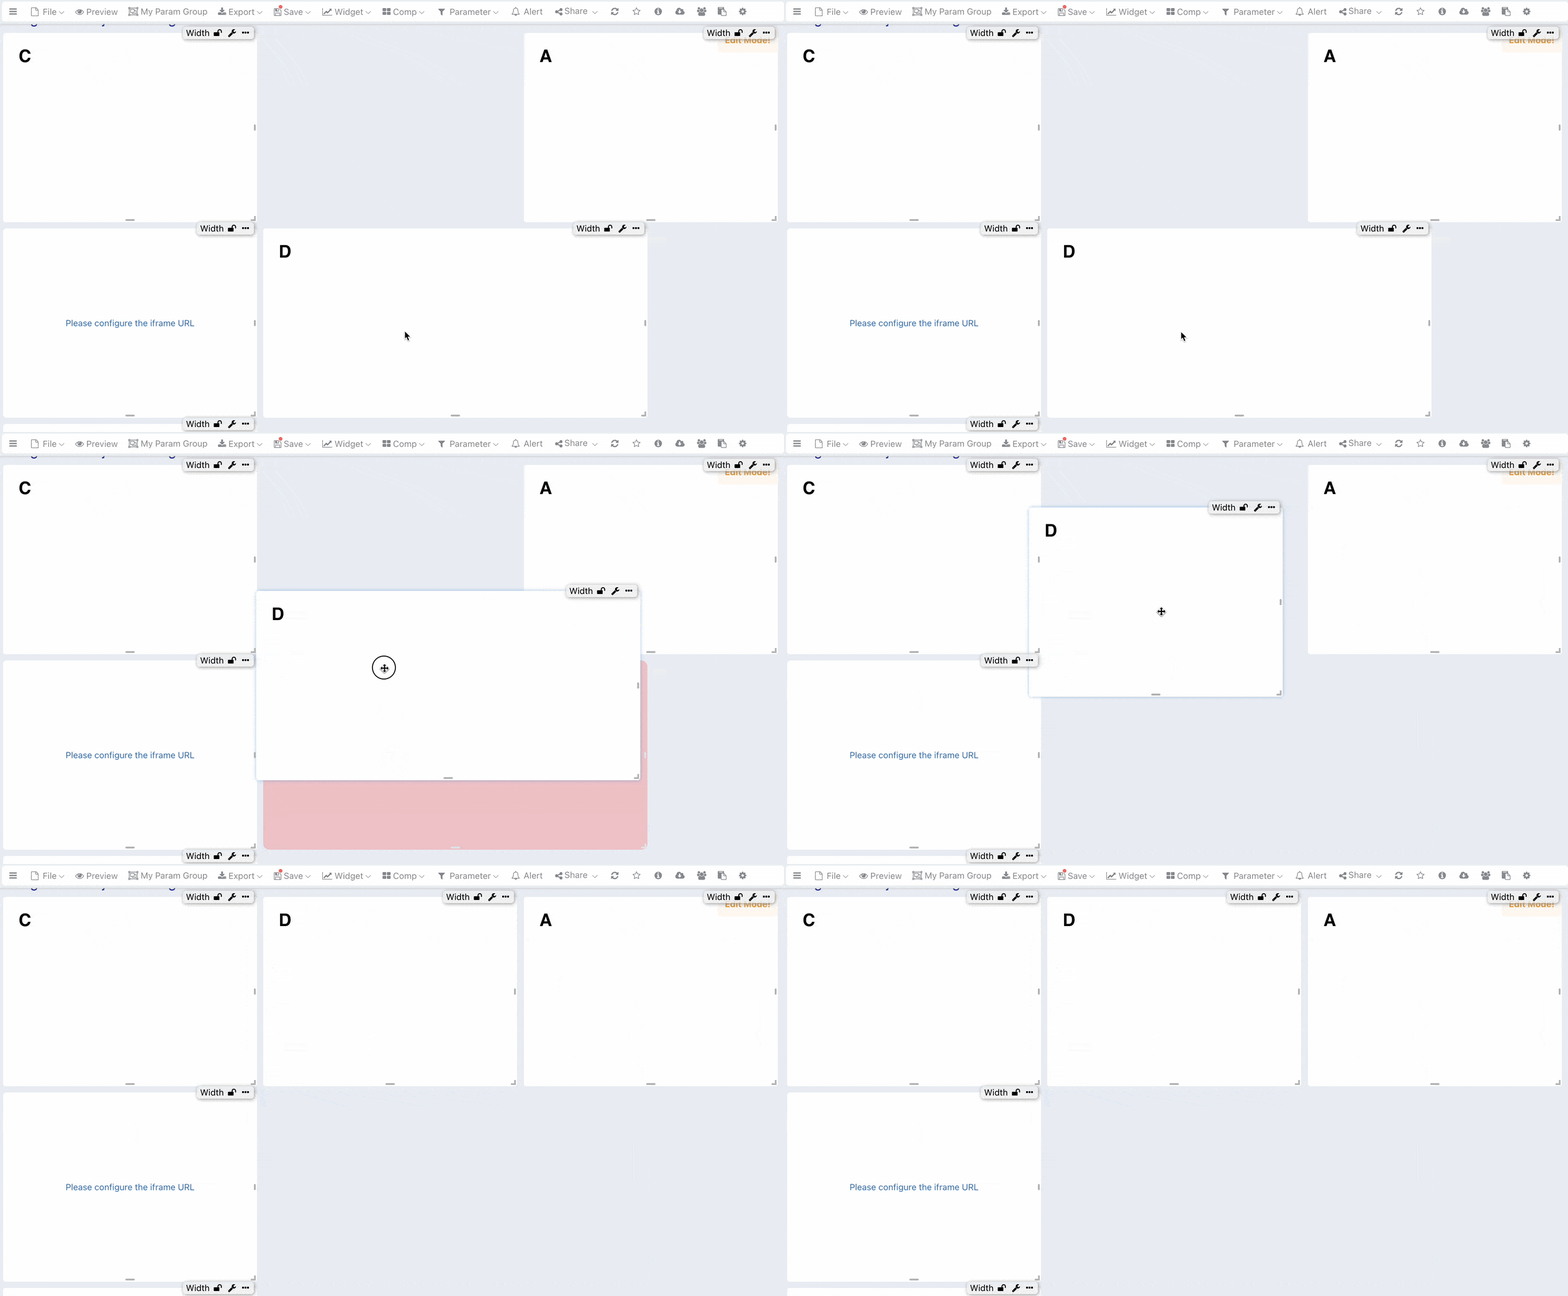
Grid layout drag-and-drop width auto-adaptation. After the dragged block overlaps with the target block, the remaining space on the right is calculated relative to the target block.
Dragging Tip
In the demonstration below, after the dragged block overlaps with Block C, auto-adaptation calculation is triggered. Since there are no other blocks to the right of the dragged block, it automatically fills the remaining width.
Gap Column Width
Dragging Tip
In the demonstration below, after Block B overlaps with Block C, auto-adaptation calculation is triggered. Since there are other blocks to the right of the dragged block, the maximum allowable width is calculated. Adaptation does not occur when the remaining width is less than 1/4.
Dashboard Sharing
Public Sharing
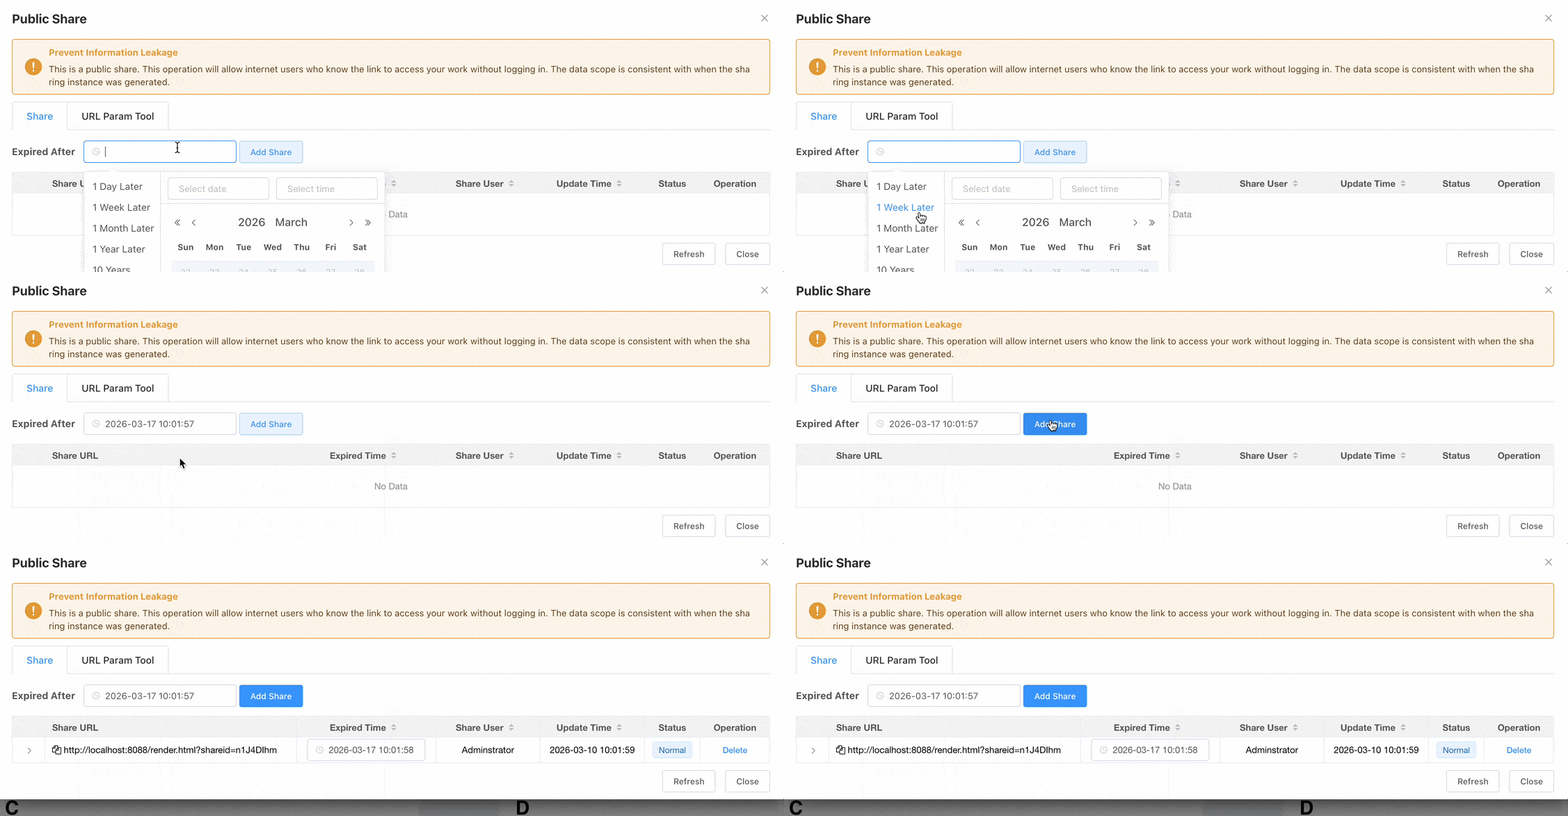
- Dashboard sharing allows sharing dashboards with others who do not have an account or do not have permission to view the current dashboard.
- Shared links can be used for integration with external systems.
- Sharing permission is read-only.
- The shared state currently only includes the default parameter values set on the dashboard, not parameters modified after linkages or changes.
- For data security in sharing, shared links need to have an expiration date set.
Why Dynamic Dates Don't Take Effect in Dashboard Sharing
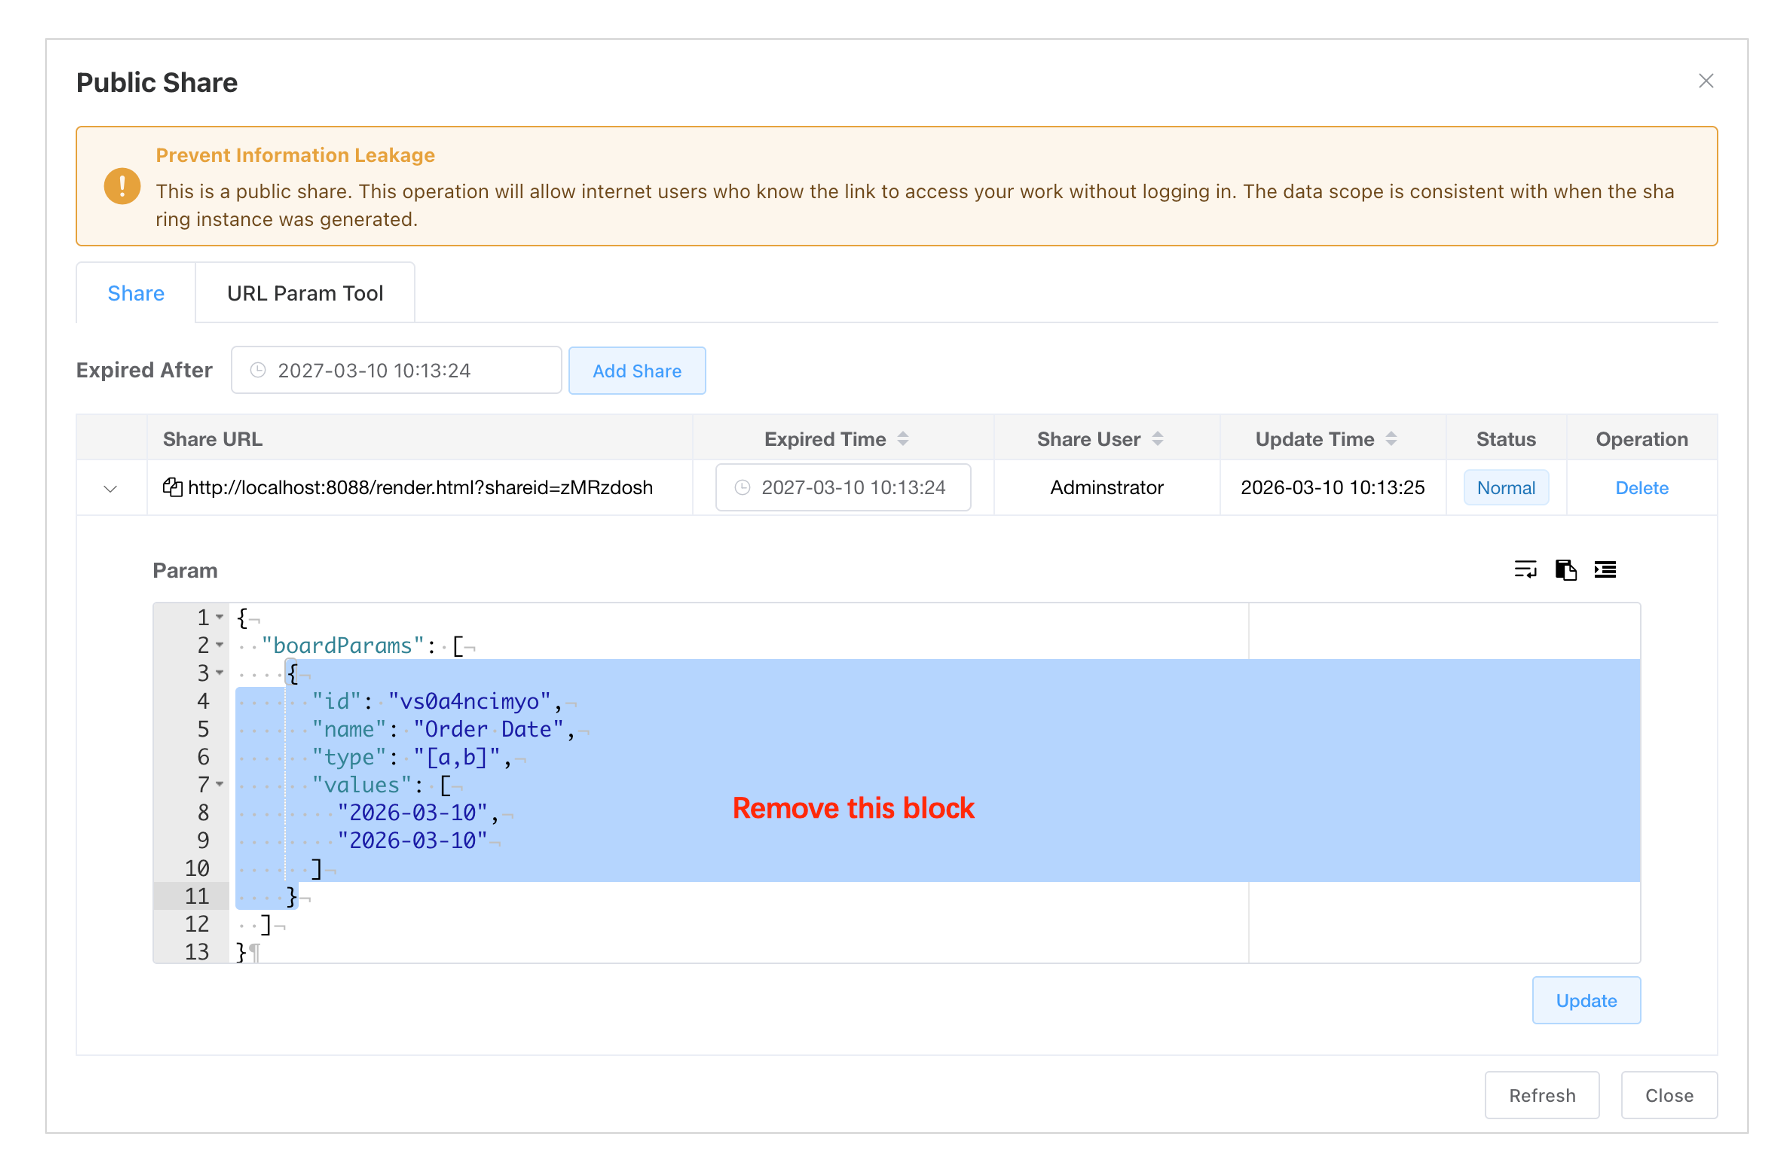
Dashboard sharing instances use a stateful link form. To ensure viewers see data consistent with the sharer, the sharing instance includes the dashboard query parameter values at the time of sharing generation.
In terms of parameter priority, the date parameters in the sharing instance take precedence over dynamic date settings. Therefore, if specific date values are already configured in the sharing instance, dynamic dates will not take effect.
If dynamic date functionality is needed in dashboard integration, you can enable dynamic date logic by editing the parameter configuration of the sharing instance and deleting the date parameter settings.
Link with Parameters state
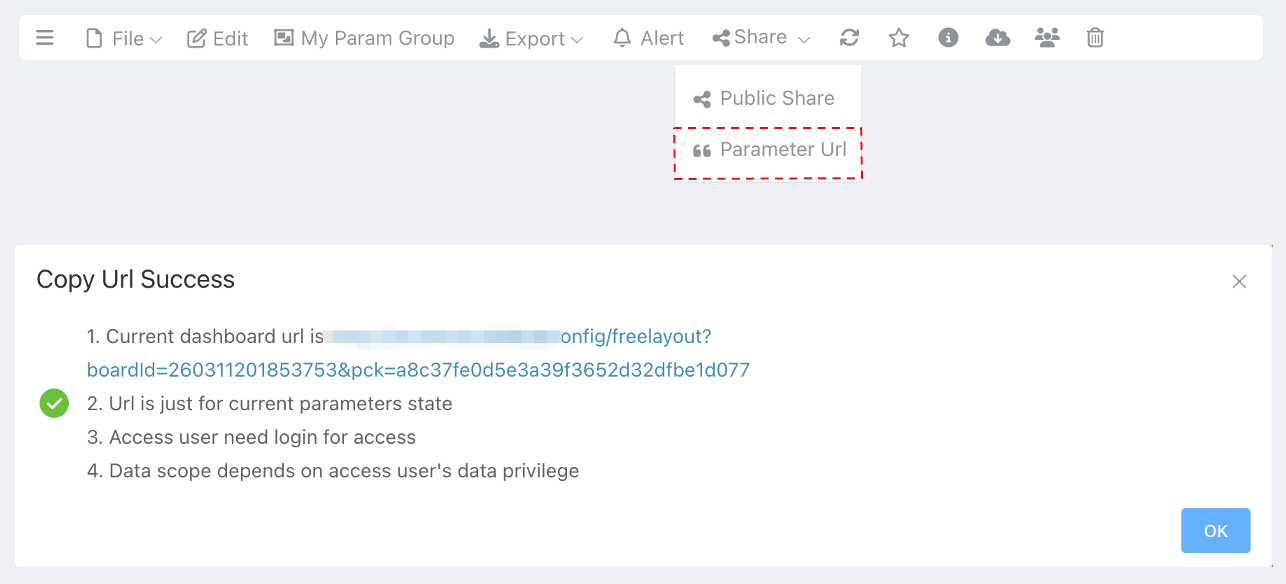
A link with parameters state is a private sharing method. When the link is generated, the dashboard's query conditions are saved. Recipients see content consistent with the sharer's view when opening the link.
| Sharing Type | Query Parameter State | Login Required | Data Permission Scope |
|---|---|---|---|
| Parameter Url | This link only saves the dashboard parameter state at the time of link generation. | Required | The data scope seen by the viewer is related to their own permissions. The viewer's data scope may differ from what you currently display. |
| Public Sharing | This link only saves the dashboard parameter state at the time of link generation. | Not Required | The data scope seen by the viewer is the same as the sharer's permissions. |
Dashboard Export
- Dashboard export can choose to export as Excel or image. Exporting in Excel format provides separate worksheets for table components to facilitate user secondary operations.
- The new version of dashboard export can preserve the current dashboard parameter state and chart linkage state.