
Chart Fine-tuning Developer Mode
Chart Fine-tuning Developer Mode
With the increasing business scenarios for data dashboards and large-screen displays, preferences for chart themes are also diversifying. Although we currently support hundreds of chart fine-tuning options, and this number is continually expanding based on user feedback, there are always some tuning option requirements that are not well-suited for web ui interactions, or where version release speed is insufficient, impacting users' project delivery. Therefore, starting from version 1.1, we have introduced an advanced developer mode for charts related to ECharts, maximizing the initiative given to users!
What is the Advanced Developer Mode?
The developer mode is targeted at professional developers with experience in front-end JavaScript development and requires an understanding of native ECharts configuration options.
How it Works
Allows users to insert a JavaScript code snippet during fine-tuning. This code runs before echarts.setOption(option).
Through JavaScript code, toolkits, and our exposed relevant API interfaces, users can adjust the relevant properties of the chart configuration option object to achieve any rendering effects supported by ECharts, such as unsupported gradients, graphics watermarks, toolboxes, and all other ECharts configurations not fully covered by our fine-tuning interface.
How to Use?
- Confirm whether the chart is an ECharts chart (currently, all charts except cross-tables, detail tables, progress bars, and KPI indicator cards belong to ECharts charts).
- At the bottom of the chart fine-tuning panel, you can see the Developer Mode section. Click the code button to open a pop-up displaying the fine-tuning configuration script editor, as shown below:
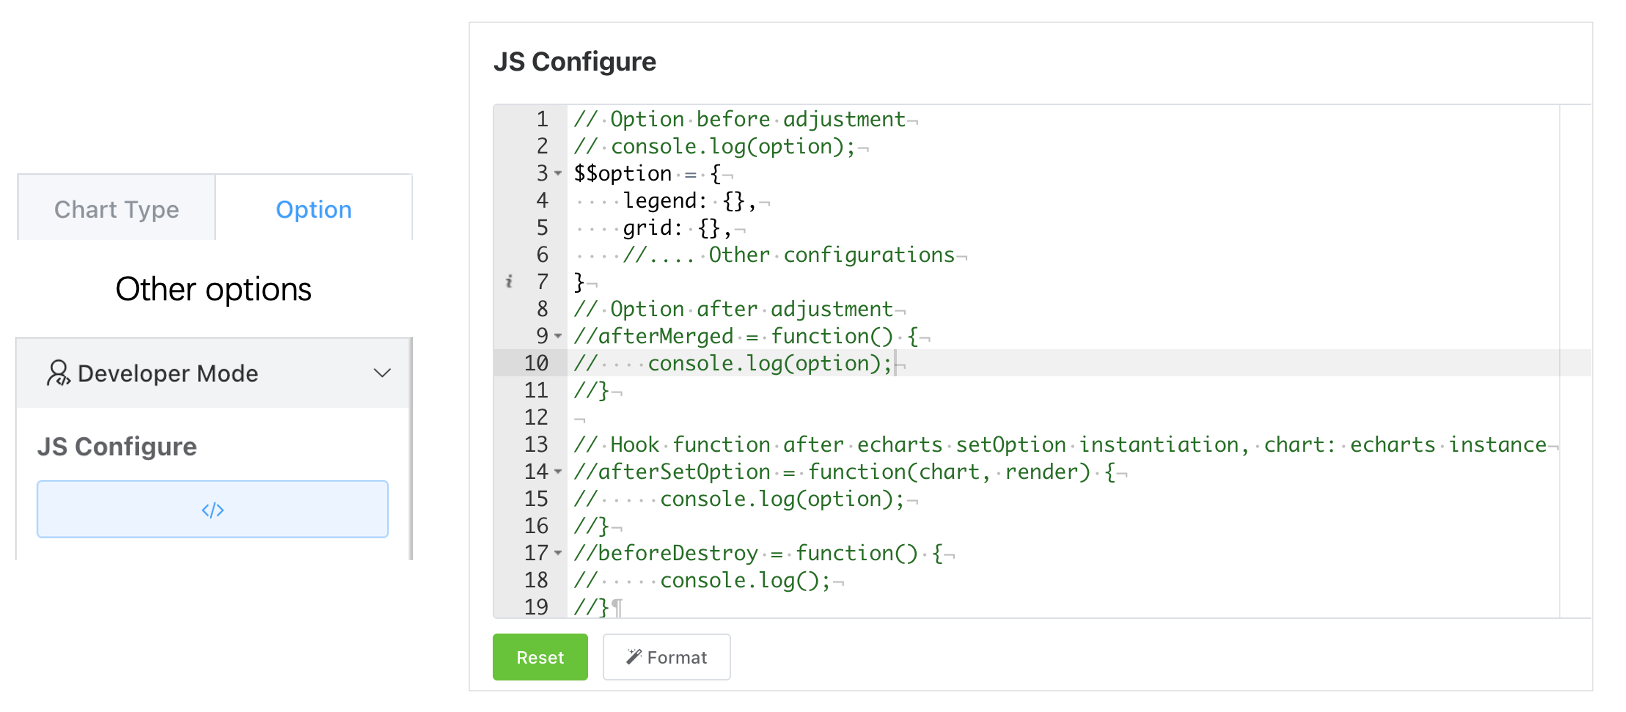
- Introduction to supported variables. In the inserted code snippet, users can use any original, custom, or supported third-party libraries to operate on the
option.
| Variable | Introduction |
|---|---|
option | The configuration object that will eventually be passed to the echarts.setOption interface |
$$option | An object open for user merging, which will be deeply merged with the target option object |
_ | Lodash utility function library |
moment | moment v2.22 time processing library |
numbro | numbro v1 number formatting library |
ChartUtils | iBI chart data processing library, e.g., ChartUtils.linearGradient2Css(color); parses ECharts linear gradient objects into CSS background styles |
| Custom | You can also define your own utility methods in ext.js |
About Deep Merging of Arrays
We know that typical solutions for merging two arrays involve complete overwriting, where the latter replaces the former. In ECharts, many configurations are recorded as objects within arrays. During fine-tuning, often only a few properties within the array items need modification. Therefore, our supported deep merge solution allows users to pass objects at the corresponding index positions in the array, which are then compared and merged into the respective objects within the array.
// Overwrite merge
merge(
	[{ a: true }],
	[{ b: true }, 'ah yup']
) // => [{ b: true }, 'ah yup']

// Explanation of deep array merge
merge(
	[{ a: true }],
	[{ b: true }, 'ah yup']
) // => [{ a: true, b: true }, 'ah yup']
Debugging Tips
The default template is available for reference when you open the editor. After making changes, click the Confirm button to apply them; Cancel will discard any changes. Reset reverts to the initial template state. Use console.log() appropriately to print results to the console.
- Use console.log to observe the specific structure of the
optionobject. - Add
debuggerin the code and open Chrome DevTools (F12) for debugging.
A Few Simple Examples
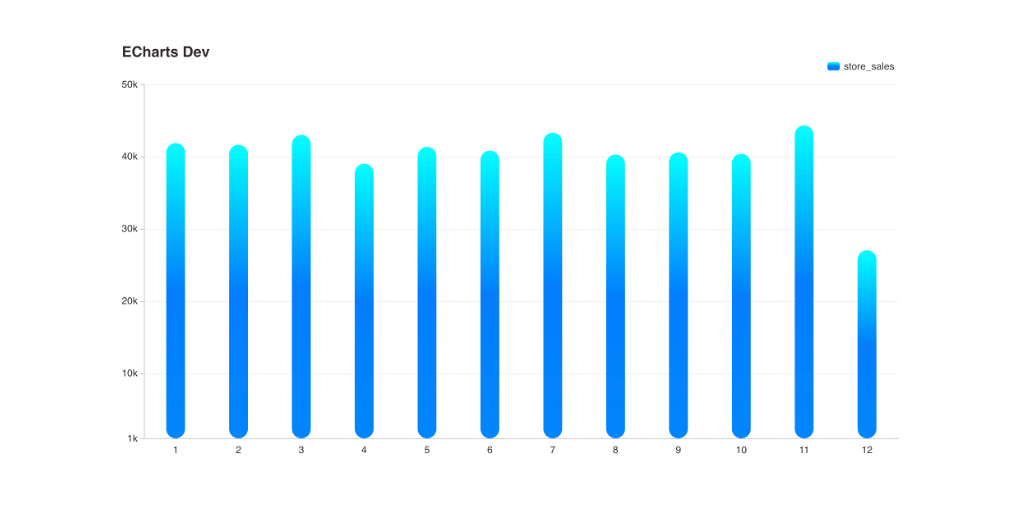
Modifying Legend Color to Gradient
The following code modifies the style of the first series in the series array, including barWidth, color, etc.
$$option = {
  series: [{
            type: 'bar',
            barWidth: '30%',
            itemStyle: {
                normal: {
                    barBorderRadius: 30,
                    color: new echarts.graphic.LinearGradient(
                        0, 0, 0, 1, [{
                                offset: 0,
                                color: '#00feff'
                            },
                            {
                                offset: 0.5,
                                color: '#027eff'
                            },
                            {
                                offset: 1,
                                color: '#0286ff'
                            }
                        ]
                    )
                }
            },

        }
    ]
}

// Gradient color requires removing the tooltip formatter function
delete option.tooltip.formatter;
Adding Graphics Elements
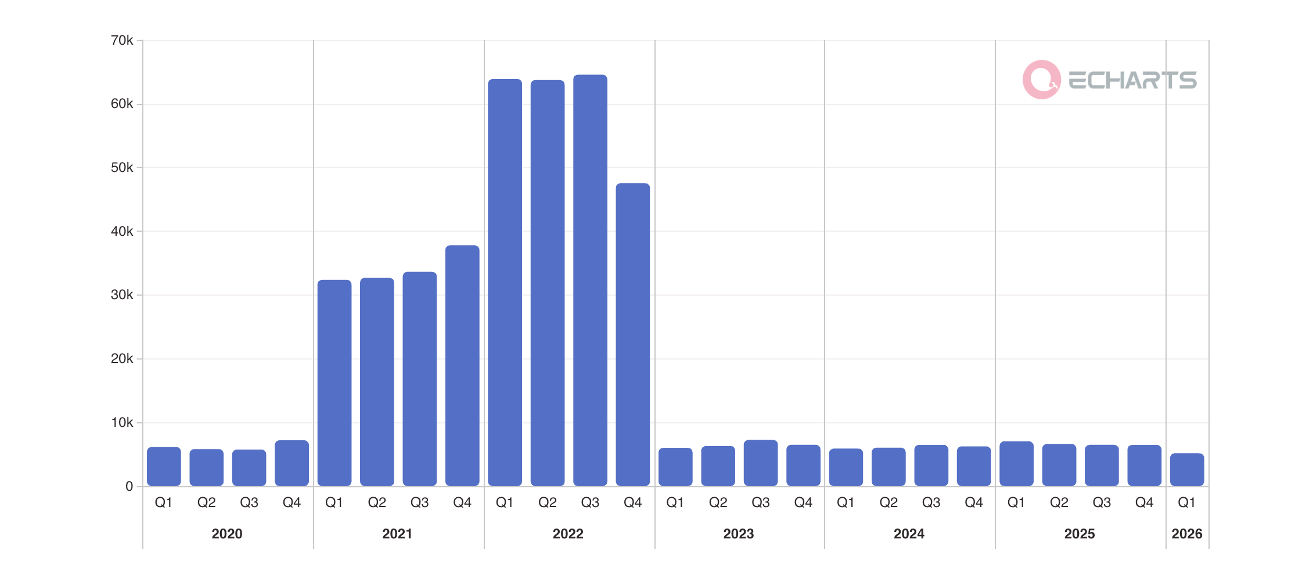
Previously, we mentioned that array merging uses deep merge. However, if we now need to add new elements to graphic, we cannot use the previous merge scheme. Instead, we need to directly insert new drawing elements into option.graphic.
let graphics = [
        {
            type: 'image',
            id: 'logo',
            right: 20,
            top: 20,
            z: -10,
            bounding: 'raw',
            origin: [75, 75],
            style: {
                image: 'https://echarts.apache.org/en/images/logo.png',
                width: 150,
                height: 150,
                opacity: 0.4
            }
        }
    ];

option.graphic = option.graphic || [];
// pushAll is non-standard JavaScript syntax, extended as a method on arrays by the system.
option.graphic.pushAll(graphics);
Custom Tooltip
This example demonstrates using ES6 syntax, the external Lodash library, and parameters provided by ECharts callbacks to handle the tooltip.
$$option = {
  tooltip: {
    formatter(params) {
      let name = params[0].name;
      let s = `<div className="text-left">${name}`;
      _.chain(params)
          .each(p => {
              let {seriesName, value, marker} = p;
              s += `<br/>${marker}`;
              s += `${seriesName}: ${value}`
          })
          .value();
      return s;
    }
  }
}
Funnel Chart with Values in the Middle and Categories on the Right
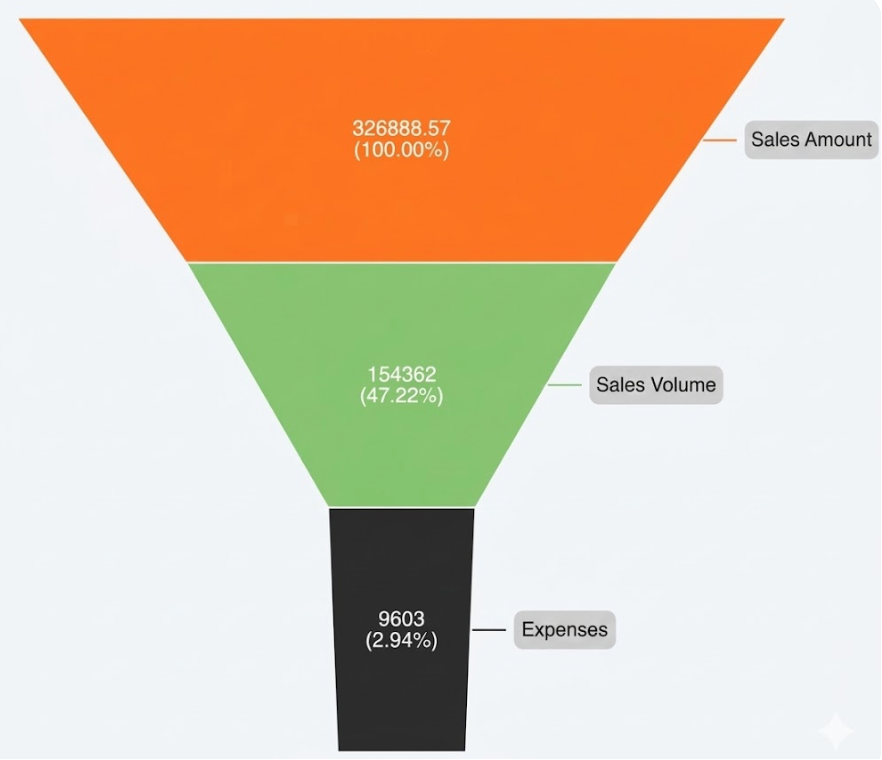
Native ECharts configuration does not support dual labels. The implementation idea requires duplicating a series for label configuration.
const s = option.series[0];
// Same configuration
Object.assign(s, {
     maxSize: '50%',
    //  left: '20%',
});

// Duplicate for non-shared configuration
const s2 = _.cloneDeep(s);

Object.assign(s.label, {
    formatter: '{b}',
    padding: [5, 10],
    backgroundColor: 'lightGrey',
    // align: 'right',
    position: 'right',
});

Object.assign(s2, {
    label: {
        position: 'inside',
        color: 'white',
        formatter(params) {
            let {seriesName, name, value, data} = params;
            const { percent } = data;
            return `${data.value}\n(${percent}%)`;
        }
    }
});

option.series.push(s2);