LOD Expressions
Level Of Detail Expressions
The full name of LOD functions is Level Of Detail Expressions. They are primarily designed to overcome issues of inconsistent calculation granularity between expressions. This article details how to use LOD functions.
Use Cases
Level of Detail expressions refer to the hierarchical levels of data aggregation granularity. Different levels represent different degrees of aggregation and granularity, enabling the handling of problems involving multiple data detail levels within a single visualization view.
If during analysis you need to add a dimension whose detail level is higher or lower than the current visualization's detail level, but you do not wish to change the existing view granularity, you can use the Level of Detail expression functionality.
Syntax Description
{[FIXED | INCLUDE | EXCLUDE] <Dimension Declaration> : <Aggregation Expression>}FIXED
Syntax: {FIXED <Dimensions> : <Aggregate Function>}
- Execution timing: It scans underlying raw detail data first, fully independent of any dimensions dragged onto the view and the view aggregation logic.
- Dimension rules: It only identifies hard-coded dimensions defined within the expression, ignoring all row, column and filter dimensions on the view (global filters are exceptions).
- Underlying behavior: It equals adding a new column storing calculation results to the raw data table to generate a temporary wide detail table. Subsequent charts and view aggregations are computed based on this preprocessed table.
- Key feature: Its calculation granularity will not be affected by view dimension breakdowns. The granularity of FIXED calculations stays unchanged no matter which fields are placed on the view.
Example: {FIXED `Customer ID`: SUM(`Sales Amount`)}
It aggregates total sales by customer first and attaches each customer’s total sales to every detail row. If the view later displays data split by "Customer + Month", the customer’s total sales value will not shift with monthly segmentation.
FIXED expressions work independently of view dimensions and finish calculations during the raw detail data loading phase. They group data only by dimensions declared inside the expression, completely ignoring other dimensions placed on view rows and columns, and are only filtered by global filters.
Its calculation logic is equivalent to pre-adding a calculated field to the underlying detail data. All subsequent chart and view aggregations run on the preprocessed dataset.
For detailed information, please refer to Calculated Fields#LOD FIXED.
LOD Expressions
Syntax:
- INCLUDE:
{INCLUDE <Dimensions> : <Aggregate Function>}→ Aggregate by adding extra dimensions to the existing view dimensions - EXCLUDE:
{EXCLUDE <Dimensions> : <Aggregate Function>}→ Aggregate by removing specified dimensions from the existing view dimensions
- Execution timing: Secondary calculation is performed after the view finishes grouping and aggregating data based on base dimensions.
- Dimension rules: These LODs rely on dimensions on the view, adding or removing dimensions on the basis of existing view dimensions.
- Underlying behavior: Raw detail data will not be pre-modified; recalculation is carried out on grouped results of the view.
- Key feature: Output values change dynamically with view dimensions. Dragging in or removing fields from the view will synchronously alter results of INCLUDE / EXCLUDE expressions.
Sample view dimensions: [Region], [Month]
{EXCLUDE `Month`: SUM(`Sales Amount`)}: Remove Month from view dimensions and aggregate sales solely by Region. If the [Month] field is removed from the view, the EXCLUDE logic becomes invalid, and the value reverts to the overall total.
Both are view-dependent LOD expressions, calculated during the view grouping & aggregation phase. They adjust grouping granularity based on existing view dimensions:
- INCLUDE: Append specified dimensions to the original view dimensions before aggregation.
- EXCLUDE: Remove specified dimensions from the original view dimensions before aggregation.
Their calculated values change dynamically as view dimensions are added or removed, and they cannot operate independently without a view.
Graphical Configuration
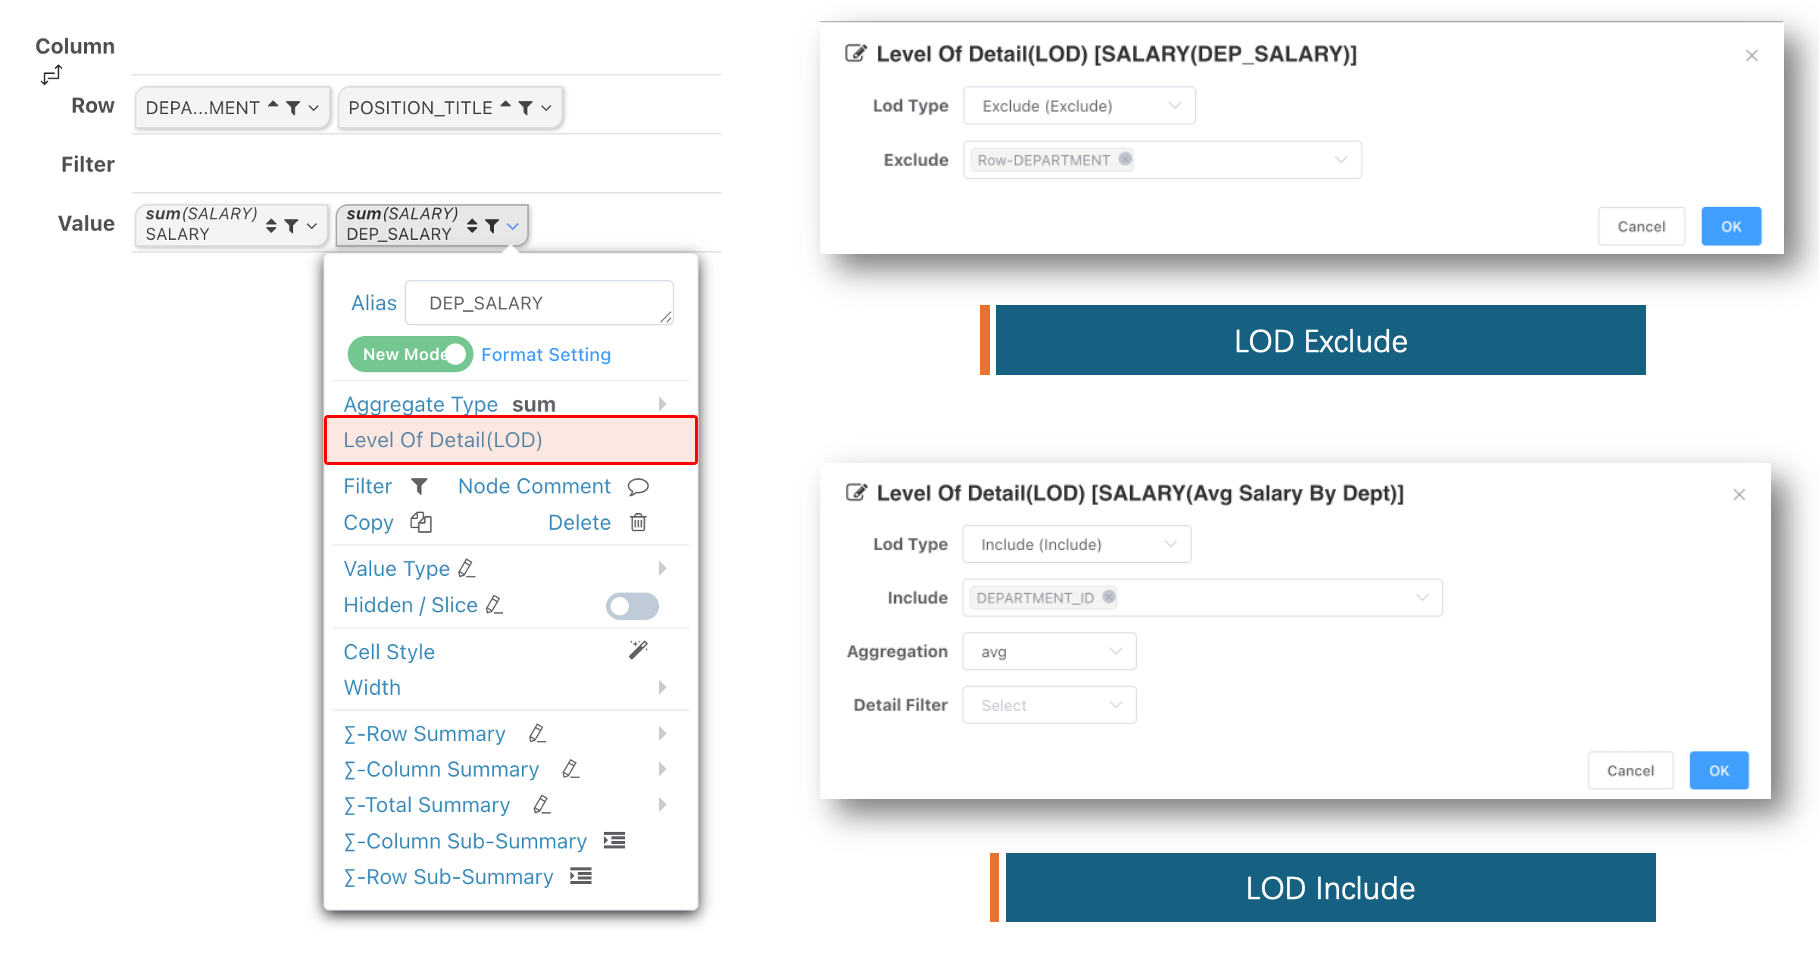
Expression Configuration
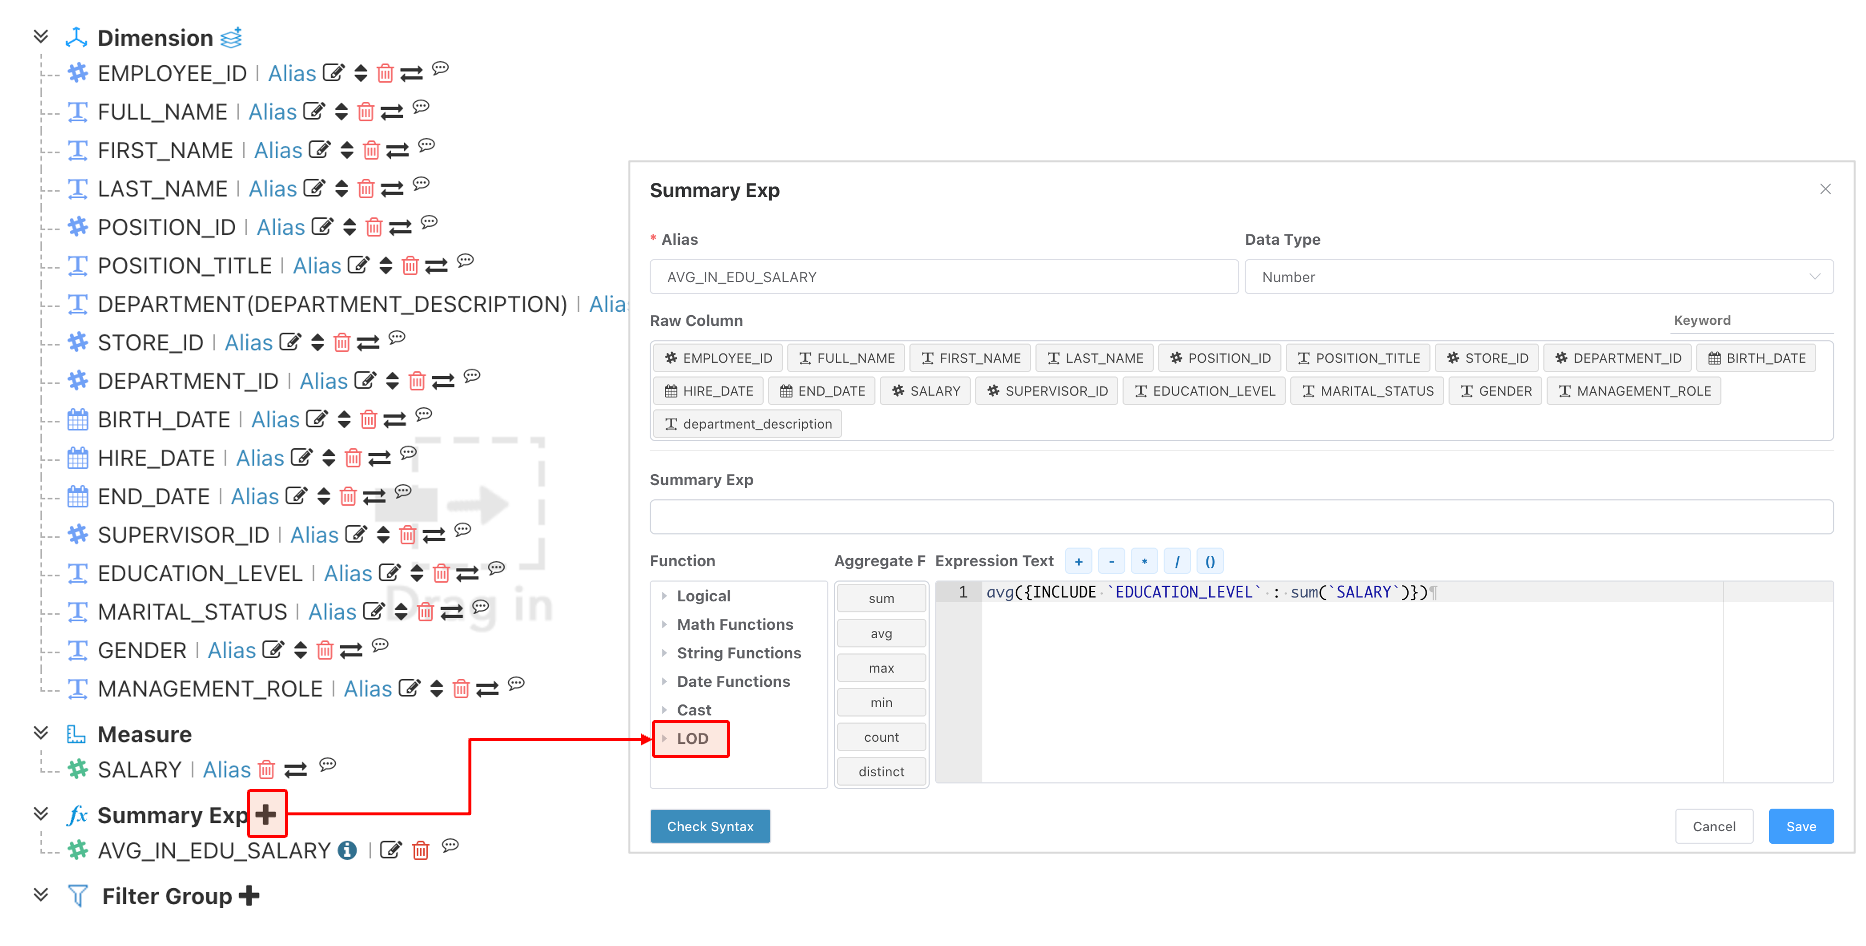
INCLUDE
{ INCLUDE <Dimension Declaration> : <Aggregation Expression> [: <Filter Condition>] }Add dimensions to the existing aggregation granularity. INCLUDE makes the data granularity finer. To merge with the existing view, an additional aggregation at the view granularity is needed after the INCLUDE dimensions.
{ INCLUDE `dim`[, `dim2`] : sum(`col`) [: <Filter Condition>] }avg({INCLUDE `dim` : sum(`col`)})
avg({INCLUDE `dim` : sum(`col`)} : `type` = 1 AND `dt` > '2024-10-01' )
sum({INCLUDE `dim` : sum(`a`)/sum(`b`)})
-- Where `dim` can be an expression, e.g., avg({INCLUDE YEAR(`dt`) : sum(`sales`)})Important
Currently, INCLUDE expressions must be directly wrapper by an aggregation function. Other calculations, judgments, or nested functions cannot be applied to the entire INCLUDE expression, e.g.:
-- Error 1 - Function nesting on INCLUDE expression
sum(IF({INCLUDE `dim` : sum(`col`)} > 1000, `sales`, 0))
-- Correct way:
sum({INCLUDE `dim` : IF(sum(`col`) > 1000, `sales`, 0)})

-- Error 2 - Multiple INCLUDE calculations:
sum({INCLUDE `dim` : sum(`col1`)} + {INCLUDE `dim` : sum(`col2`)})
-- Correct ways:
sum({INCLUDE `dim` : sum(`col1`)}) + sum({INCLUDE `dim` : sum(`col2`)})
sum({INCLUDE `dim` : sum(`col1`) + sum(`col2`)})
Let's explain INCLUDE with a simple example
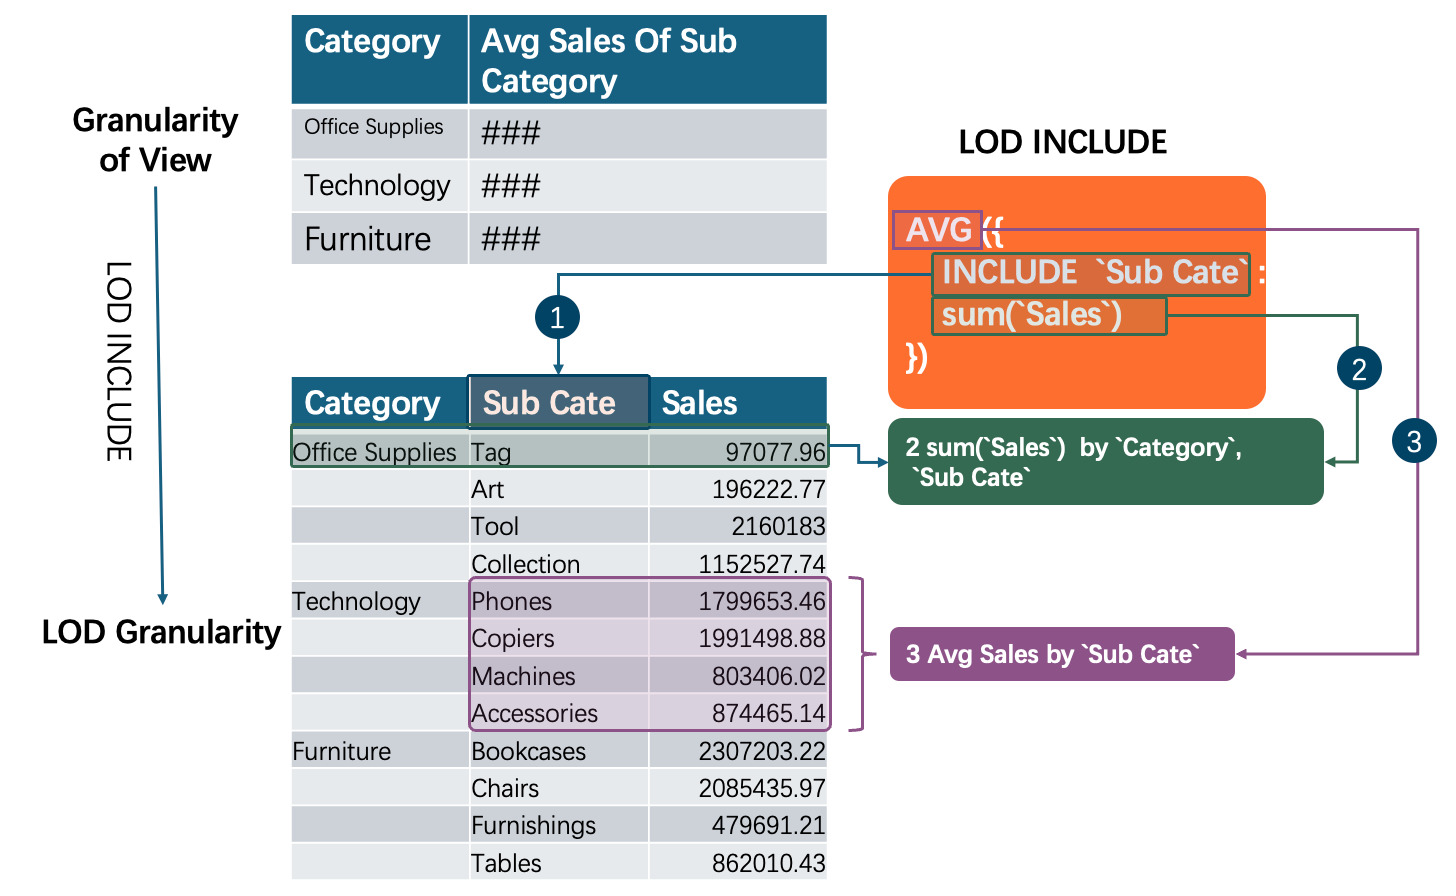
Assume an orders table with product category, subcategory, amount, etc. We need to calculate the average subcategory sales per major category. The final view granularity only has the Category column. The LOD INCLUDE expression would be:
avg({INCLUDE `Subcategory` : sum(`Sales Amount`)})The LOD working process is illustrated as follows:
- Add Subcategory: Adding subcategory makes the granularity finer; one major category contains multiple subcategories.
- LOD Level Aggregation: Perform
sum(Sales Amount)aggregation at the LOD level (Category,Subcategory) to get sales per subcategory. - Average on Expanded Granularity: Calculate the average on the expanded granularity to align with the view granularity.
EXCLUDE
{ EXCLUDE <Dimension Declaration> : <Aggregation Expression> [: <Filter Condition>] }
{ EXCLUDE `dim`[, `dim2`] : sum(`col`) [: <Filter Condition>] }
EXCLUDE works opposite to INCLUDE regarding granularity change. It excludes dimensions from the existing aggregation granularity. Since excluding dimensions makes the granularity coarser, multiple rows become one row, so no external aggregation is needed to match the original view.
{ EXCLUDE `dim` : sum(`col`) }
{ EXCLUDE `dim` : sum(`col`) : `type` = 1 AND `dt` > '2024-10-01' }
{ EXCLUDE `dim` : sum(`a`)/sum(`b`) }
EXCLUDE Judgment Rules
- In LOD expressions: By default, compares and removes dimensions based on field names.
- If a field in the view has a derived dimension, e.g.,
monthderived into quarterQuarter,EXCLUDE monthwill not remove themonthdimension. Instead, use the alias after the derived dimension for exclusion. EXCLUDE YEAR(dt)cannot exclude any dimension.- If using graphical configuration and selecting dimensions precisely via dropdown for exclusion, you don't need to consider whether the dimension is derived.
Typical Use Cases
INCLUDE Typical Cases
Average Customer Sales
When an orders table has multiple orders per customer, or even multiple items per order, and we want to calculate the average sales per customer.
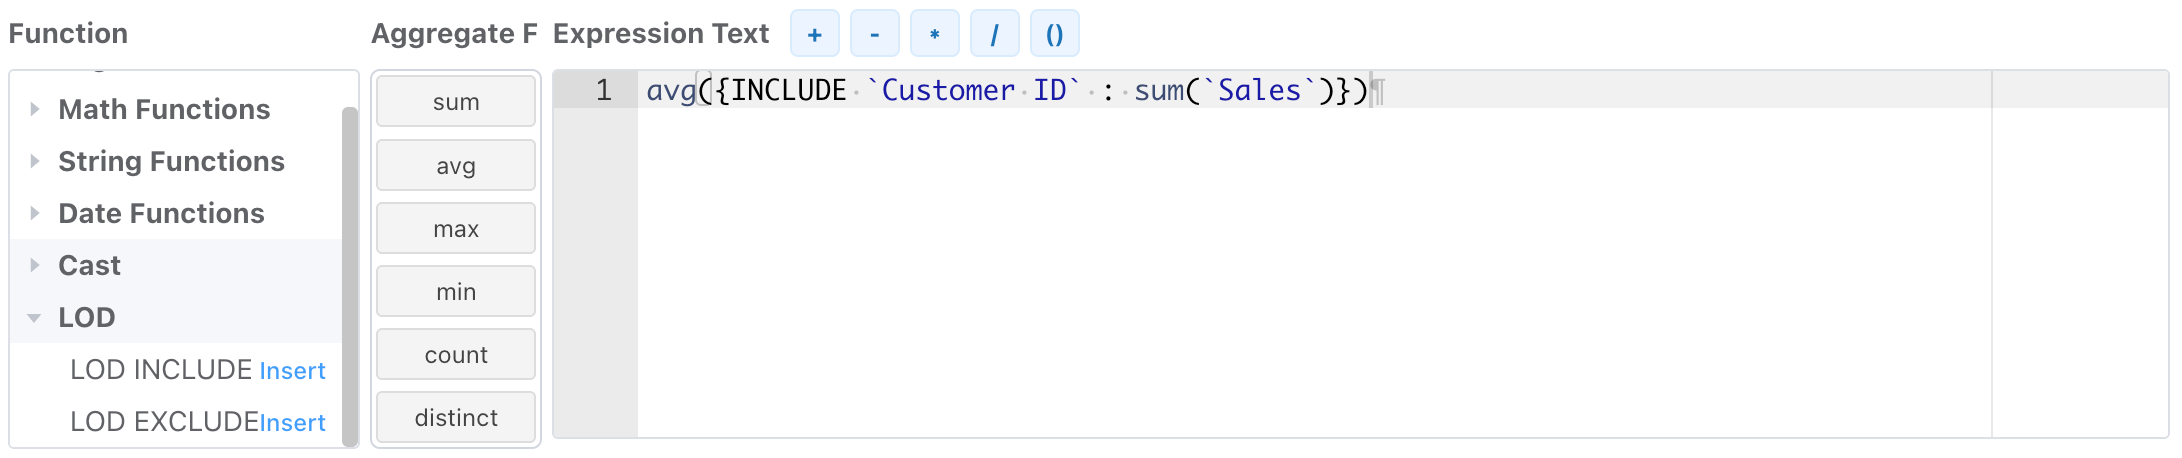
avg({INCLUDE `Customer ID` : sum(`Sales`)})Meaning: Calculate each customer's total order amount by Customer ID, then find the average. The detail level uses sum aggregation, and the outer layer uses avg aggregation.
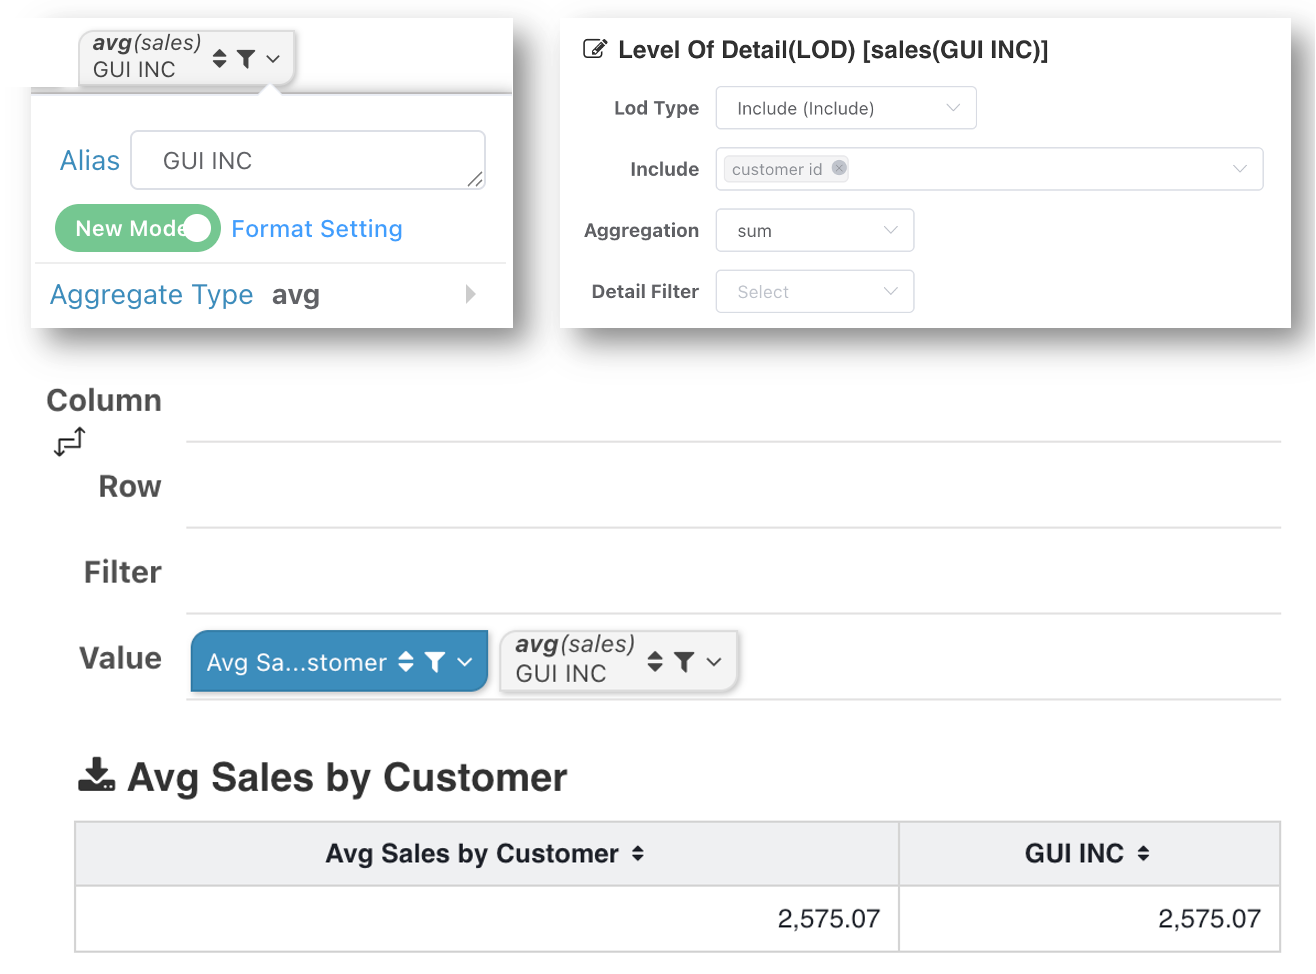
Users accustomed to graphical configuration can also achieve the same effect by dragging the Sales Amount field and configuring Level of Detail (LOD) via dropdown.
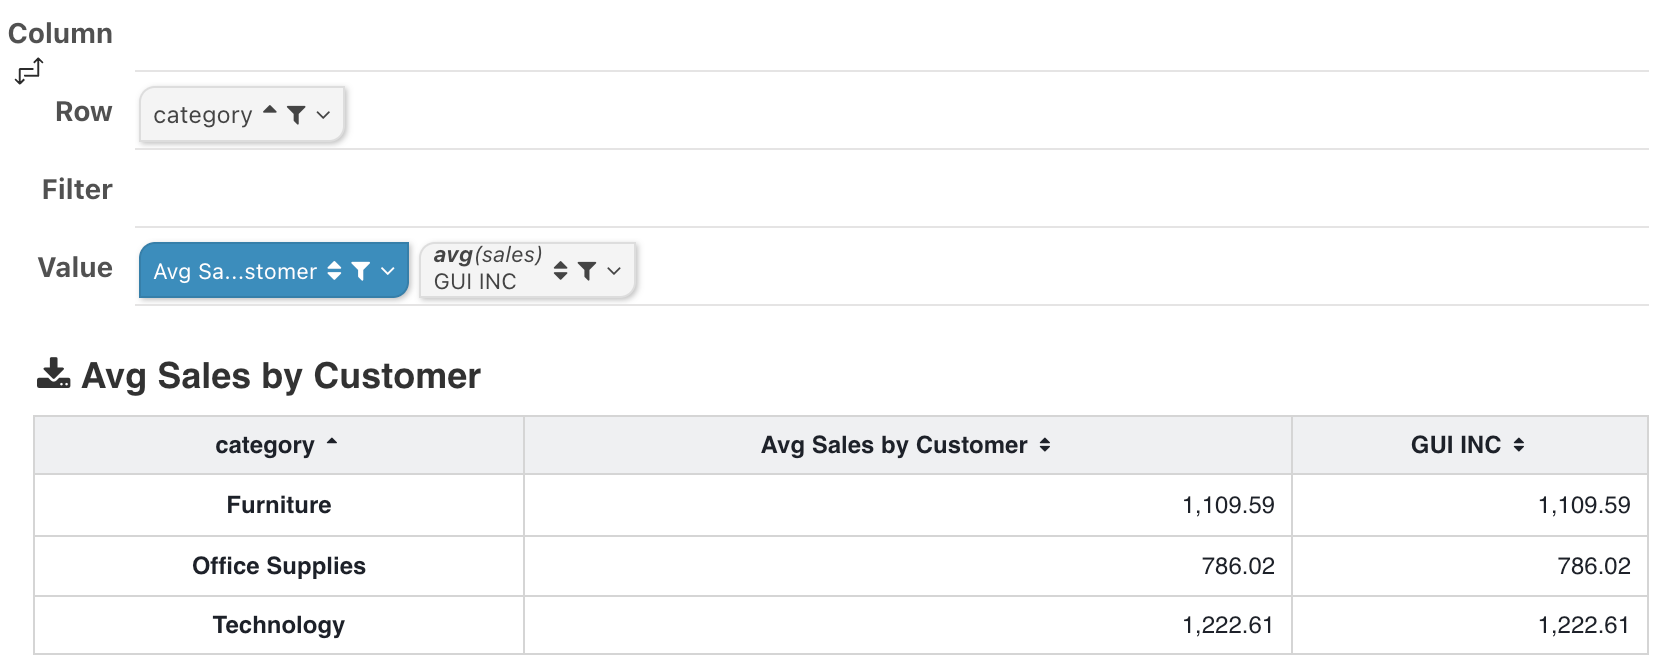
We can further break it down by different product categories, and the above average formula still works.
Total Profit for Regions with Order Amount > 2 Million
Calculate total profit for regions where the order amount exceeds 1 million.
sum({INCLUDE `region` :
  IF(sum(`sales`) > 1000000, sum(`profit`), 0)
  })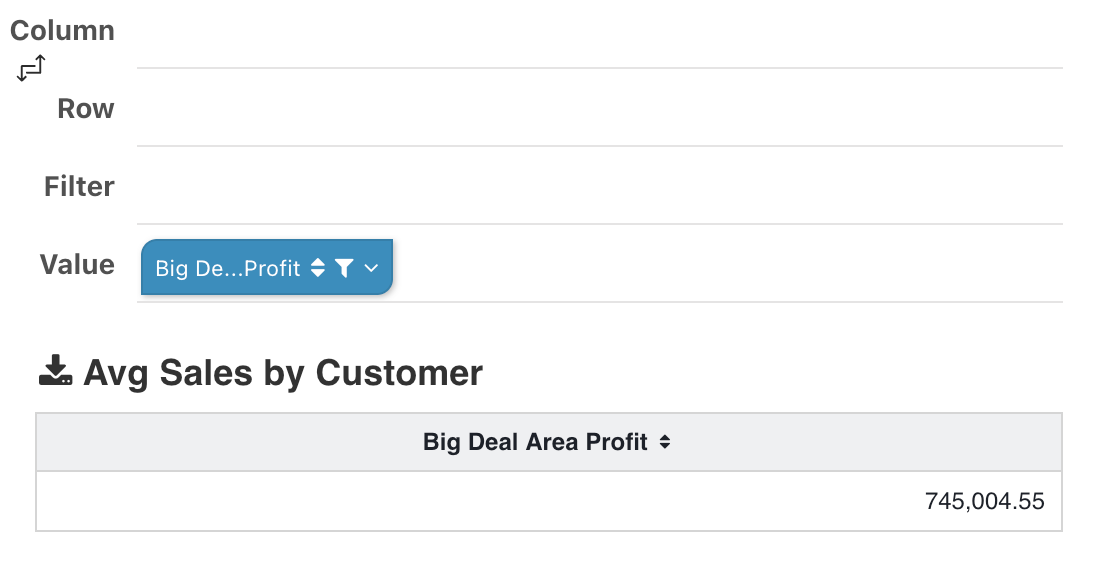
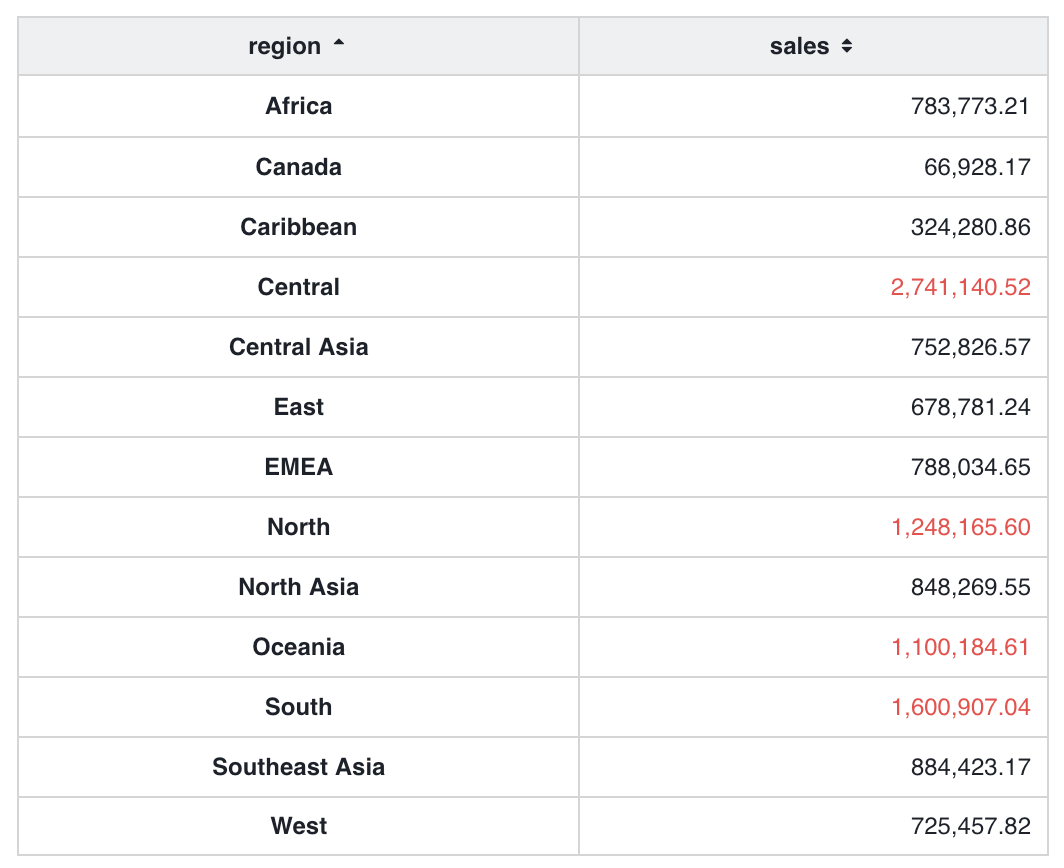
Expand by region to verify data. As shown below, regions marked in red have sales > 1,000,000, and corresponding profits have values. Regions below 1,000,000 have no profit calculated. The column total matches the value above.
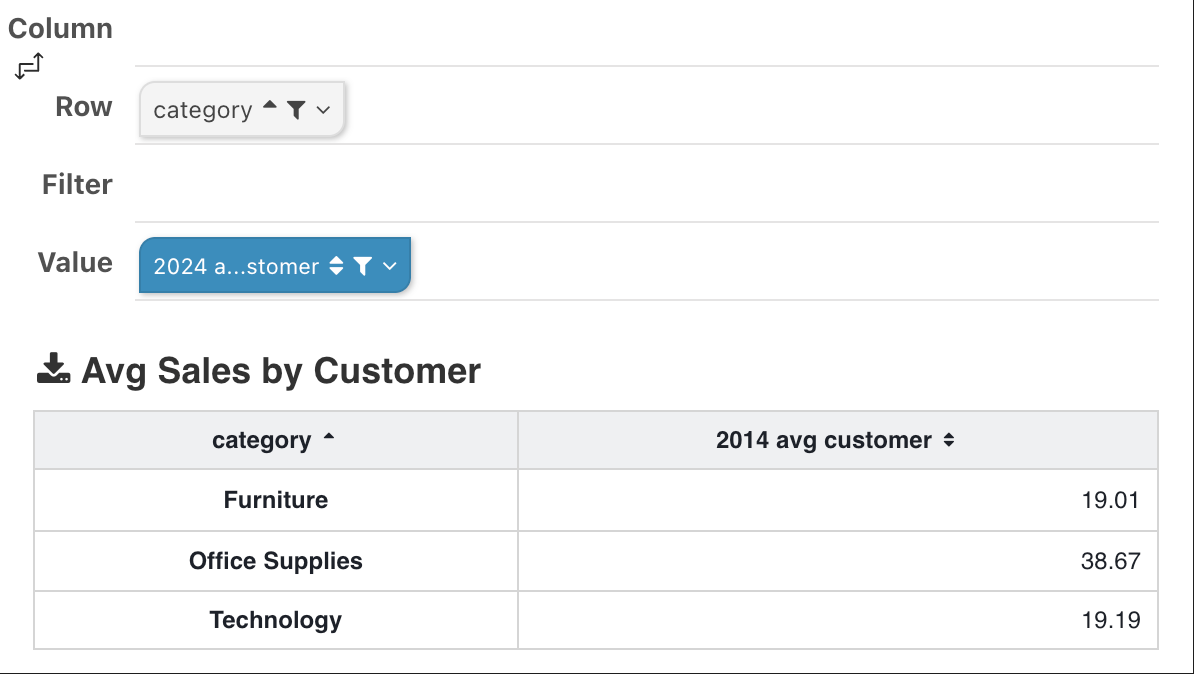
Average Number of Customers per country by Product Type for 2024
avg({INCLUDE `country` :
  count(distinct
   if(YEAR(`order date`) = 2014, `customer id`, null)
   )
})
EXCLUDE Typical Cases
EXCLUDE level of detail expressions remove the specified dimensions from the calculation.
Sales Proportion of Each Province within a Region
Scenario Description
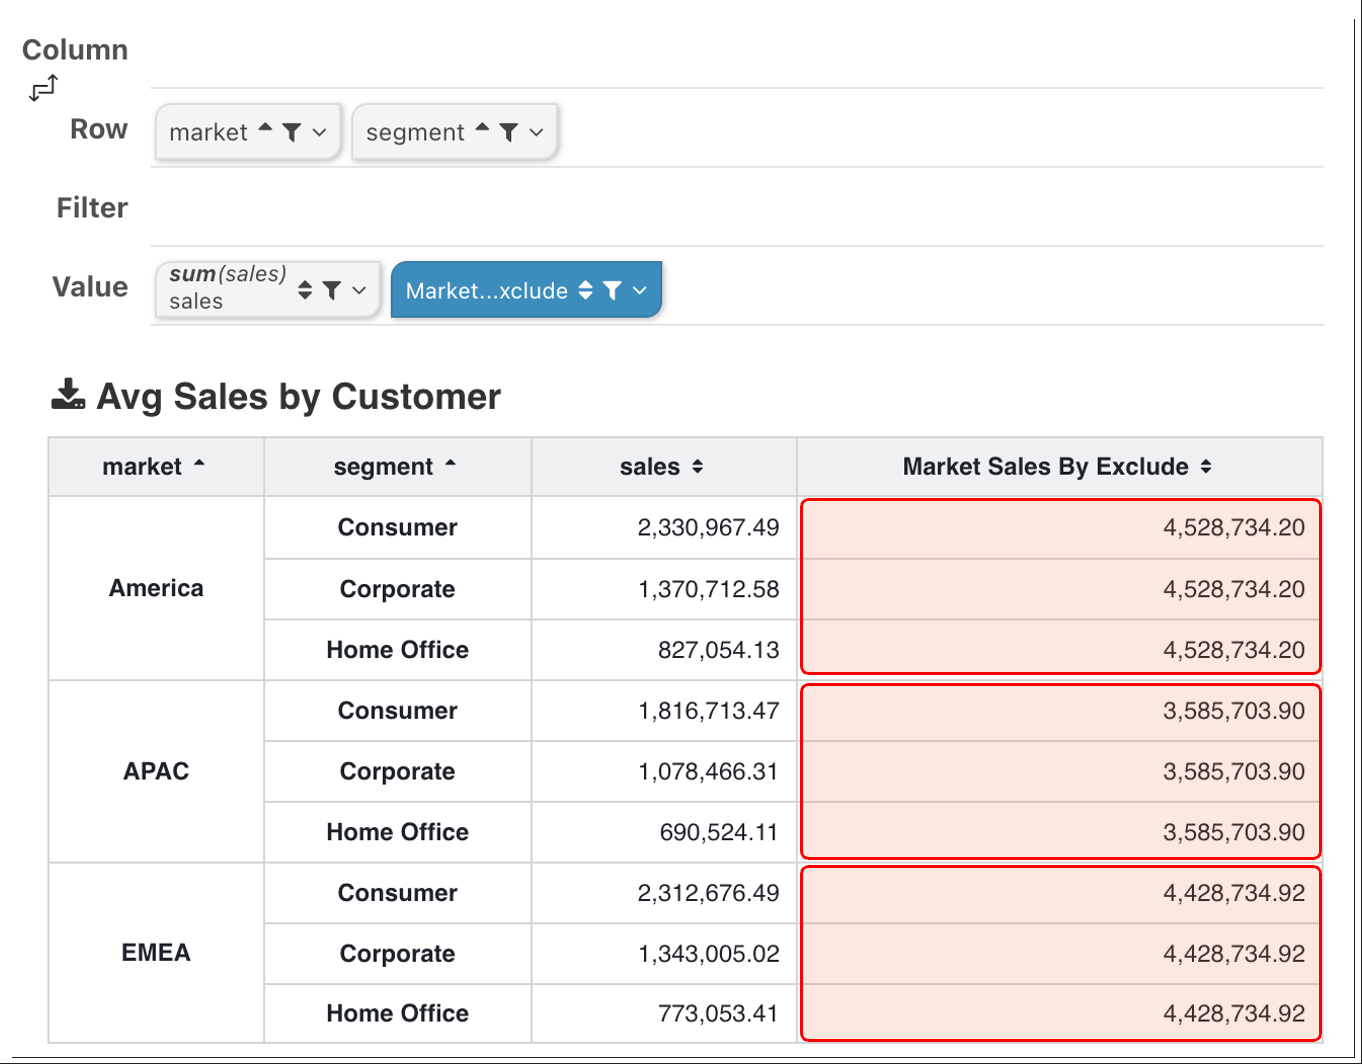
When analyzing sales data of each province within a region, and also needing to view the region's total sales data and each province's sales proportion relative to the region, you can use the EXCLUDE function to first calculate the region's sales excluding the current province, then sum it up to get the region's total.
Field Expression:
{EXCLUDE `segment` : sum(`sales`)}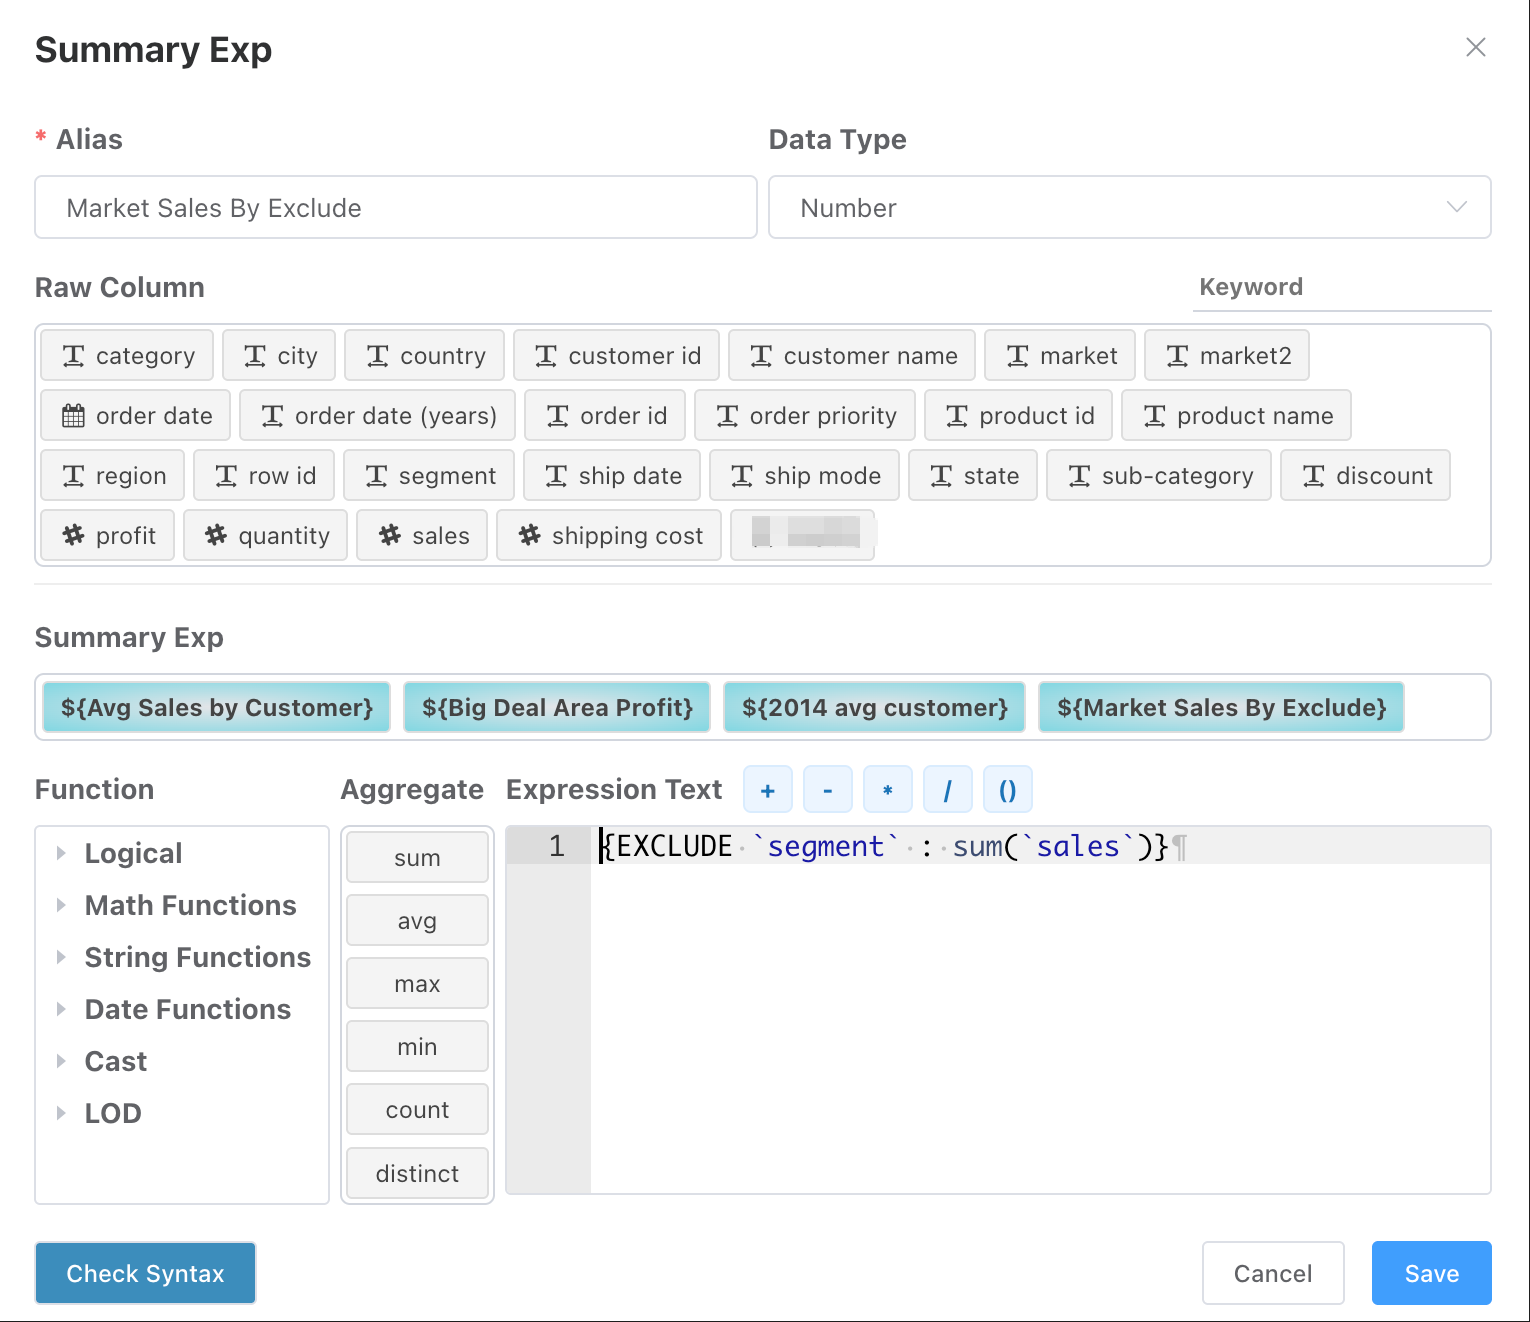
Meaning: Calculate the region's sales amount excluding the current province.
Year-over-Year and Month-over-Month Calculations
From the definition of EXCLUDE, we know that if the dimension definition in EXCLUDE is a function, it will not exclude any dimension. Using this characteristic, define EXCLUDE expressions to calculate the same period last year value, as follows:
Year-over-Year (YoY)
Define aggregation expressions:
-- Same period last year value
{EXCLUDE addYear(`r_date`, -1) : sum(`store_sales`)}

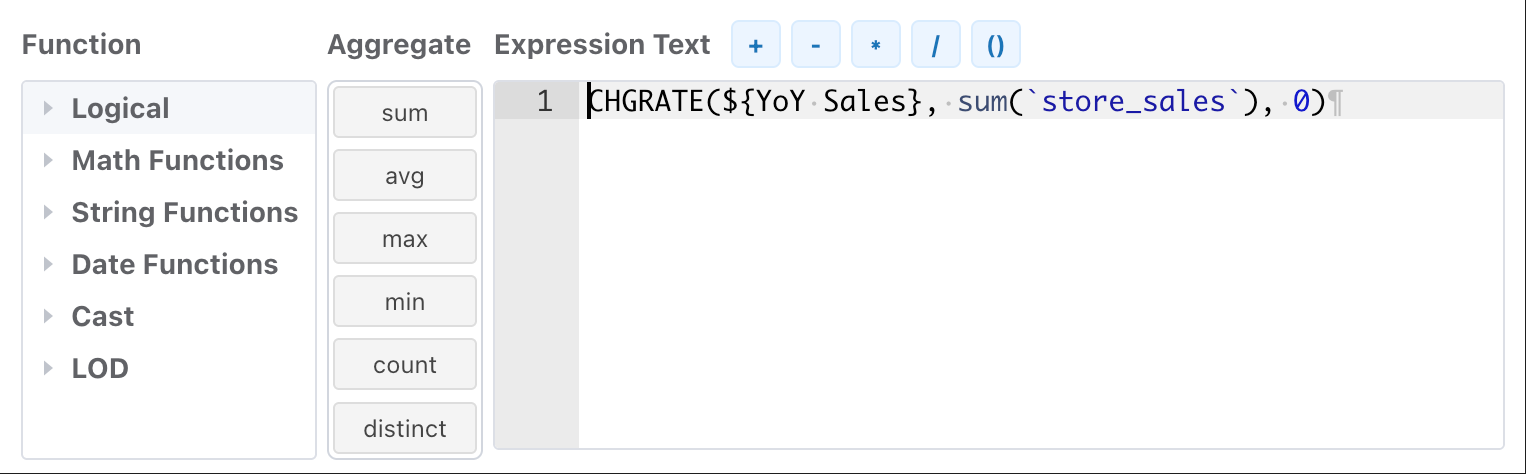
-- Year-over-Year growth rate
CHGRATE(${YoY Sales}, sum(`store_sales`), 0)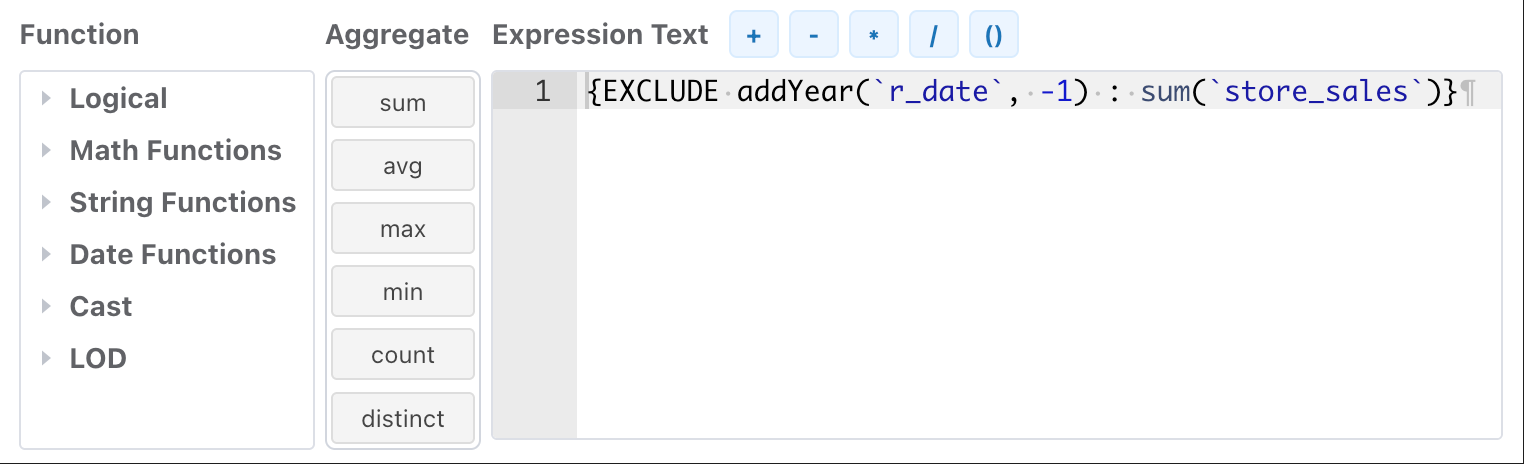
Explanation
- When the view contains (and must contain) the dimension corresponding to the field
r_date, the same period value will be calculated based on this field. r_datecan be set to any data granularity, e.g., yyyy-MM, yyyy-Q, yyyy-MM-dd, yyyy-WW.- Same period values based on LOD can be used at any data granularity. You can also add any dimensions and date combinations for analysis.
- Difference from measure field type YoY/MoM: Same period value calculation based on LOD runs at the database level, incurring additional database overhead.
- The surface does not need last year's data. That is, you can filter
r_dateto only show 2023 data. As long as the database contains 2022 data, the same period value for the first year can still be correctly calculated.
Month-over-Month (MoM)
-- Previous month value (date shifted back one month for month-over-month)
{EXCLUDE addMonth(`r_date`, -1) : sum(`store_sales`)}
-- Previous week value (date shifted back one week for week-over-week)
{EXCLUDE addWeek(`r_date`, -1) : sum(`store_sales`)}

-- Month-over-Month growth rate
CHGRATE(${Previous Month Value}, sum(`store_sales`), 0)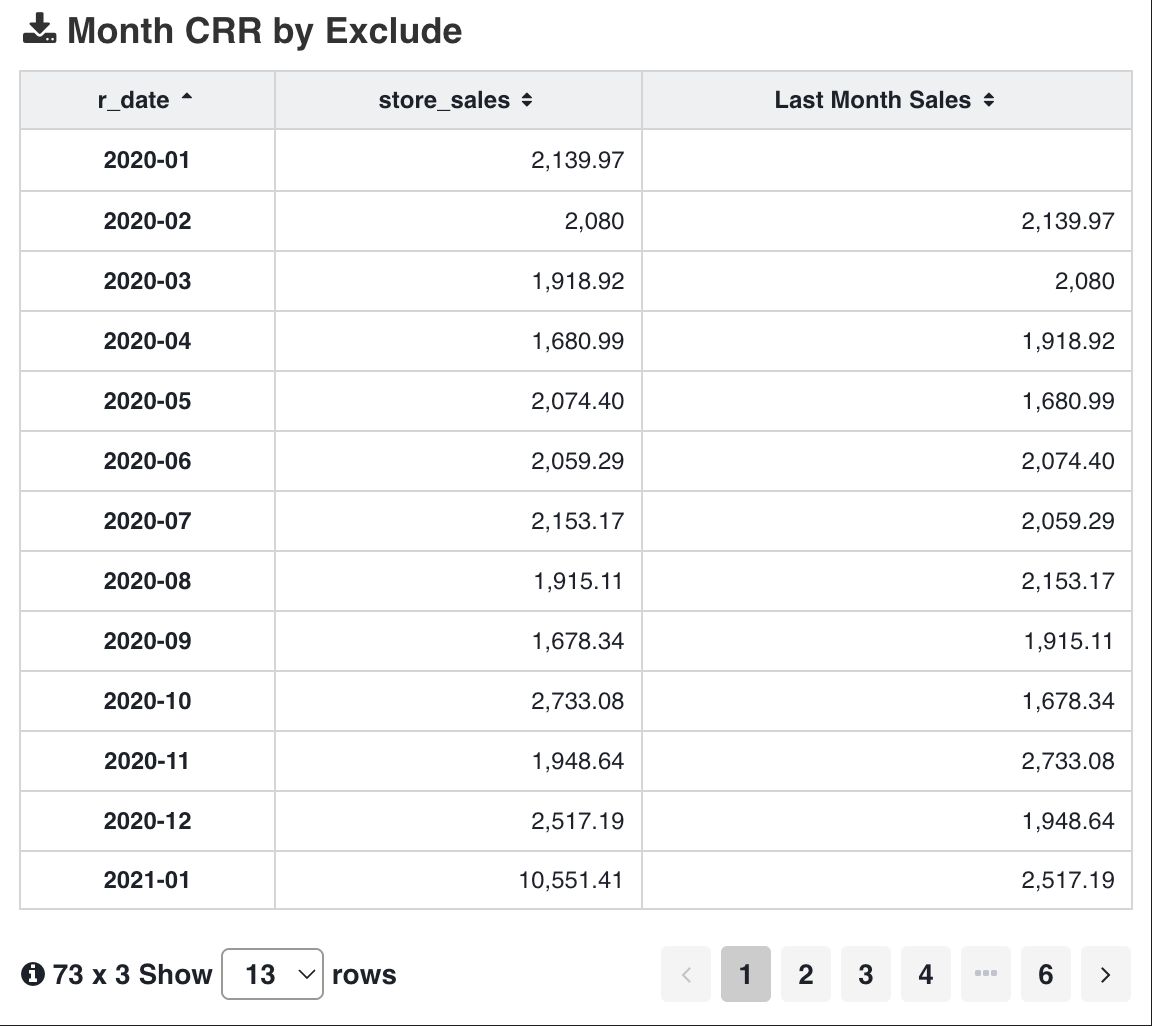
Financial Gross Margin Calculation
One of the simplest yet essential metrics in both finance and business analysis is Gross Margin:
Gross Margin GP% = Gross Profit / Revenue = (Revenue - Cost) / Revenue
| Account | Version | Amount |
|---|---|---|
| Revenue | Actual | 100 |
| Cost | Actual | 80 |
| Revenue | Forecast | 110 |
| Cost | Forecast | 90 |
In PowerBI, you would do the following 3 steps:
Revenue = CALCULATE ( sum([Amount]), FILTER('Account Table',[Account]="Revenue"))
Cost = CALCULATE ( sum([Amount]), FILTER('Account Table',[Account]="Cost"))
Gross Margin = DIVIDE ( ([Revenue] - [Cost]) , [Revenue])
In our BI, the approach is similar; create 3 aggregation expressions:
Revenue = sum(IF(`Account`='Revenue', `Amount`, 0))
Cost = sum(IF(`Account`='Cost', `Amount`, 0))
Gross Margin = DIVIDE(${Revenue}-${Cost}, ${Revenue})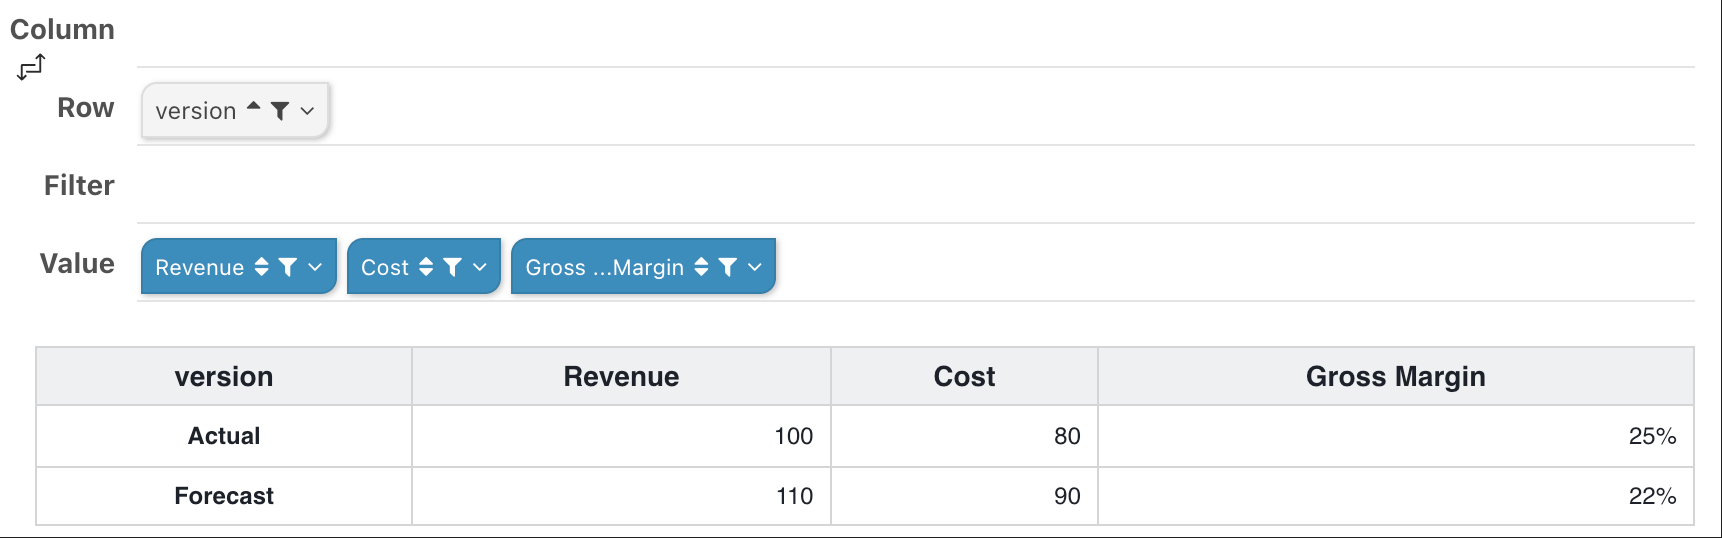
If the leader says, "I want to compare the actual gross margin for 2024 with the budgeted gross margin for 2024." In PowerBI, you'd just write 3 more measures:
Gross Margin_24 Actual =
  CALCULATE ([Gross Margin], FILTER('Fact Table',[Version]="24 Actual"))
Gross Margin_24 Budget =
  CALCULATE ([Gross Margin], FILTER('Fact Table',[Version]="24 Budget"))
Gross Margin_Variance = [Gross Margin_24 Actual] - [Gross Margin_24 Budget]
Without Using Level of Detail Expressions
[Gross Margin_24 Actual] = (
  sum (IF([Account]="Revenue" AND [Version]="24 Actual" ,[Amount] ,0) -
  sum (IF([Account]="Cost" AND [Version]="24 Actual" ,[Amount] ,0)
) /
sum (IF([Account]="Revenue" AND [Version]="24 Actual" ,[Amount] ,0)

[Gross Margin_24 Forecast] = (
  sum (IF([Account]="Revenue" AND [Version]="24 Forecast" ,[Amount] ,0) -
  sum (IF([Account]="Cost" AND [Version]="24 Forecast" ,[Amount] ,0)
) /
sum (IF([Account]="Revenue" AND [Version]="24 Forecast" ,[Amount] ,0)

[Variance] = [Gross Margin_24 Actual] - [Gross Margin_24 Forecast]
Consideration
Although the variance is calculated above, the gross margin formula is repeatedly defined. PowerBI's approach filters the table first, then reuses the gross margin calculation formula. The gross margin calculation logic is centrally maintained in the [Gross Margin] expression. If the gross margin calculation method changes, only the [Gross Margin] expression needs modification. However, the alternative approach requires modifying three formulas:
- [Gross Margin]
- [Gross Margin_24 Actual]
- [Gross Margin_24 Forecast] Clearly, PowerBI's logic is superior.
Using Level of Detail Expressions
How to do it with Level of Detail expressions? We already defined the gross margin calculation formula above. How to reuse the formula instead of creating new gross margin formulas for different versions?
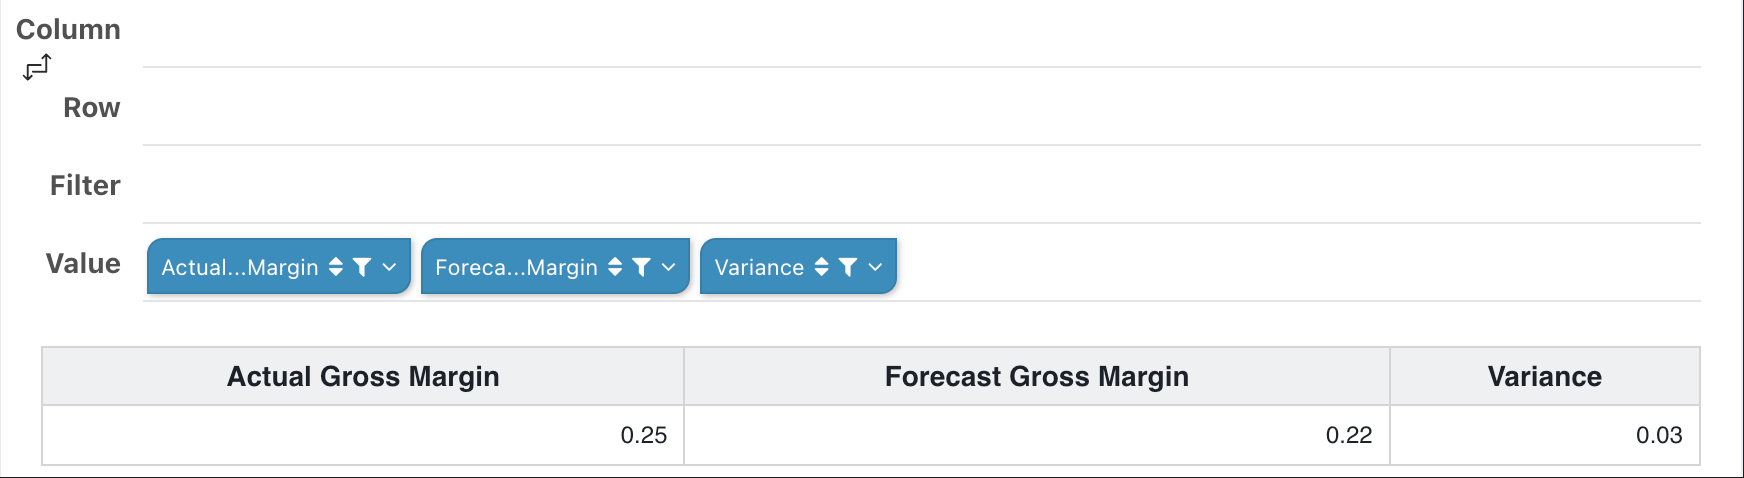
Actual Gross Margin = {EXCLUDE : ${Gross Margin} : `Version` = 'Actual'}
Forecast Gross Margin = {EXCLUDE : ${Gross Margin} : `Version` = 'Forecast'}
Variance = ${Actual Gross Margin} - ${Forecast Gross Margin}
Explanation
In the gross margin expression above, using EXCLUDE level of detail adjusts the gross margin calculation formula, not by excluding dimensions, but by adding table filter conditions Version = 'xxx'.