Database Dataset
Database Dataset
Query Statement
The query statement defines the dataset object. When caching is not used, the results of the dataset query statement are not loaded onto the BI server. Instead, they are dynamically aggregated via subqueries in a summarized form and then loaded onto the BI server.
Using Cache
When the "Use Cache" configuration is enabled, the dataset query statement will be fully loaded (default maximum cache data size is 300k rows) into the BI server's cache within the built-in embedded database upon the first analysis query. Subsequent analyses will be based on this cached data.
For more detailed information, please refer to Performance Optimization
Variables in Query
Query SQL supports the use of environment variables, which can come from dashboard parameters, chart linkage events within the dashboard, built-in variables, etc., for example:
SELECT
      -- .... Other query script omitted ...
  JOIN foodmart.region r ON c.REGION_ID = r.REGION_ID
  JOIN foodmart.customer d ON a.CUSTOMER_ID = d.CUSTOMER_ID
WHERE r.sales_country = '${country!"USA"}'
select
-- ....
from
where date_column between
'${arr.get(dt, 0) ! cdt.addDay(-10,"yyyy-MM-dd")}'
and '${arr.get(dt, 1) ! cdt.addDay(-1,"yyyy-MM-dd")}'For variable usage, please refer to the Using Variables chapter
CTAS(WITH) Subqueries
For JDBC data sources that support WITH subqueries, when defining a dataset query, if the query contains a WITH subquery and runs with exception, you can wrap the subquery with double arrow brackets <<>>.
<<
  WITH log AS (
  SELECT
    extract(year from LOG_TIME) year,
    extract(month from LOG_TIME) month,
    extract(day from LOG_TIME) day,
    to_char(LOG_TIME, 'YYYY-MM-DD') datestr,
    DATASET_NAME, USER_NAME, WIDGET_NAME,
    1 cnt
  FROM LOG_DATA_ACCESS where LOG_TIME > to_date('2019-01-18', 'yyyy-mm-dd')
)
>>
 SELECT * FROM log
Graphical Modeling
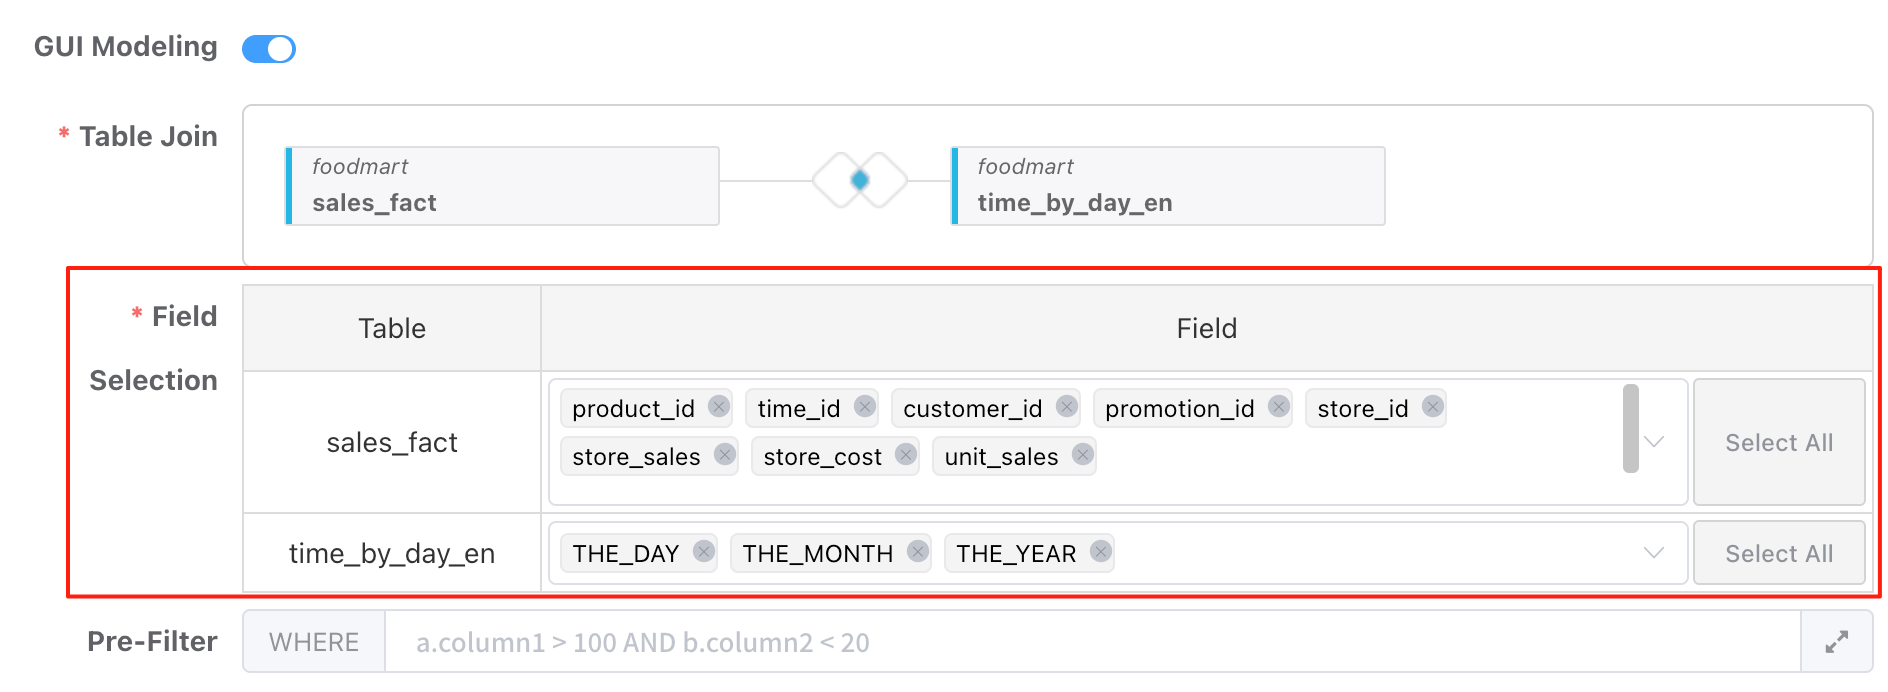
Graphical modeling is an alternative to SQL datasets. By graphically selecting tables, configuring table associations, and selecting fields, you can easily build datasets equivalent to SQL (the principle is automatically generating SQL scripts based on the graphical configuration). Turn on the graphical modeling switch to switch from SQL dataset mode to the graphical interface:
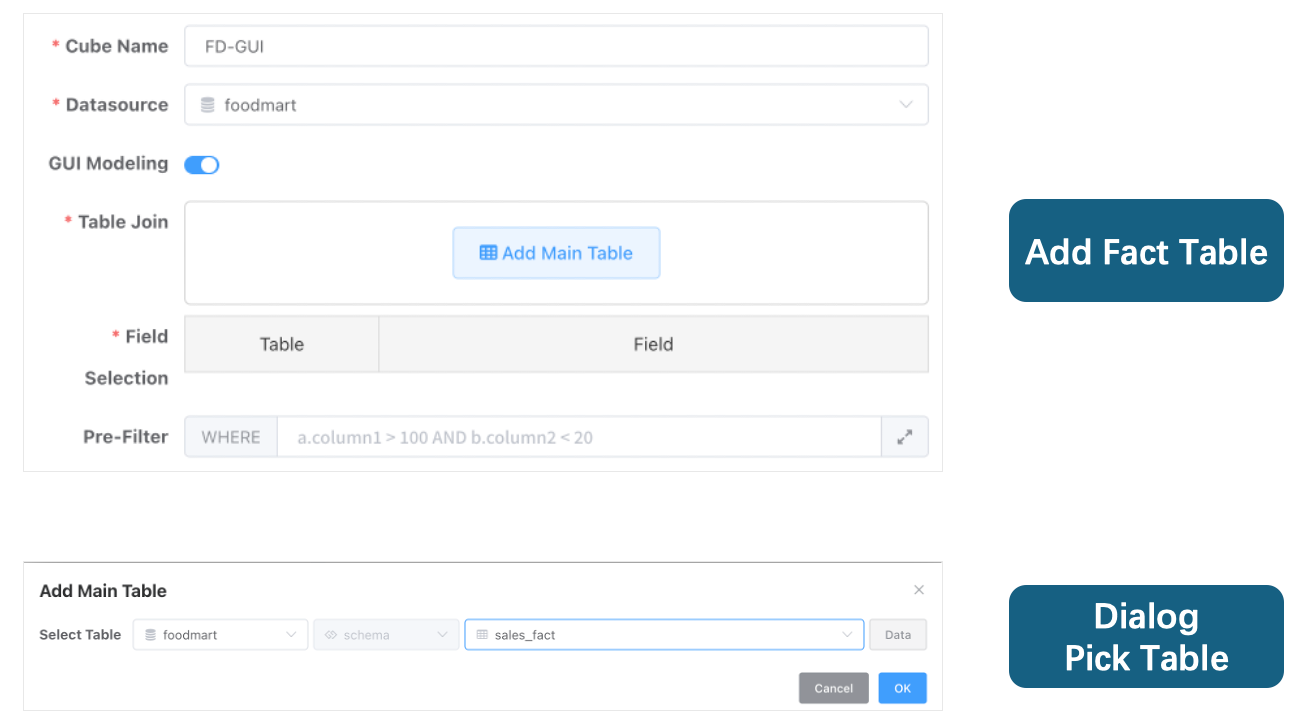
Add Main Table
Click the "Add Main Table" button and select the main table from the popup.
Add Join Table
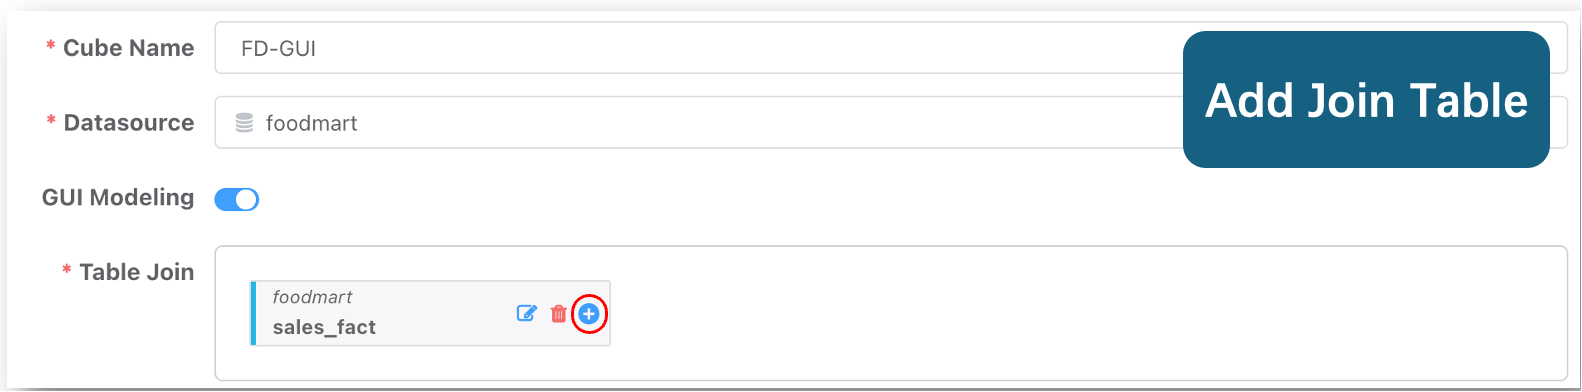
Move the mouse over the main table to display operation buttons. Click the add button to add an associated sub-table.
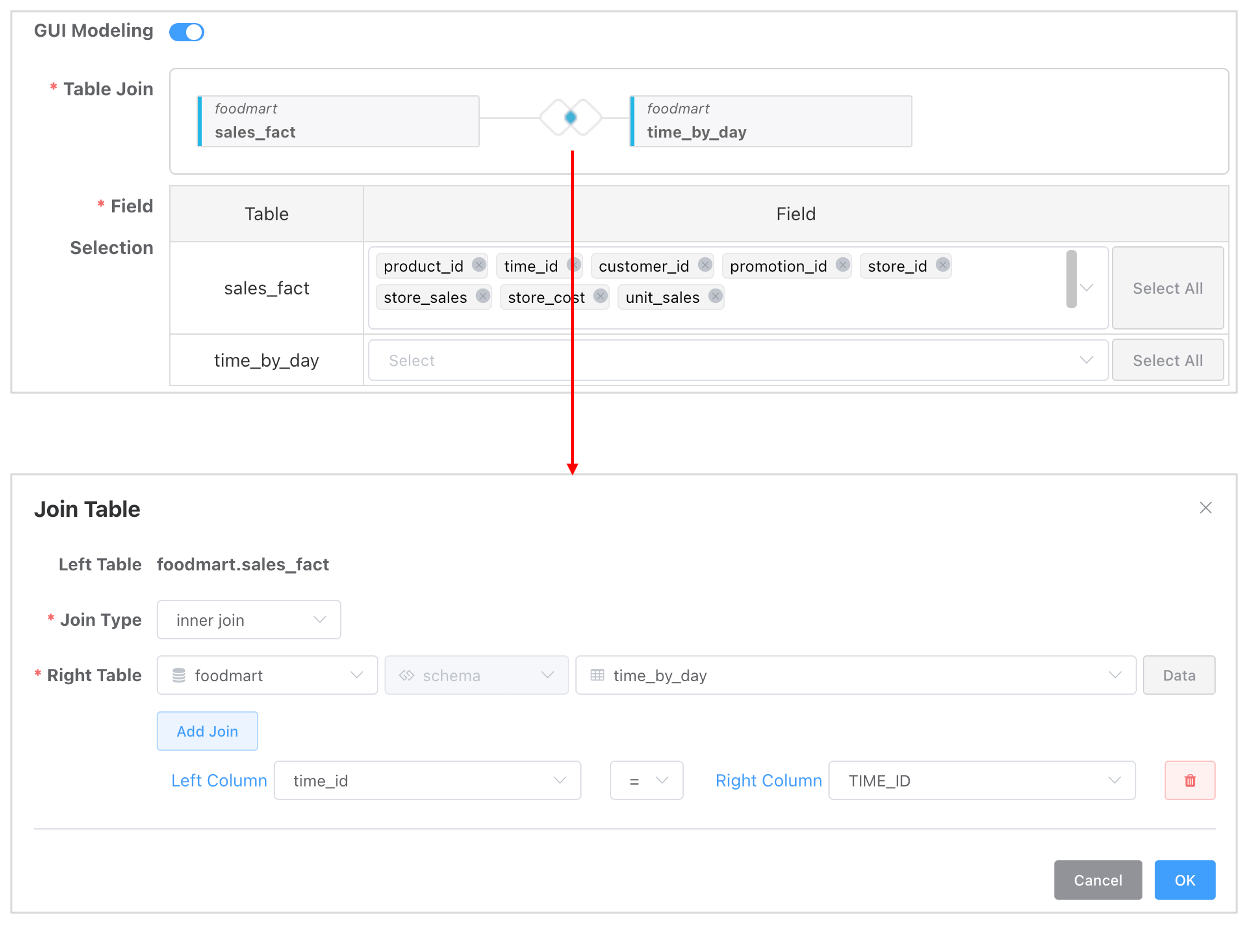
Set the join Type.
Select Table Fields
Select the table fields you need to query.