
Chart Components
Chart Components
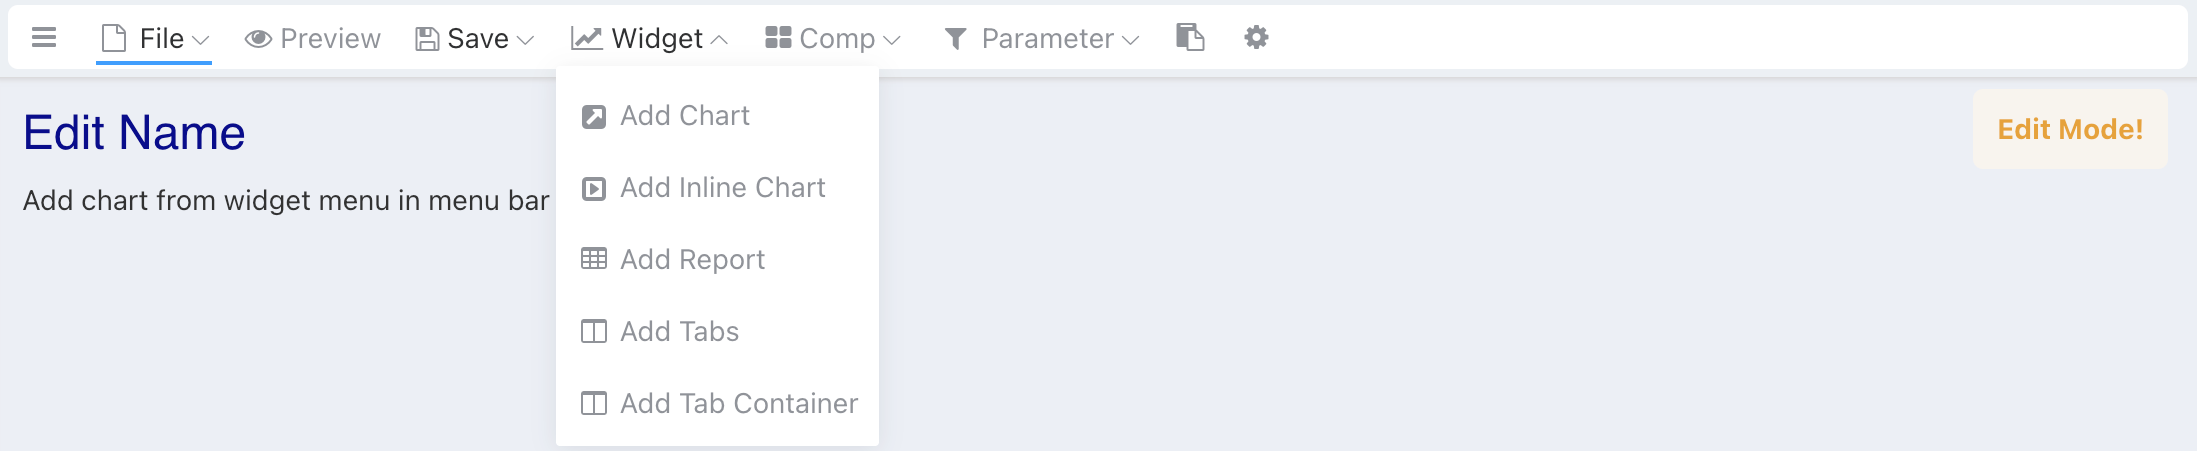
In edit mode, activate the Chart related dropdown menu, with the following options available to add:
- Saved Charts: Charts saved from self-service analysis, also known as referenced charts.
- Inline Charts: Chart configurations are not saved separately but are stored within the dashboard data.
- Complex Reports: Chinese-style reports.
- Tab Pages: One chart per tab page.
- Tab Container: One tab page is equivalent to a dashboard.
Referenced Charts
In the menu bar: Widget -> Add Chart. A list of saved charts pops up. Double-click a chart node to add it to the dashboard. Then, users can adjust the component's size and position according to their needs.
Refer Chart Style Sync
Why don't changes to the referenced chart style take effect on the dashboard?
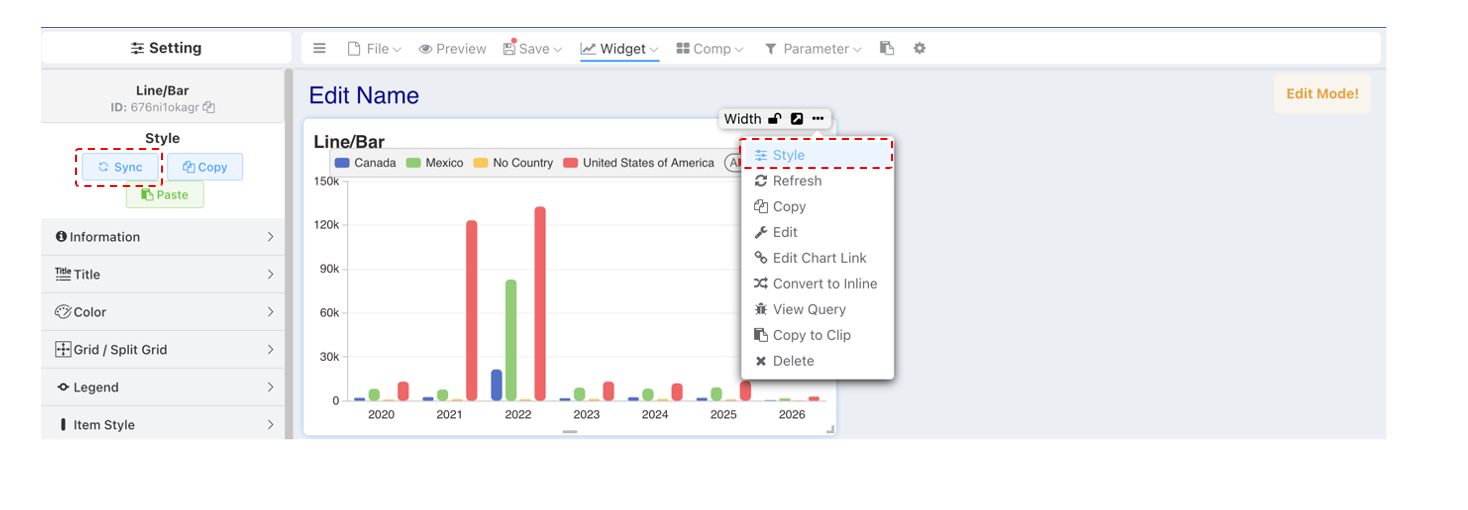
When a referenced chart is added to a dashboard, the system copies and applies the style configuration of that chart at the moment of addition. This approach allows the same referenced chart to have independent and diverse configuration settings across different dashboards. If the master chart is updated, directly synchronizing these changes would cause the loss of personalized adjustments made to that referenced chart on each dashboard.
However, you can manually synchronize the style configuration of referenced charts. This allows you to selectively apply new styles or feature updates while preserving personalization.
Inline Charts
Issues with Referenced Charts
- From our production usage and user feedback, we found that as dashboards increase, the volume of chart data shows a sharp growth trend.
- Initially, to allow charts to be referenced in multiple dashboards, chart design was deliberately maintained as an independent module. However, such scenarios are actually very rare.
- Alternatively, when users only need to send a dashboard containing a single chart, they have to separately design and save the chart first. After the dashboard is discarded or deleted, they also need to manually delete the corresponding chart in the chart management module.
- Additionally, because dashboard and chart permissions are managed independently; when topic module maintenance is not clear, it often happens that after a dashboard is authorized, the chart permissions on the dashboard are not granted.
To solve the various inconveniences in dashboard design and chart management mentioned above, we introduced Inline Charts, during the free layout development and transformation. Chart definition data is directly saved in the dashboard metadata and not saved separately. All data is deleted when the dashboard is deleted.
- After introducing inline charts, the original referenced chart addition method can still be used normally.
- The design process for inline charts is the same as the experience for independently maintained charts.
- Editing and modifying inline chart definitions take effect on the dashboard in real-time.
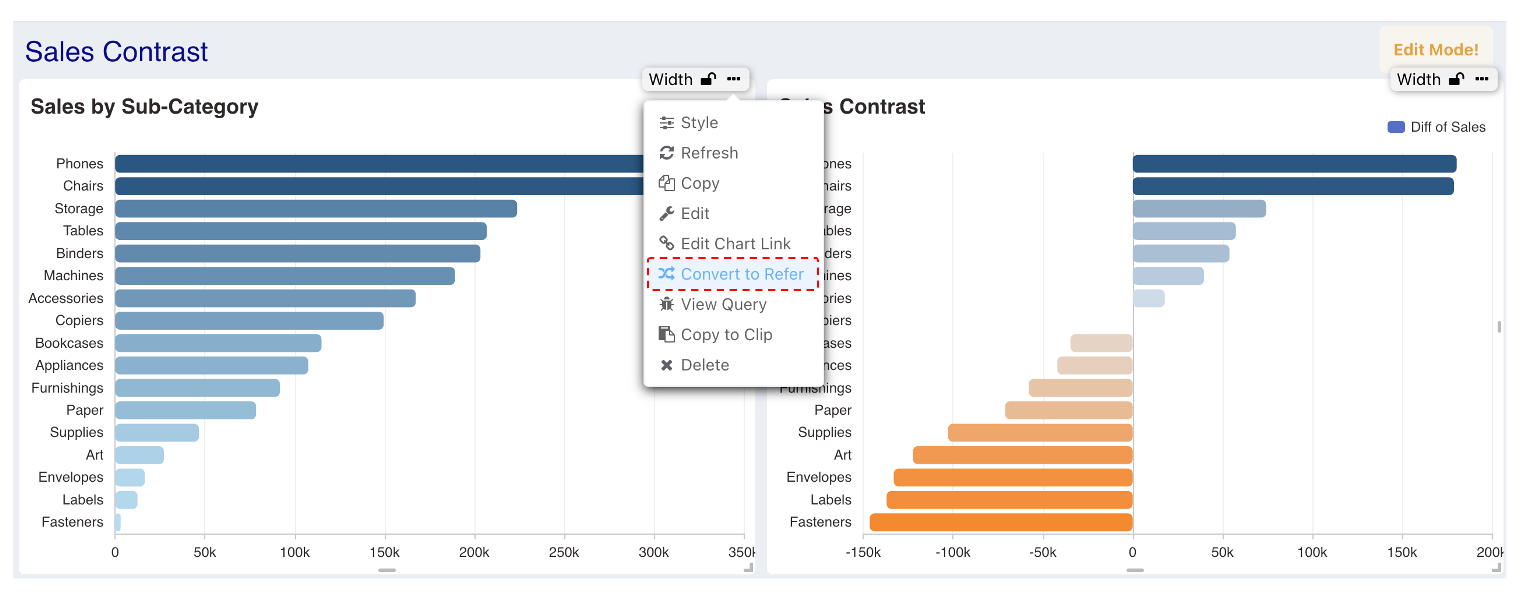
Convert Refer and Inline
In dashboards, conversion between referenced and inline charts is supported. This means you can flexibly transform a referenced chart into an inline chart or vice versa as needed.
Tab Pages
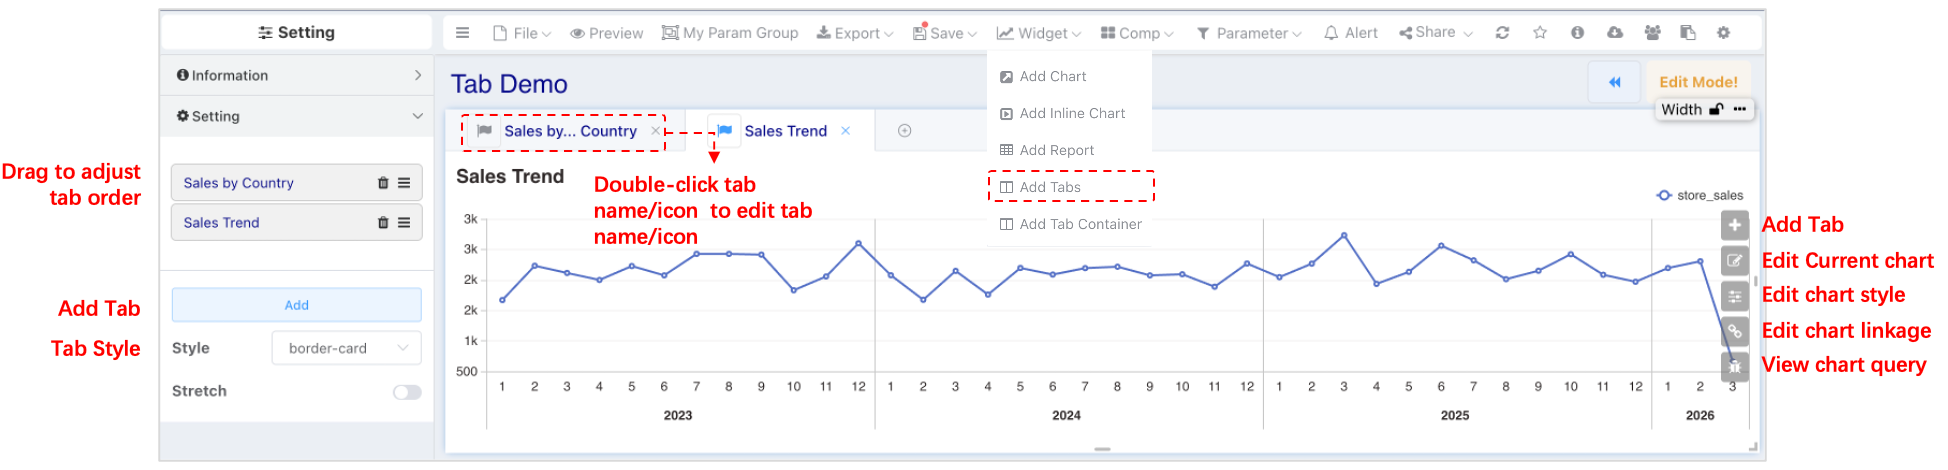
A tab page configures one chart per tab. The menu in the upper right corner of the tab page component is used to adjust the tab's own configuration. The configuration for charts located within the tab is on the right side inside the tab.
Tab Container
Each tab page within a tab container can hold multiple charts and supports the same user experience as the grid layout, flexibly meeting multi-scenario display needs.
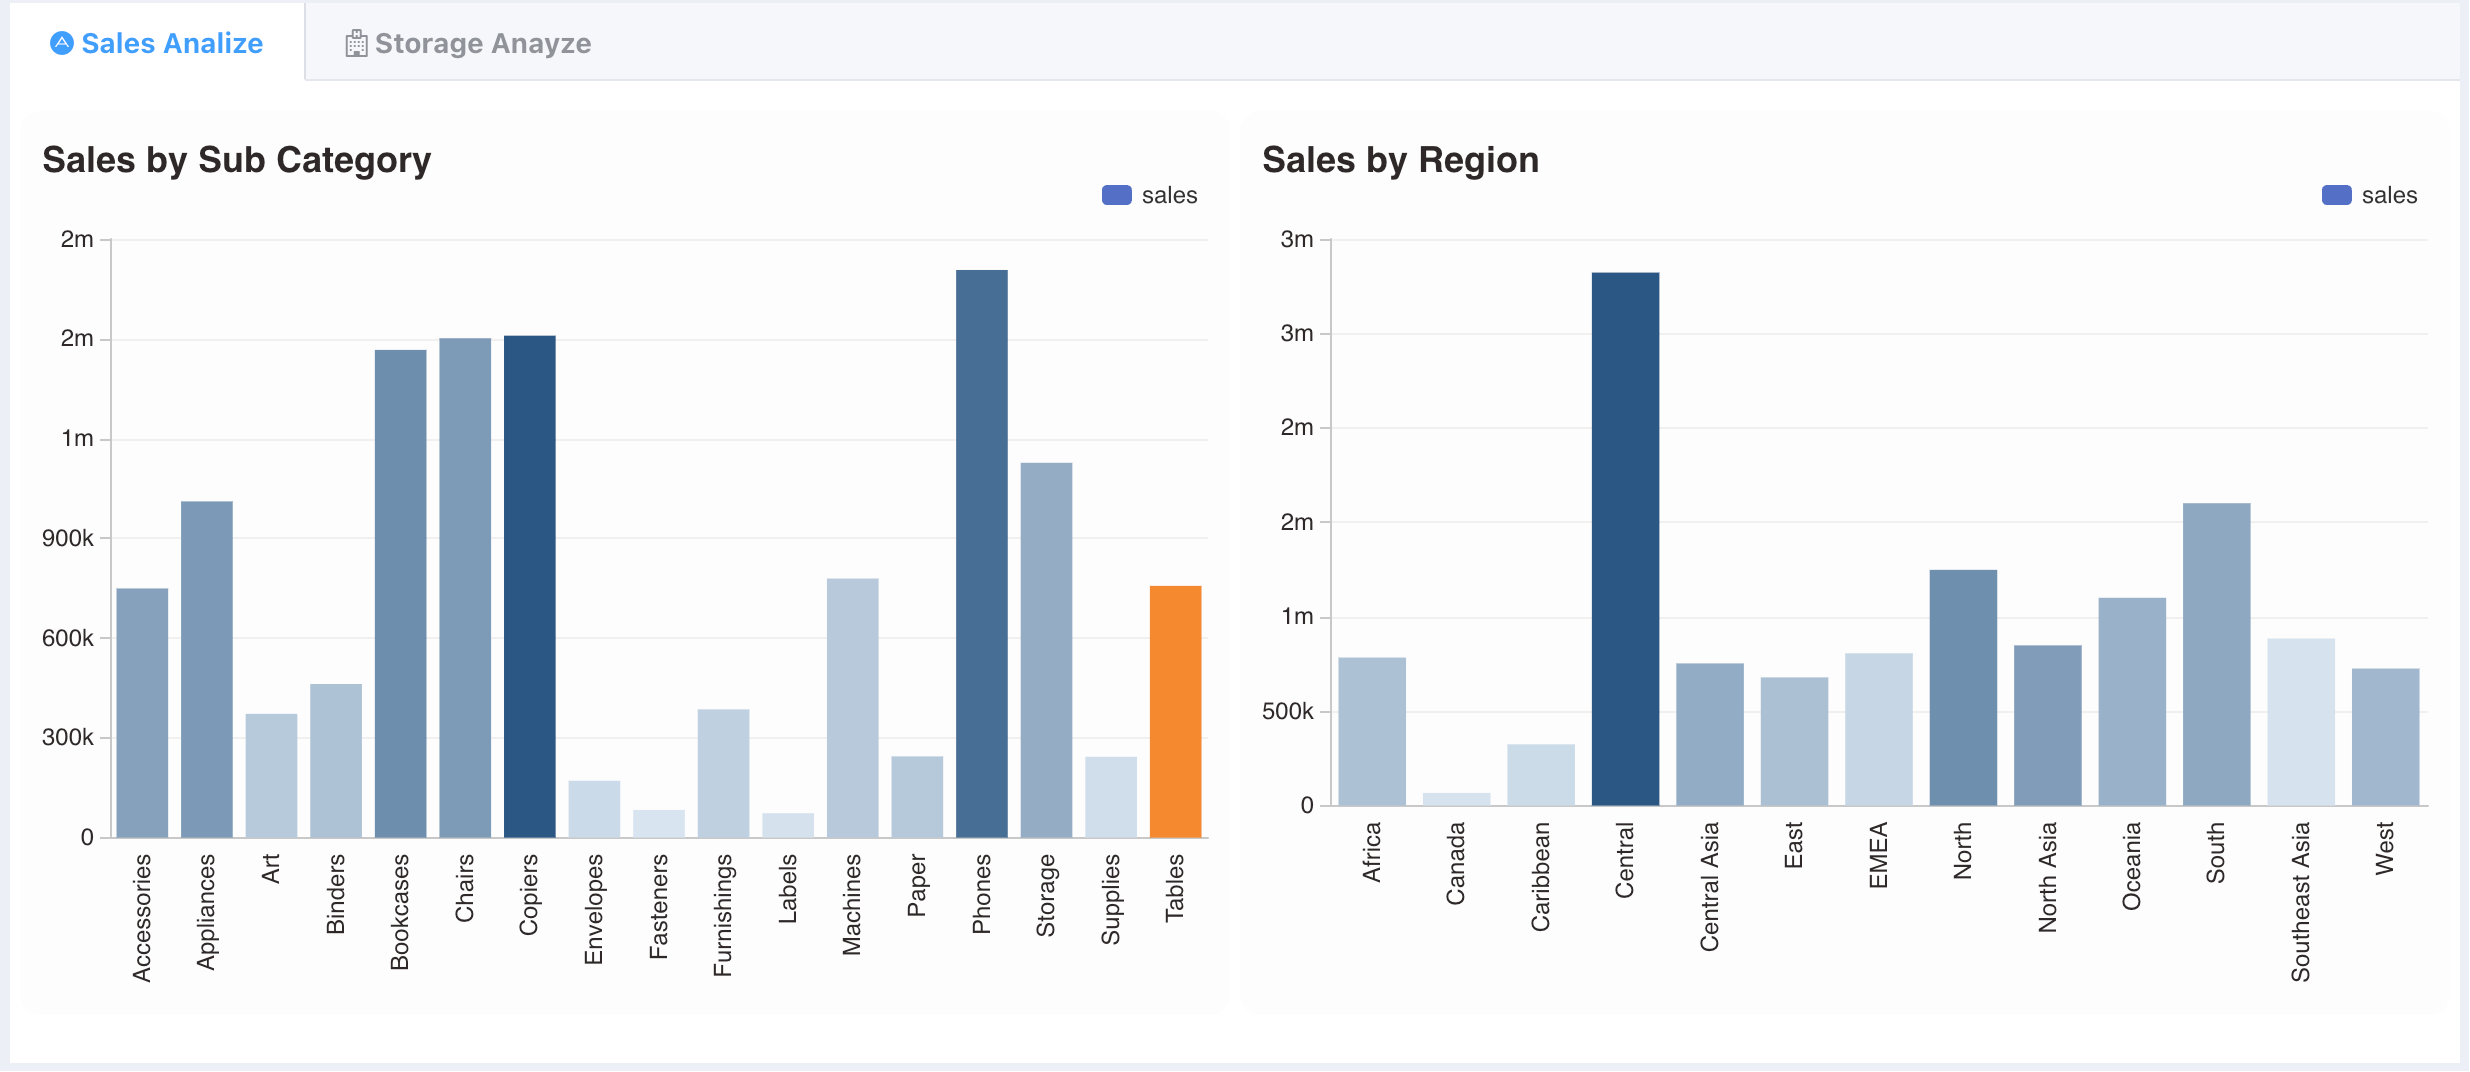
Editing Charts
- For inline charts, click edit, save, and modifications are applied directly.
- For referenced charts, clicking edit jumps to the chart editing page. Before jumping, please ensure all modified content on the current dashboard has been saved; otherwise, unsaved modification data will be lost.
When editing a referenced chart, because if that chart is referenced by multiple dashboards, changes will affect multiple dashboards.