Chart Linkage
Chart Linkage
Dashboard chart linkage dynamically filters data in other charts by selecting or clicking elements of a chart. Compared to dashboard parameters, it provides a more intuitive and interactive way to explore data. This method reduces the steps users need to manually set filter conditions, making the data analysis process smoother and more efficient, enhancing the user experience. At the same time, it can display correlations and impacts between data in real-time, helping to discover insights faster.
- One-to-many linkage, supporting linkage to datasets or individual charts.
- Supports excluding specified charts from linkage.
- Active and passive linkage states are visible. Users can clear initiated active linkages.
Link to Datasets and Charts
- In dashboard edit mode, access the Chart Linkage design card from the top-right function menu of a chart to enter the linkage design interface.
- Click Add Link Object, select the linkage object type.
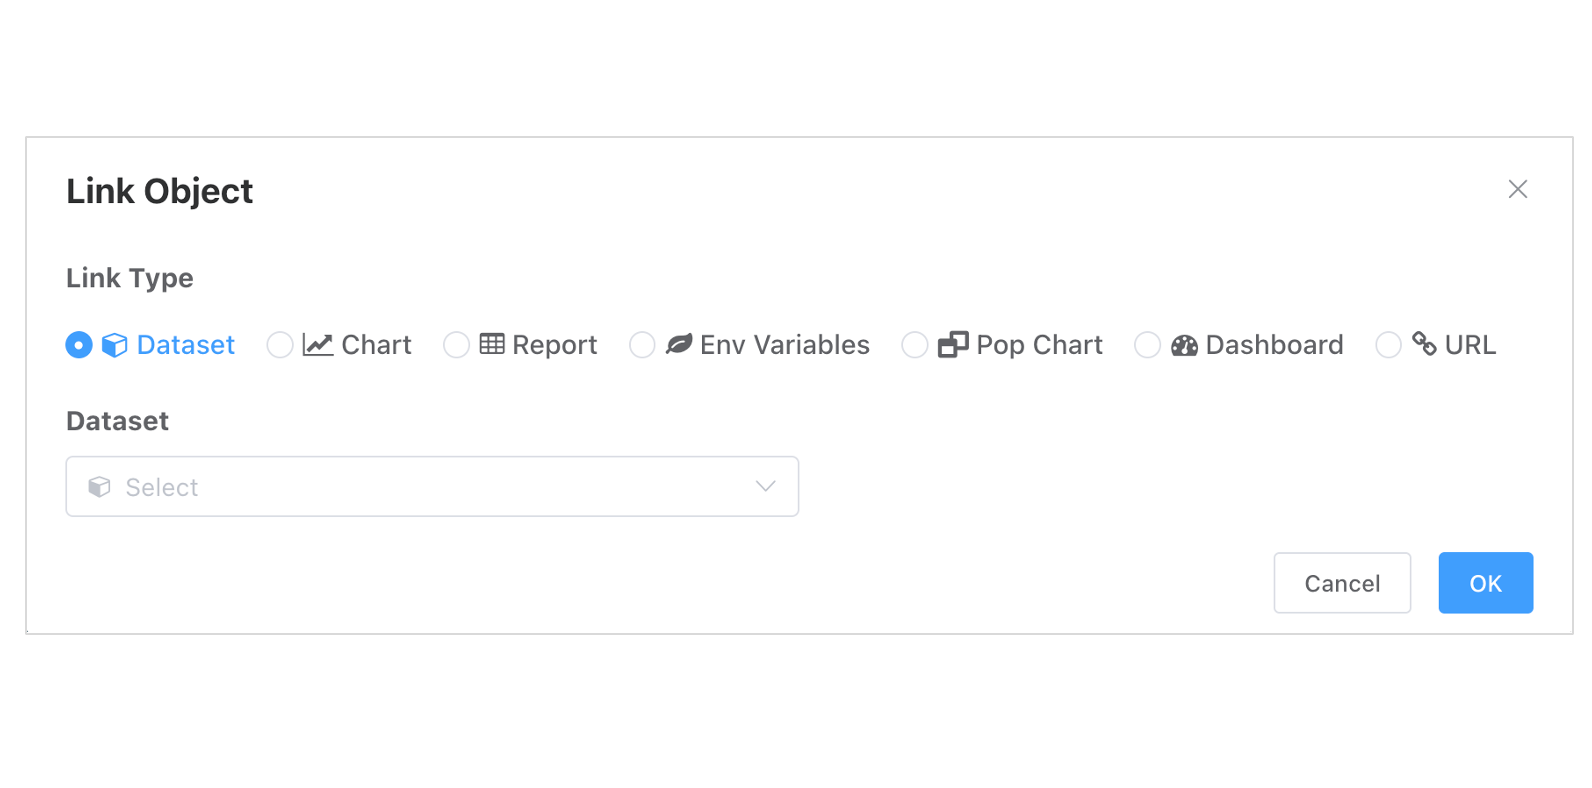
- Confirm addition. The linkage object appears as a tab below.
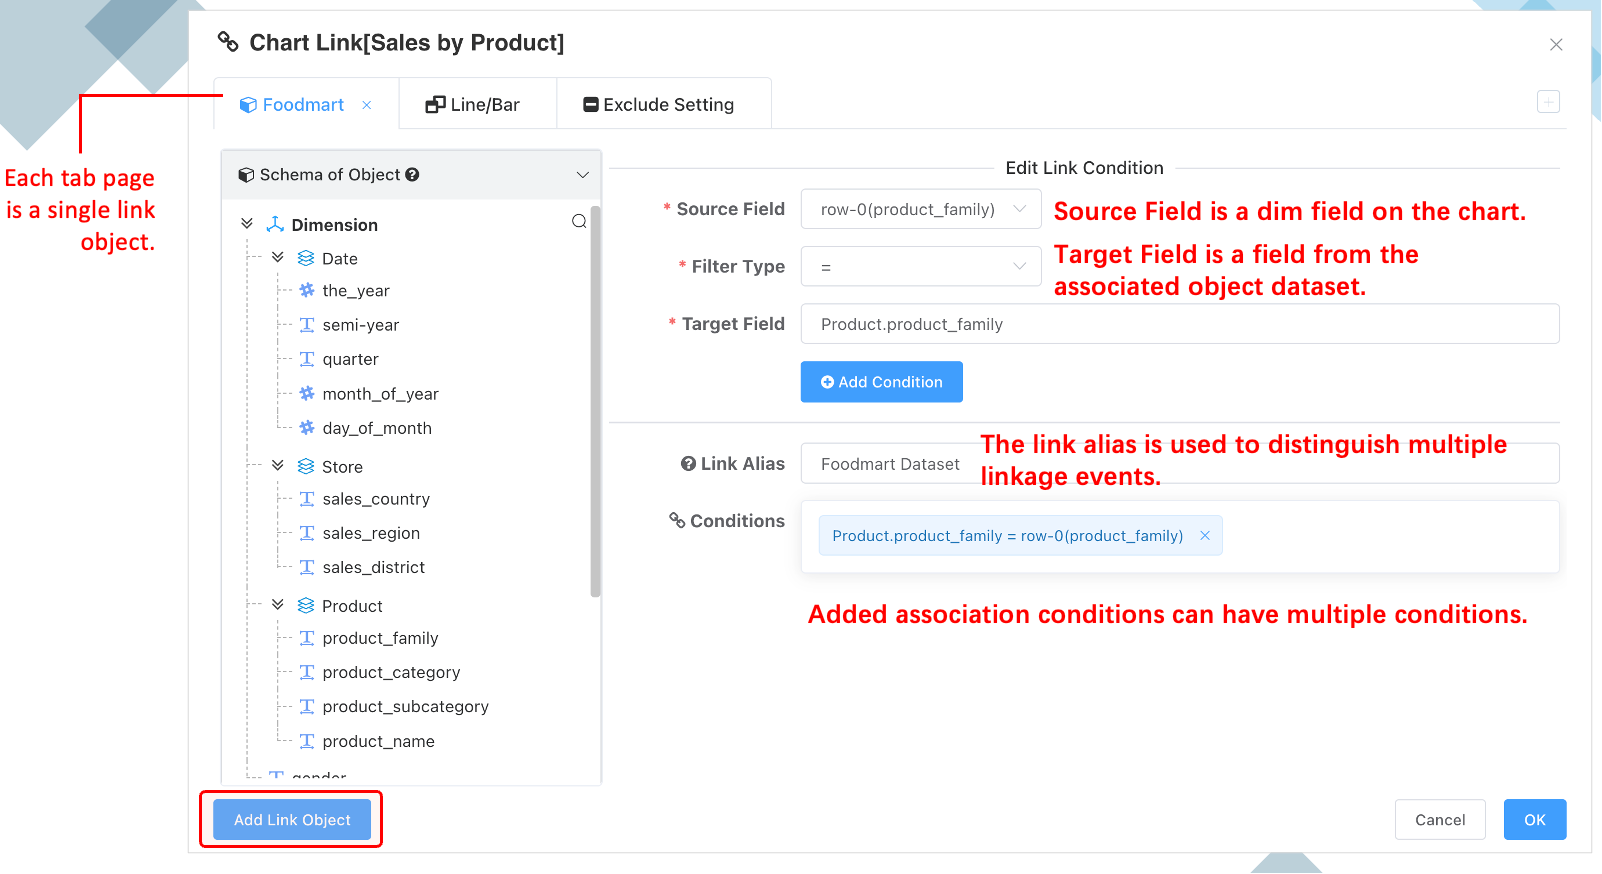
- A chart's click event can be linked to multiple objects. Each tab in the designer below represents one linkage object definition.
- Select the Source Field for the specified click event: source fields correspond to row/column dimensions in the chart design.
- Select the Target Field for the linked object: target fields correspond to the target dataset or AD-HOC query. Select target fields by clicking nodes in the left-side model tree.
- After selecting source and target fields, click Add Condition to save the linkage condition.
- One click event involves multiple dimension values. Users can add one or multiple linkage conditions.
- Global linkage settings: Exclude self by default. Additionally, select other charts to exclude from responding to linkage events.
- After adding, confirm and save.
Linkage Status
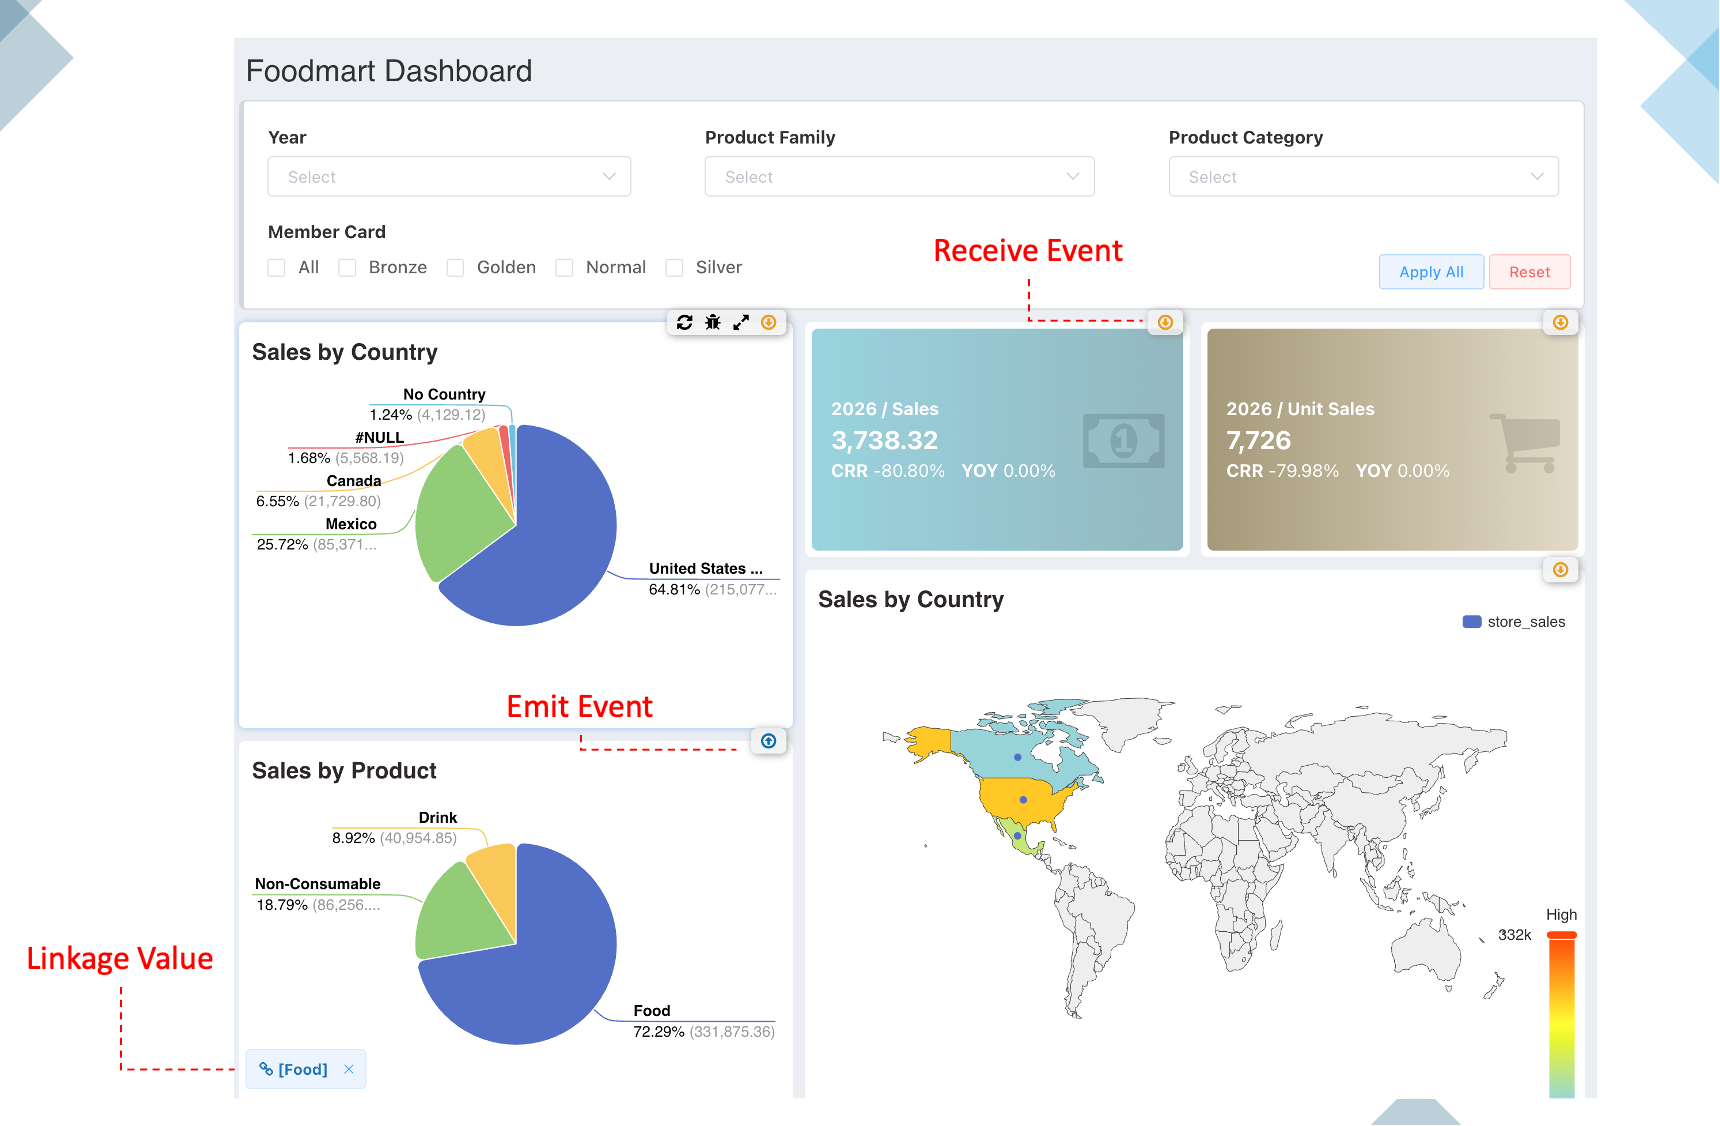
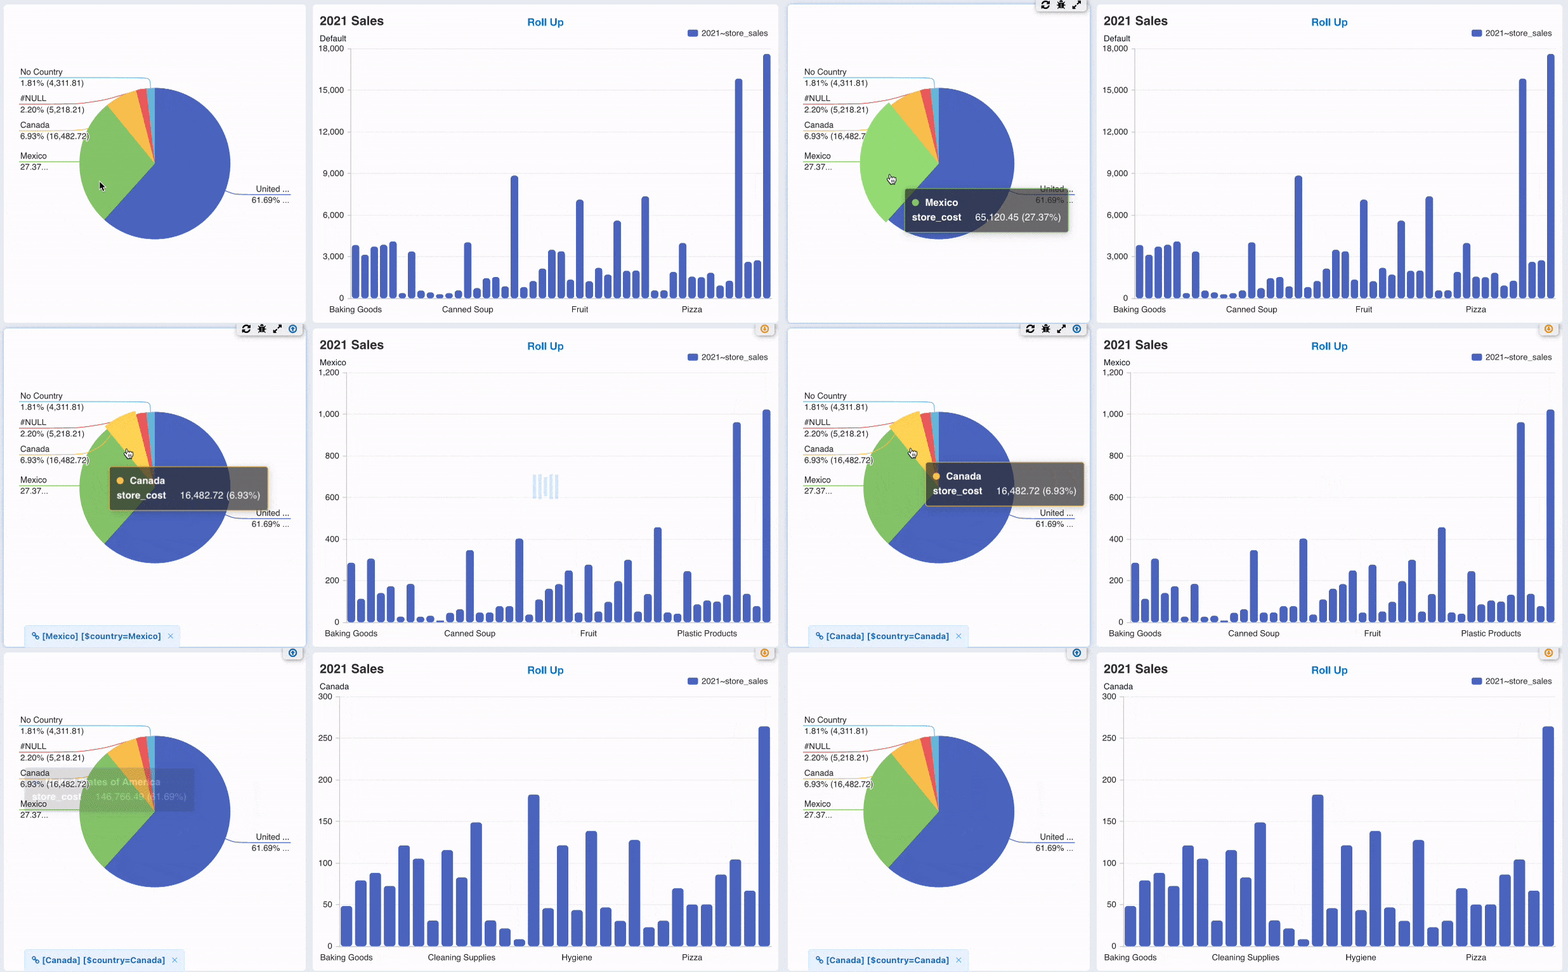
- To inform users whether current dashboard data is being filtered by linkage, status icons appear in the top-right corner of each chart that initiates or receives linkage filtering.
- The current linkage value condition is displayed at the bottom-left corner of the dashboard.
- The linkage status close button can cancel
activelinkage events.
Link to Dashboard
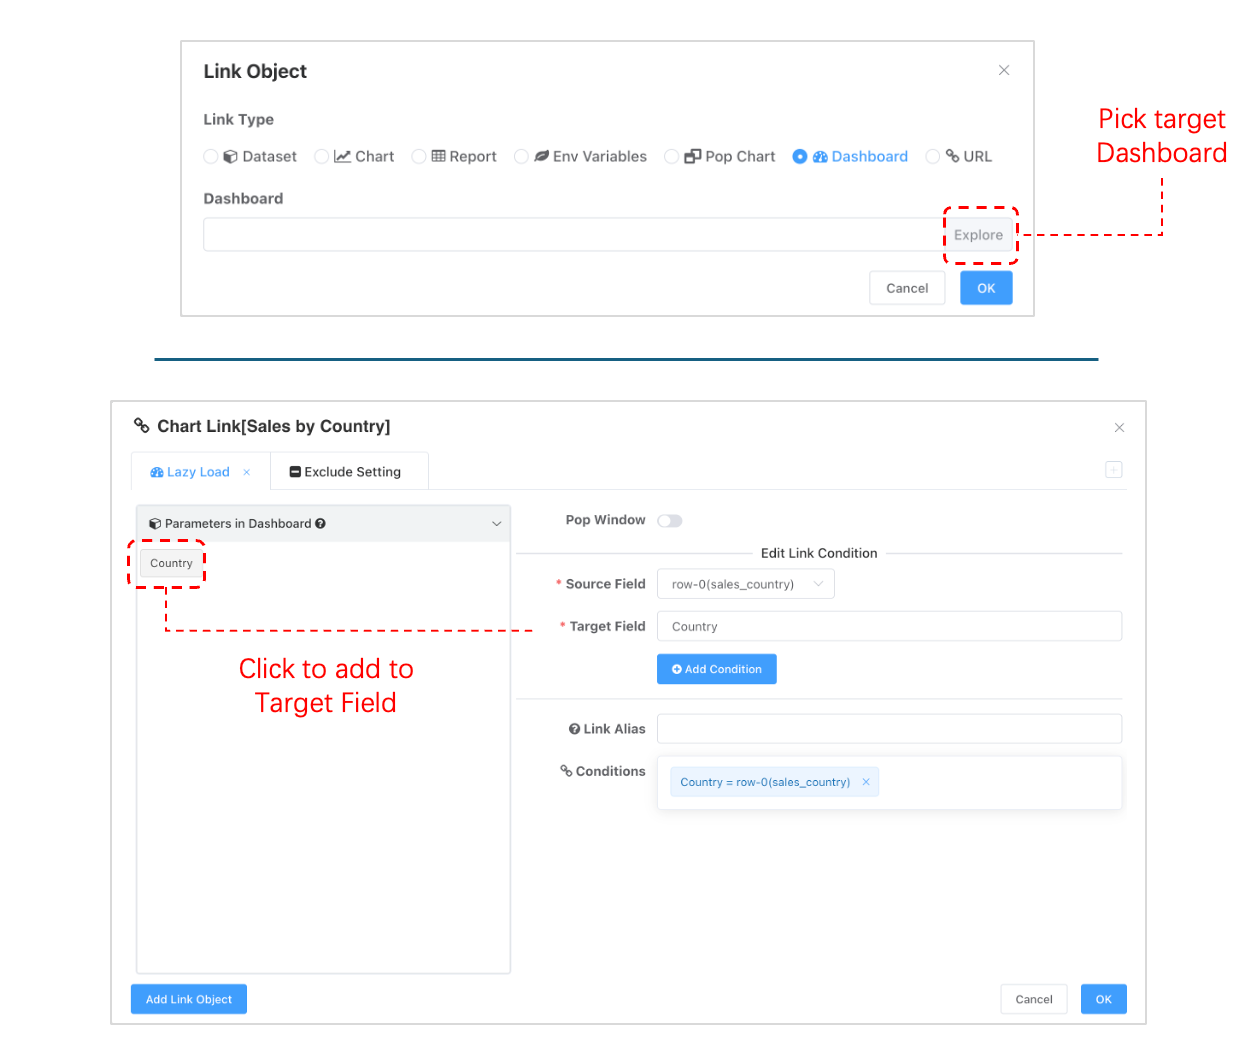
- Click events can also link to another dashboard of the same type.
- Event parameters can be associated with parameters on the linked dashboard. Since linkage event values usually have only one value, linked dashboard parameter types can only be equality comparisons, not range comparisons.
- Parameter association is optional.
Link to External URL
- Click events can jump to any external URL.
- Event parameters can be converted to URL parameters. Parameter aliases can be customized.
Link to Popup Chart
- Click events can trigger popups within the dashboard, useful for displaying charts not already on the dashboard.
- Example: Click a KPI to pop up a table showing the corresponding chart.
Operation Flow
- Add linkage object, select Pop Chart.
- Click browse, select the chart to link from the chart directory tree.
- Close the linkage object confirmation window.
- Configure linkage rules in the Link Object section of the linkage configuration.
- Select source field (from source chart row/column dimensions). For charts like KPI cards without displayed row/column dimensions, select constant.
- Select filter type.
- Input constant value.
- Select target field from the left-side model corresponding to the target.
- Add condition.
- After the correct linkage condition appears in the condition list, confirm and close the linkage configuration window.
Link to Env Variables
After linking to environment variables, they can be used for dataset and query variable settings, dashboard API dynamic request parameters, Query variable assignment, etc.
One linkage can produce multiple values. Therefore, the key value in the Add Linkage Object window can be arbitrary. The actual linkage variable name and dimension value relationship is defined in the linkage object edit panel.
Variables in Title
- Titles support variables, including linkage information, environment variables, dimension information.
Environment Variables: ${envVars}
Variables can omit the envVars prefix, e.g.: ${year} == ${envVars.year}
Linkage Information: ${links}
Column Dimension Array: ${groups}
Row Dimension Array: ${keys}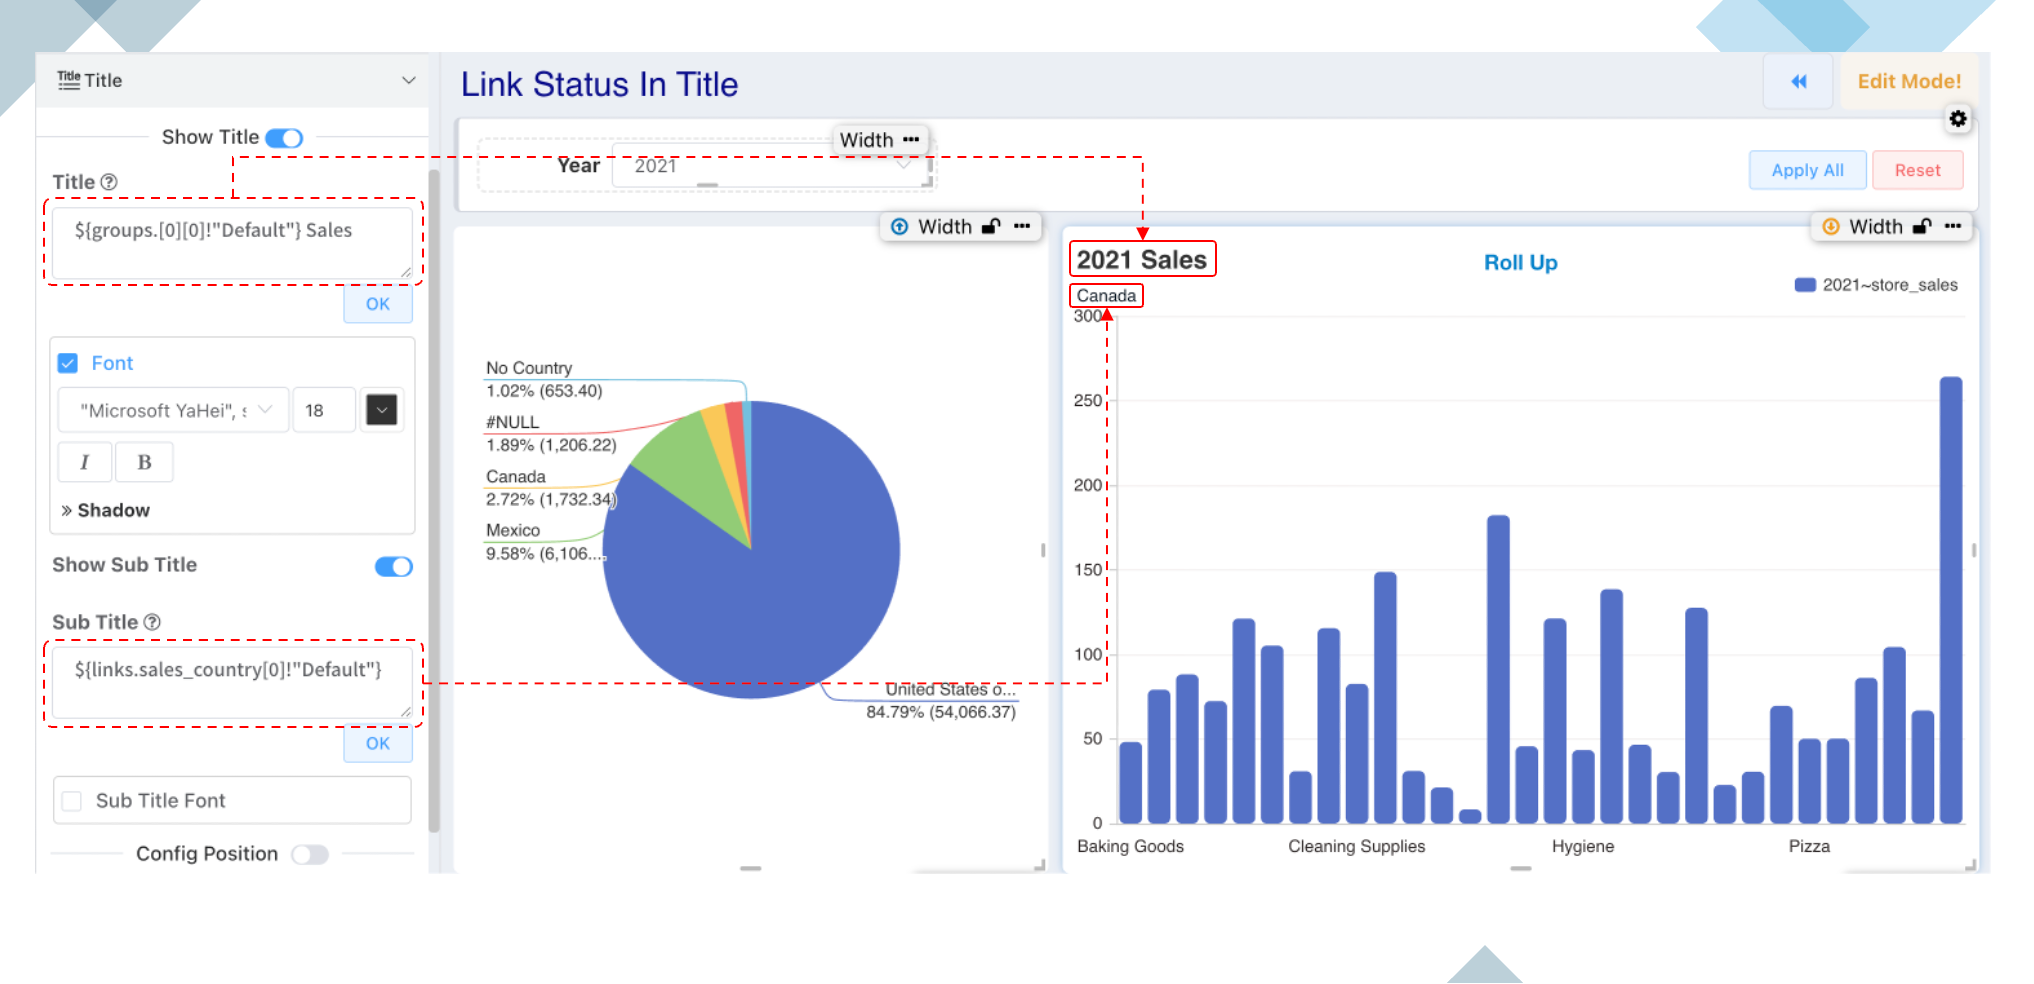
Dynamically change the title when data information changes.
Multiple Linkage Events
Before the upgrade, click linkage events could only distinguish between drill-down and linkage. Multiple linkage events could only trigger the highest priority event (e.g., if linking to dashboard and dataset were both configured, only linking to dashboard would trigger). Configuring links to multiple dashboards allowed only one active link. After the upgrade:
- Link to multiple objects of the same type.
- Link to multiple objects of different types.
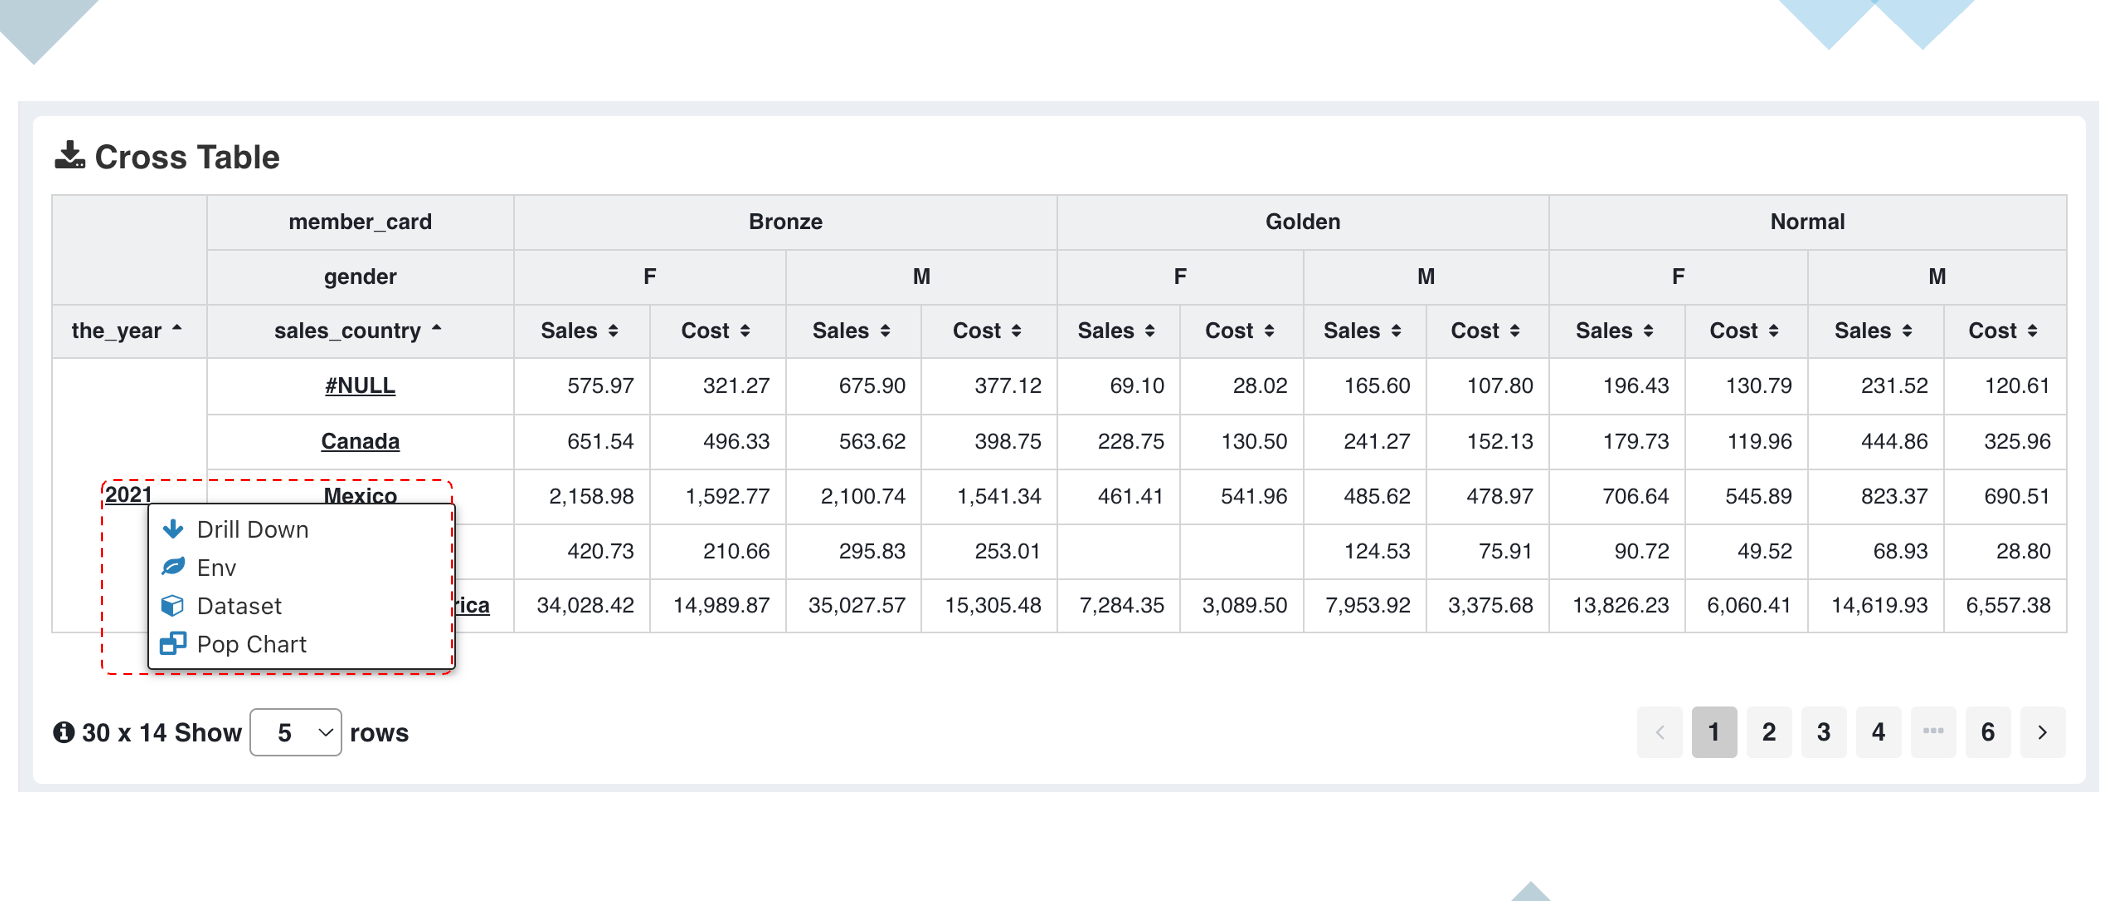
- Use a popup menu to let users freely choose which linked object to trigger.
- Supports configuring Linkage Alias (same alias or no alias configured allows simultaneous triggering).
Click Part In Table
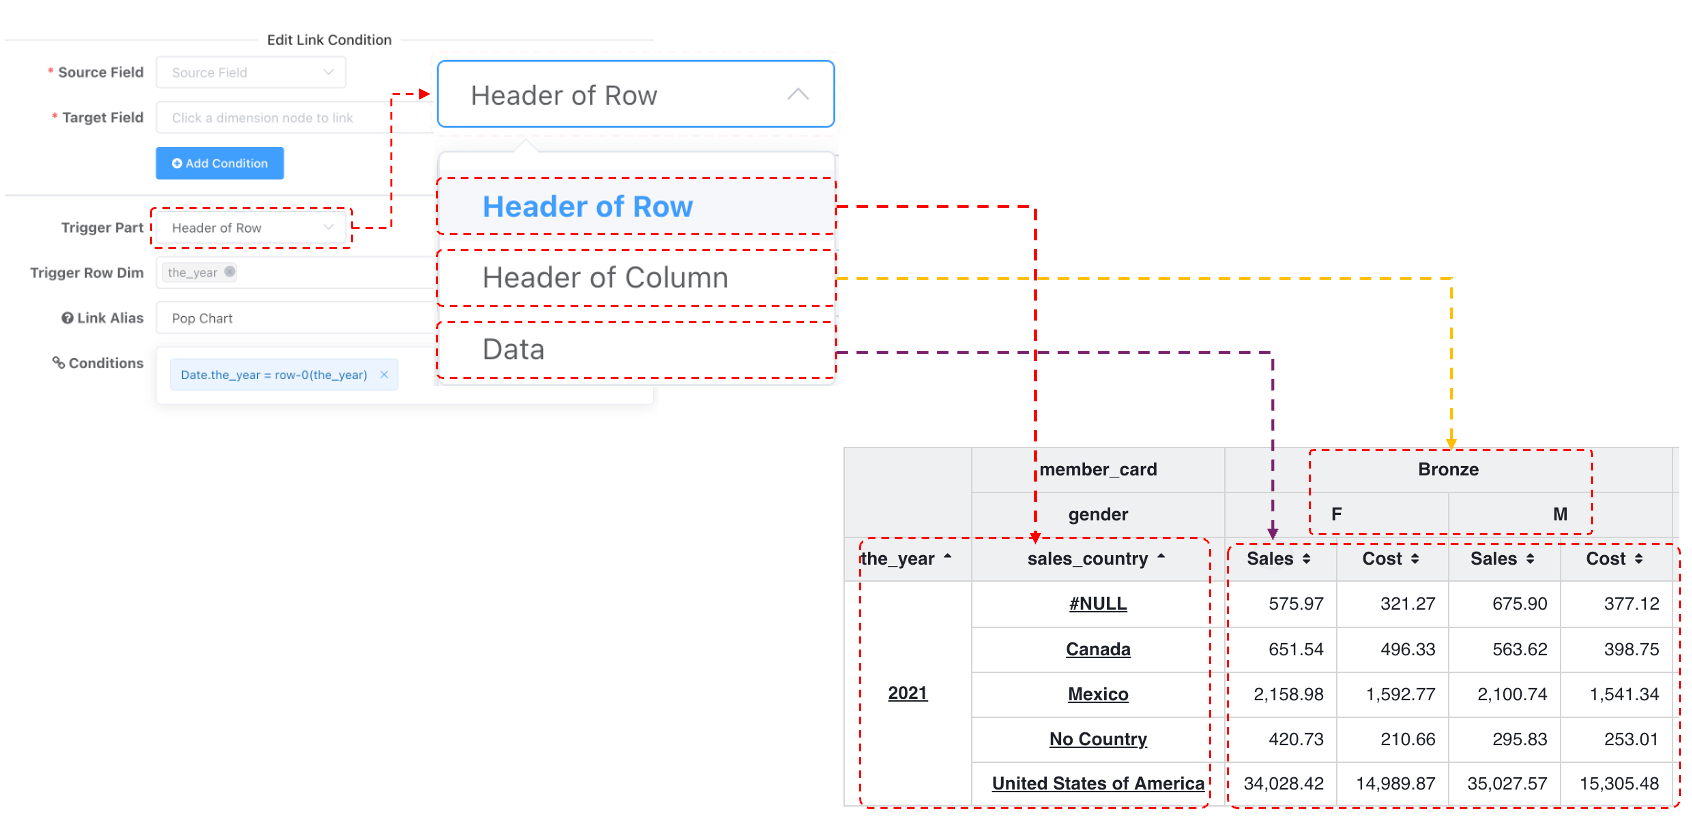
Cross-tables use trigger part selection to determine linkage event types, enabling different linkage events when clicking row headers, column headers, or different measure columns.
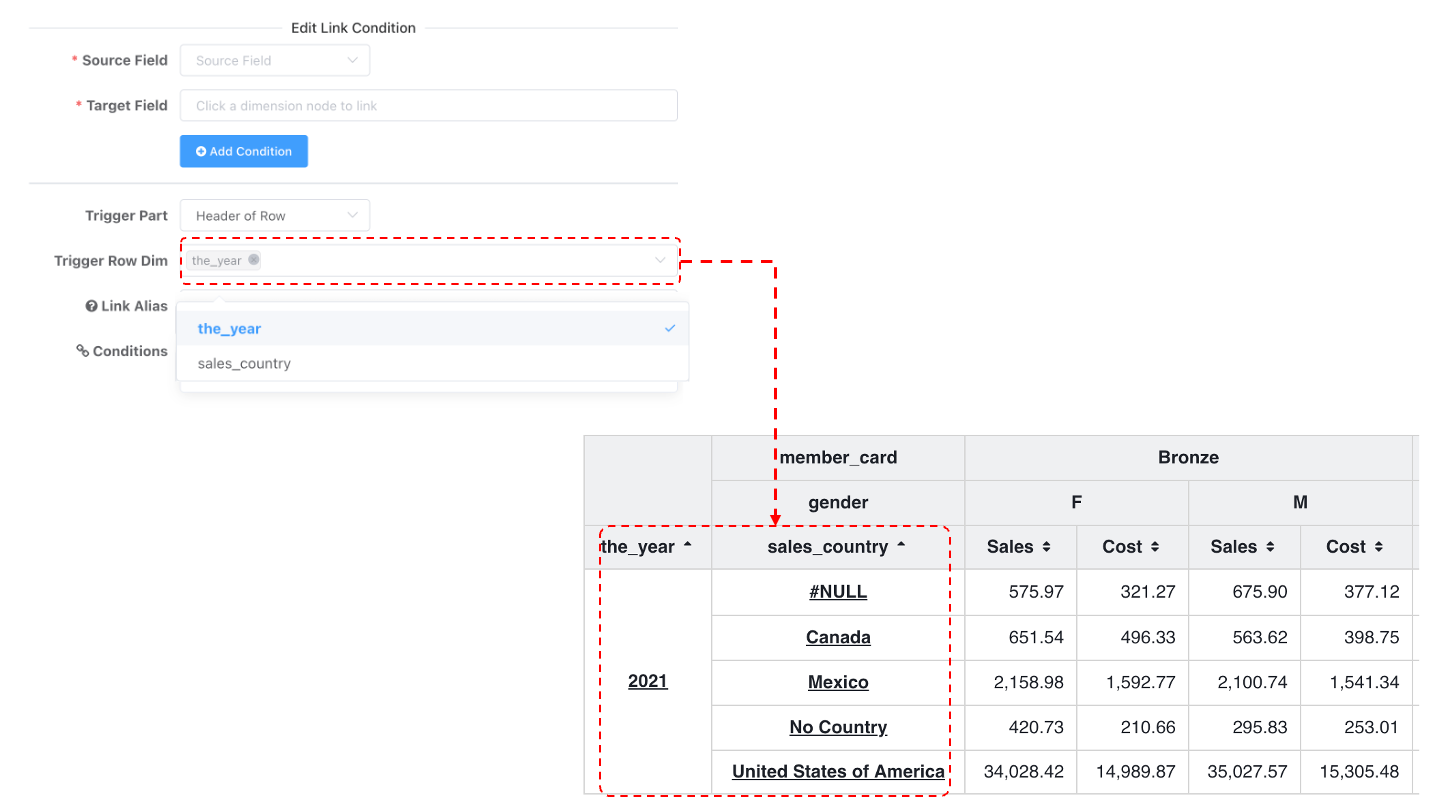
- Distinguish row dimension headers to specific columns.
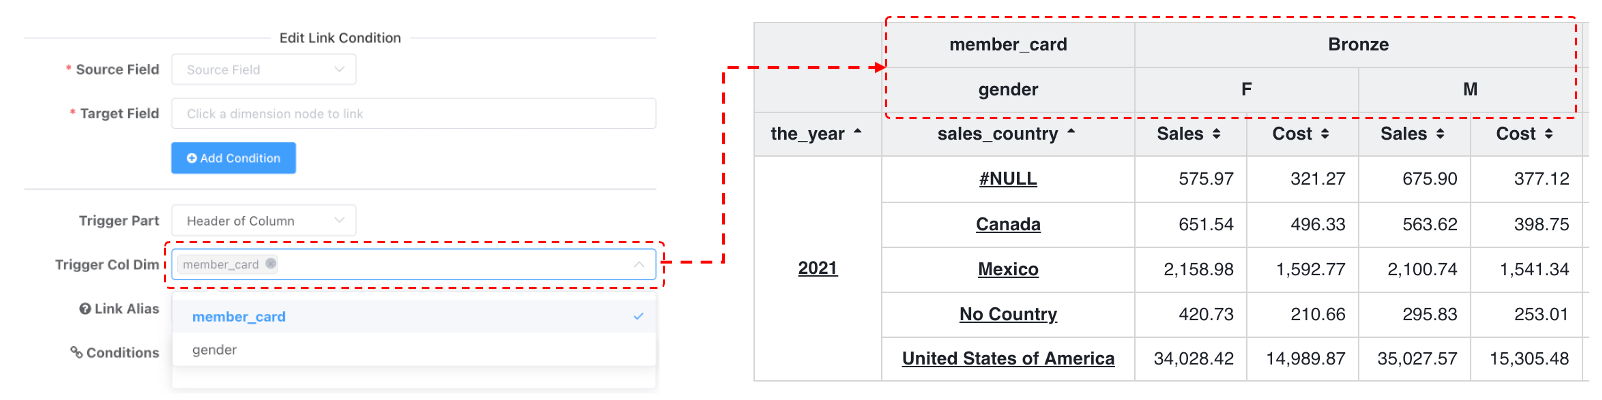
- Distinguish column dimension headers to specific rows.
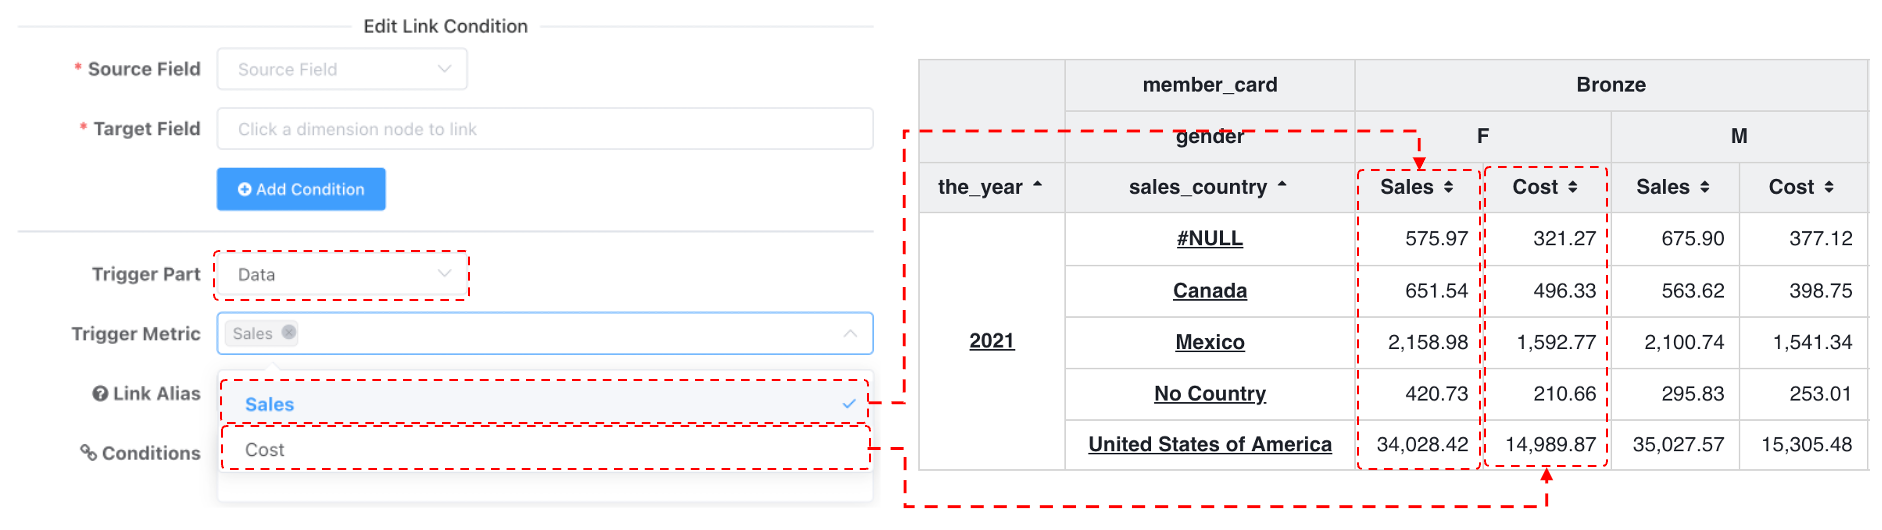
- Distinguish data to specific measures.
-
Detail table linkage also support distinguishes to specified columns.
-
Additional Notes:
- Events with only a single linkage trigger directly without a popup, increasing convenience.
- Precise linkage style display: only columns with linkage events get underlined.
Constant/Exp Source Field
Background
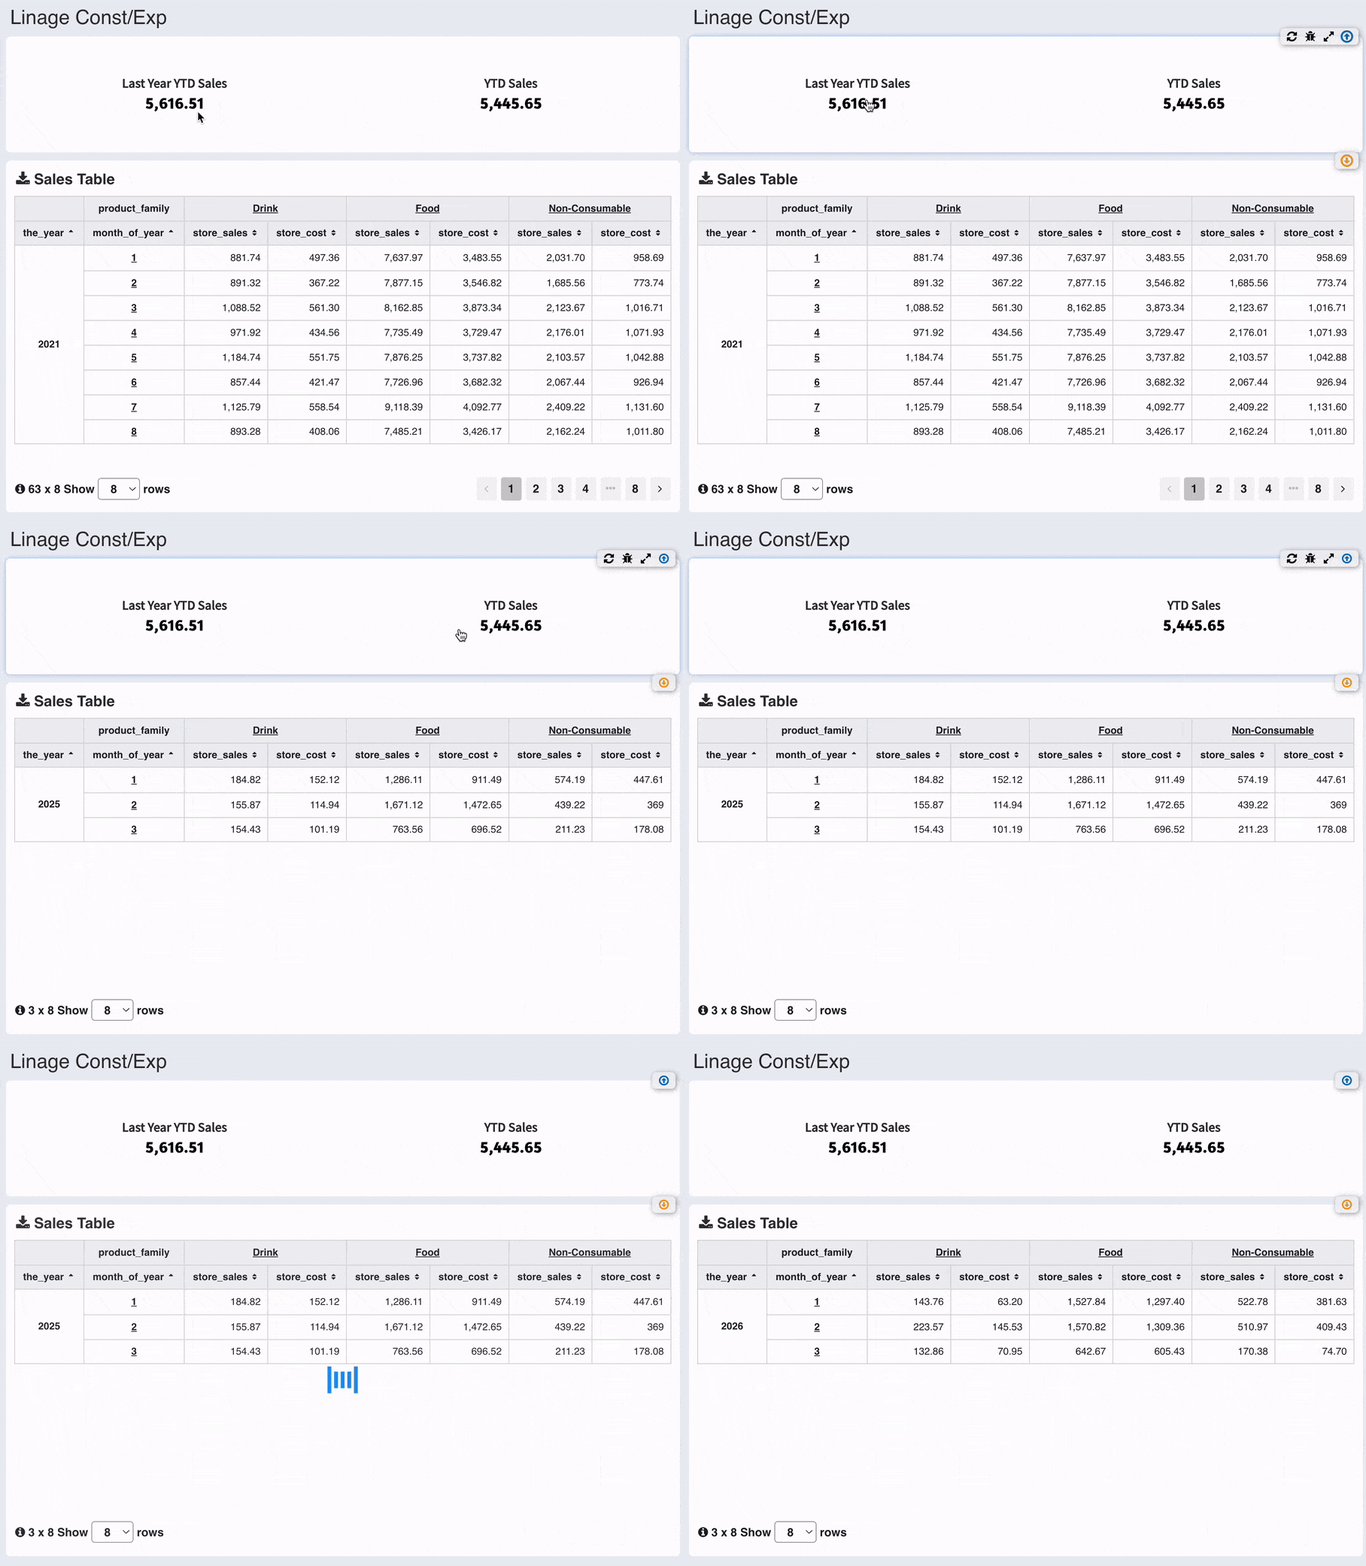
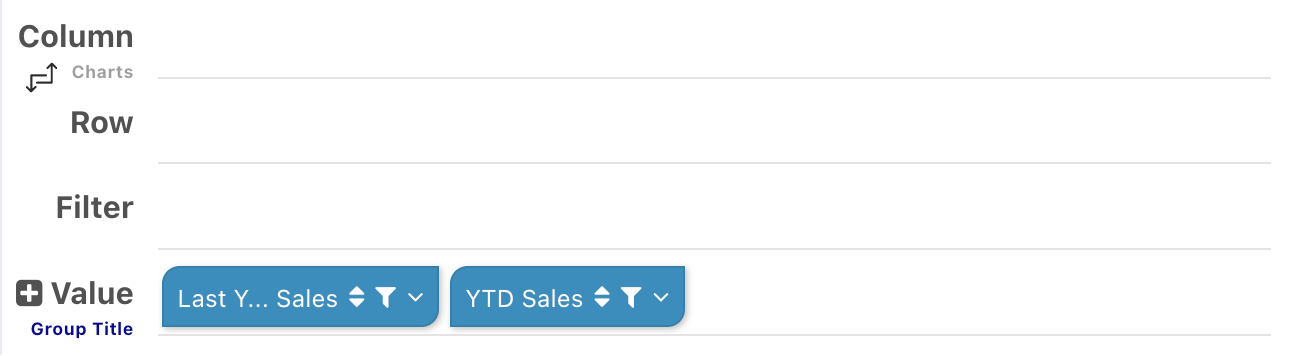
When our measures contain dimension information, as in the KPI card below with Same Period Last Year Sales and Current Year Sales.

Both measures contain date dimension filter conditions but no dimension configuration. In this case, how can clicking a measure filter other charts to the corresponding measure's date range?
Core Capability
- Supports embedding environment variable expressions in linkage constant value rules. Automatically calculates date ranges (e.g., first day of current/last year, date offsets) using the built-in
cdtutility class, enabling the closed loop of "measure click → dynamic date calculation → full dashboard chart linkage filtering." - The same chart supports multiple linkages to the same dataset object.
Linkage Definition Example:
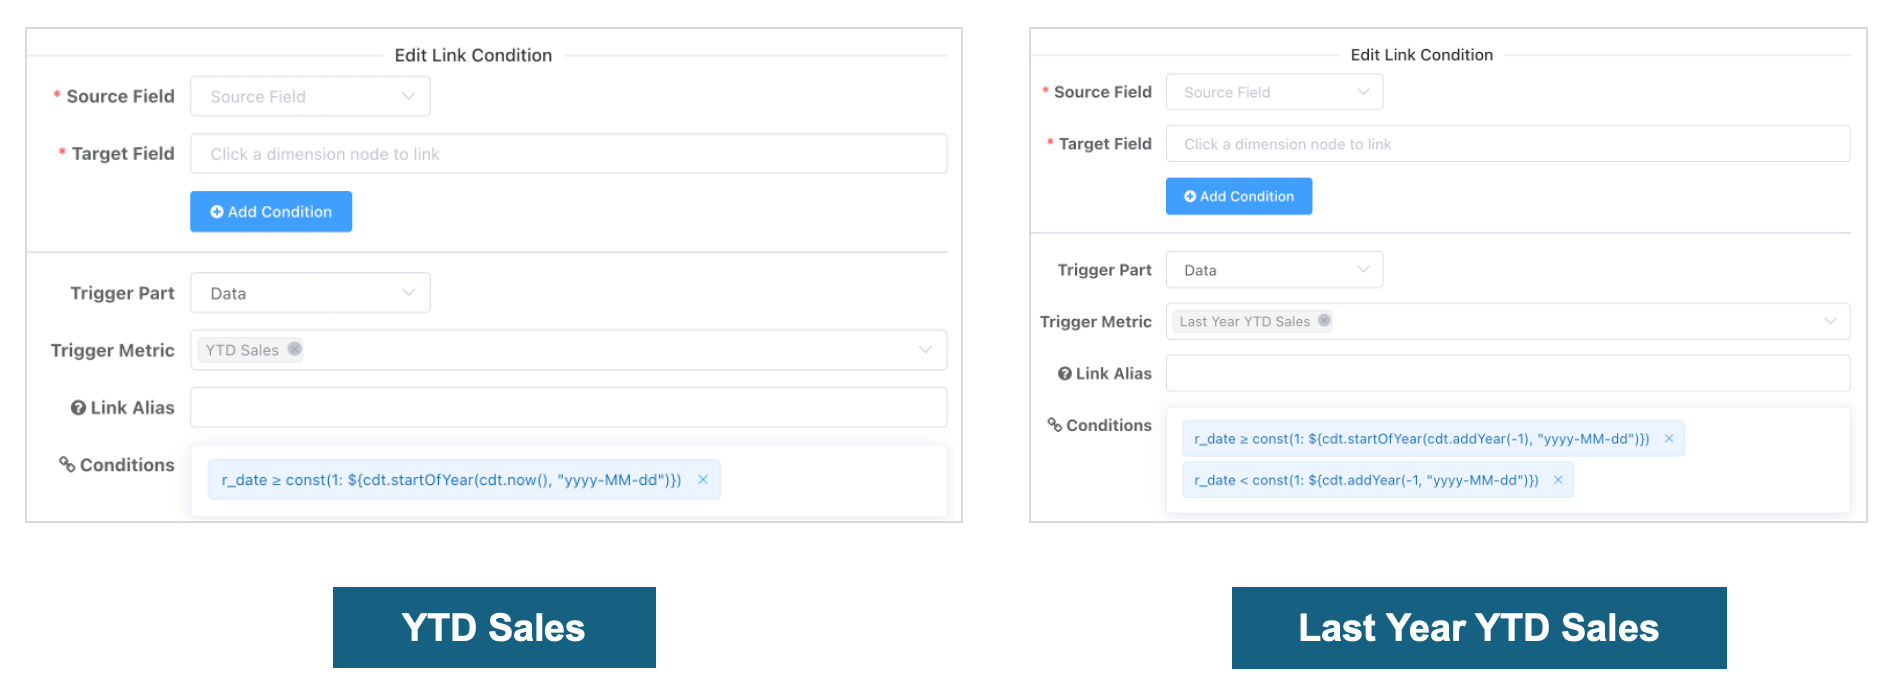
- Same Period Last Year Sales Measure
-- Trigger measure: Same Period Last Year
// Calculate first day of last year via variable expression
r_date >= ${cdt.startOfYear(cdt.addYear(-1), "yyyy-MM-dd")}
// Calculate today of last year via variable
r_date <= ${cdt.addYear(-1, "yyyy-MM-dd")}- Current Year Sales Measure
-- Trigger measure: Current Year Sales
// Calculate first day of this year via variable expression
r_date >= ${cdt.startOfYear(cdt.now(), "yyyy-MM-dd")}