Cross-Table / Pivot Table
Cross-Table / Pivot Table
Overview
Through this chapter, you will master the basic principles of pivot tables, the use of cross-tables, and view calculations on table view (including the following content list):
- Cross-table style configuration
- Hide dimensions, hide measures
- Row/Column Percentage (sub-group)
- Total Percentage
- RANK / DENSE RANK
- ROW_NUMBER
- Cumulative / Cumulative Percentage
- Advanced Statistics
- Month-over-Month (MoM) / Lag Comparison
- Year-over-Year (YoY)
- Row/Column Summaries
- Row/Column Subtotals
- Expressions
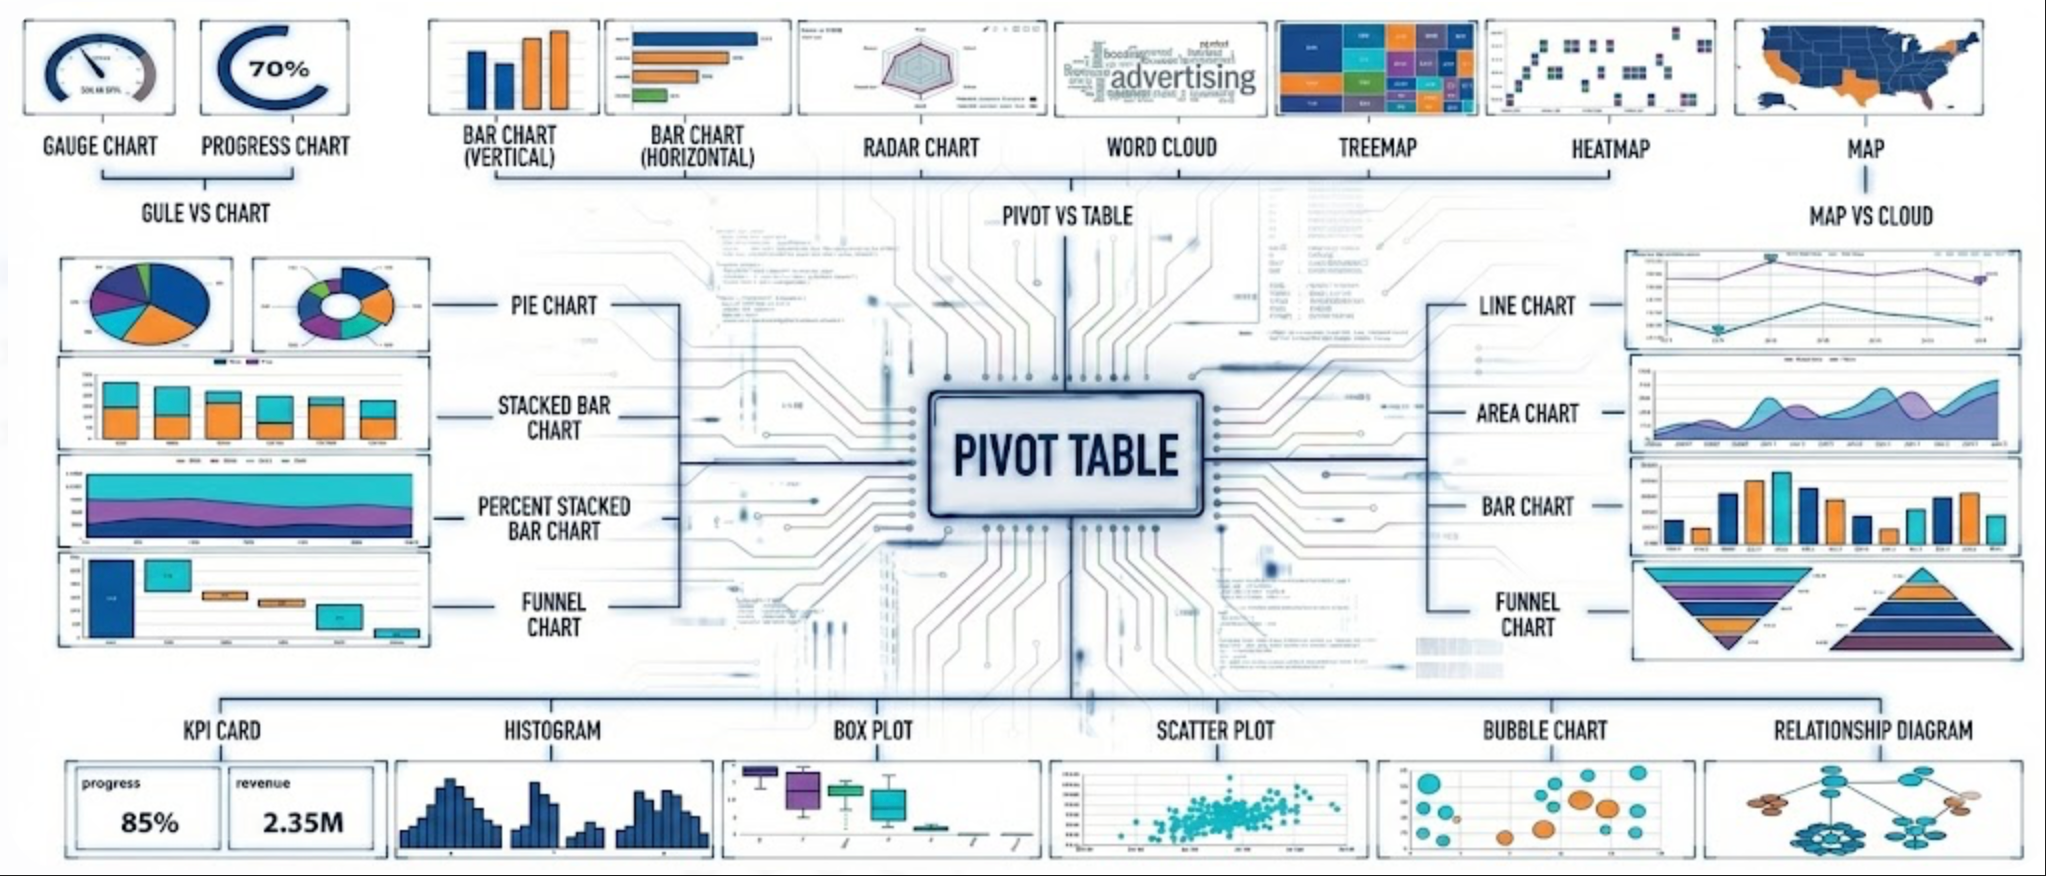
Pivot Table Model
Starting from v1.8, the value type change operations originally only supported in cross-tables have been extended to all chart types. This brings the benefits:
- Easier data model design using cross-tables as the base, then mapping data to other chart types.
- Avoids the issue where value type changes configured in a cross-table are lost when switching to other chart types, causing inconsistency in value content between chart types.
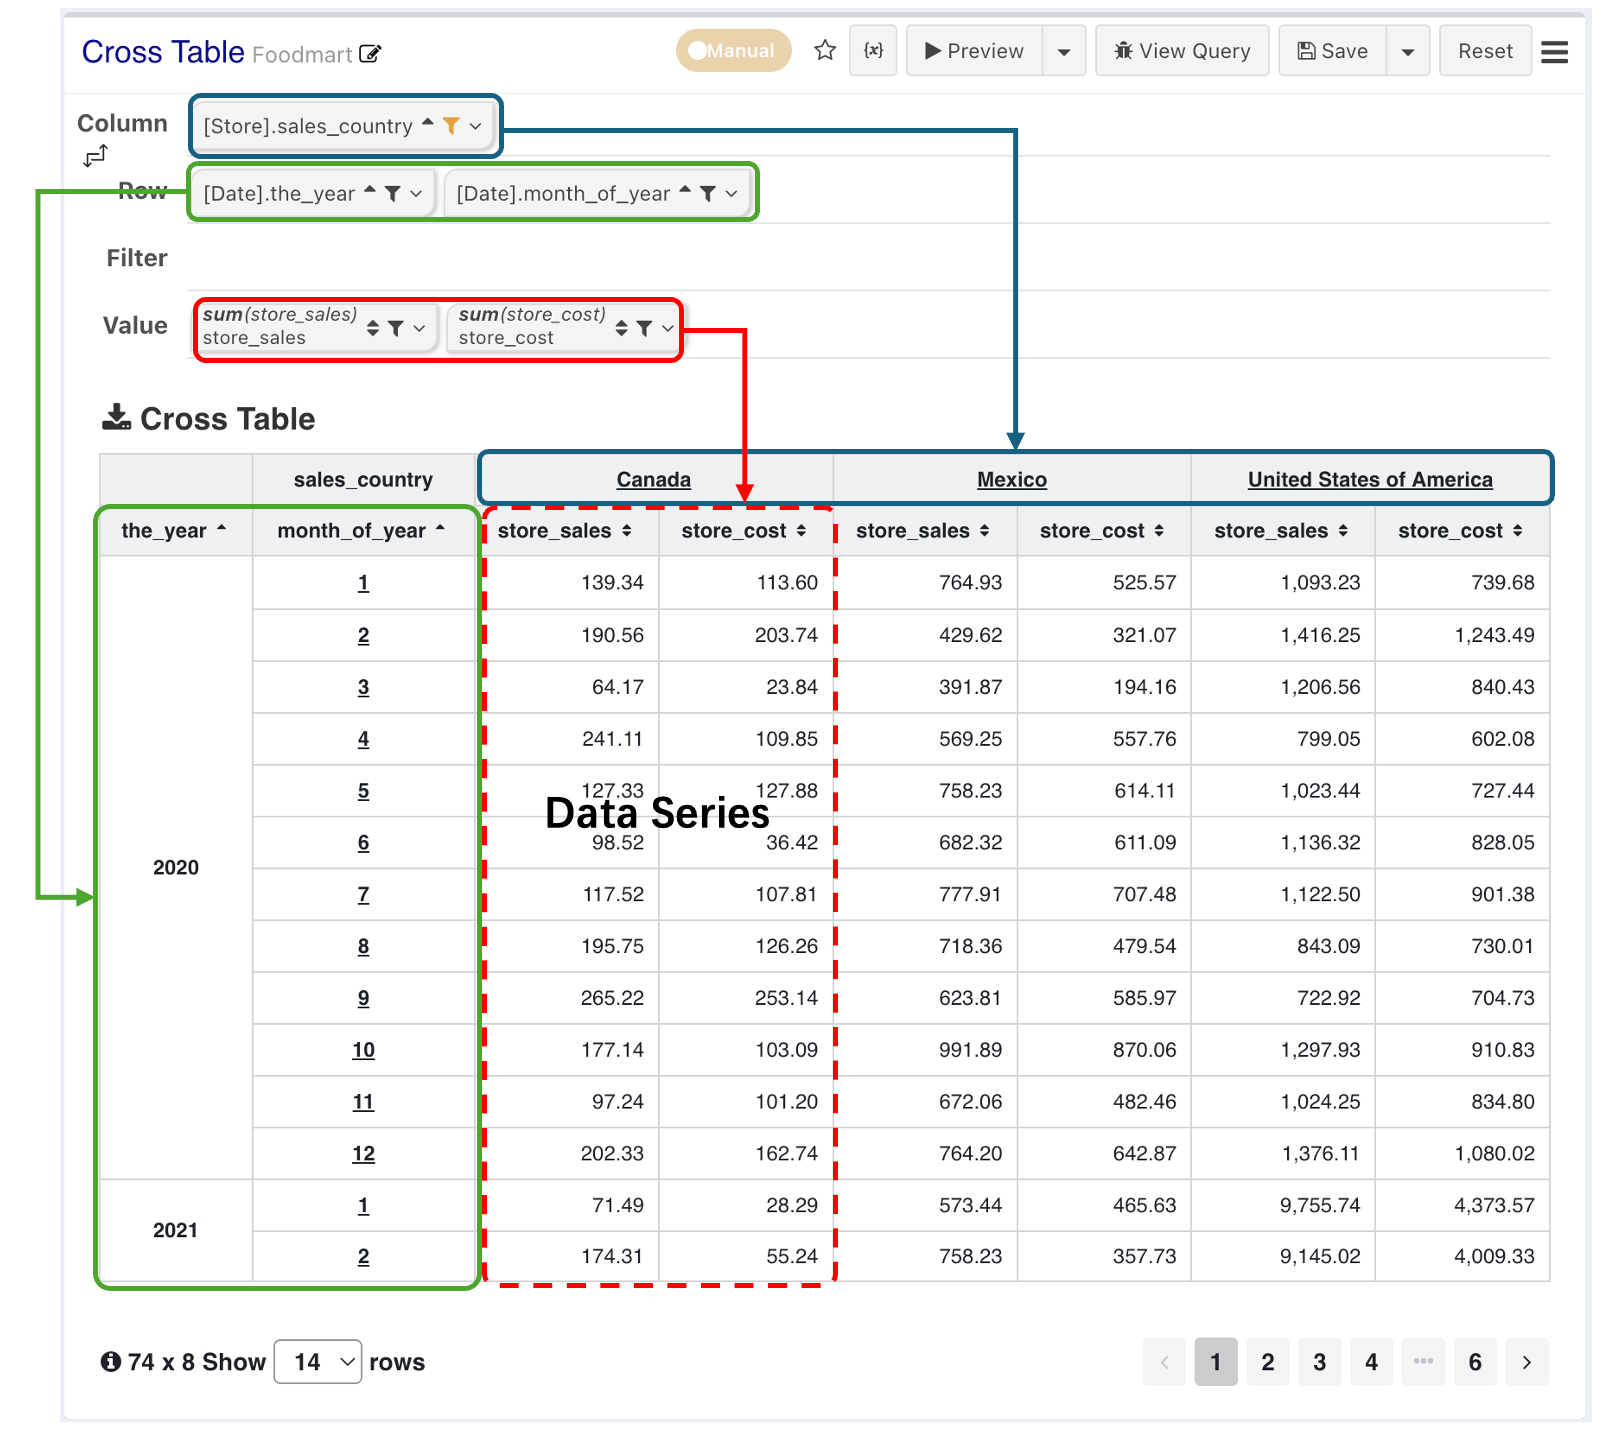
A typical cross-table consists of row headers, column headers, and aggregated measure data in the middle.
Note
The row in row headers refers to the header of a row of data, not that the headers themselves are arranged in rows.
Once we have the original cross-table, we can perform secondary processing on the table data (view data), enabling rapid value type transformations to calculate row/column percentages, total percentage, etc.
Hide Dimensions Member / Measures Column
Use Cases: Participate in calculations but do not need to be displayed, e.g.:
- Year-over-Year (requires last year's data but doesn't need to display it)
- Value type expressions (operations on two measures, but original measures don't need display)
Cross-Table Data Calculation
All value type calculations and transformations in a cross-table are performed locally on the aggregated values already loaded and displayed within the table, and do not trigger any extra round-trip queries to the underlying data source.
These surface-level computations cover common analytical operations, including row percentage calculation, row/column difference, value ranking, unit conversion, and basic arithmetic operations between multiple existing metrics.
Since all computing logic runs directly on the finished cross-table result set instead of re-fetching raw data from databases, data warehouses or datasets, this design delivers two core advantages:
- It eliminates repeated scanning of the underlying
data sourceand cuts down data query latency significantly; - It reduces redundant server computing overhead and eases the overall load of the data engine.
No matter how you adjust the rules of surface calculation, or switch display modes such as percentage, difference and ranking, the system will never initiate brand-new data requests to the backend data source. All computing logic only acts on the existing loaded values inside the cross-table, without recalculating or reloading full raw data from the data layer.
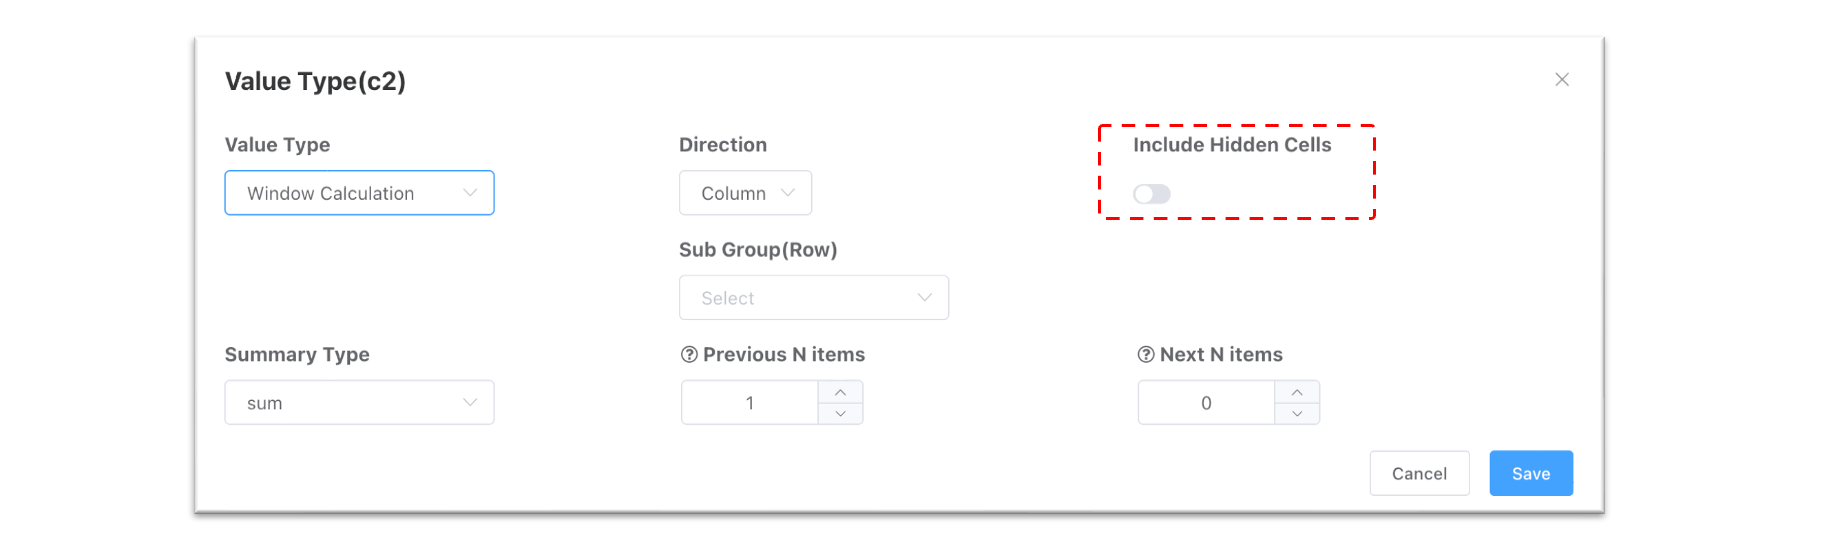
By default, hidden cells do not participate in view calculations. If hidden cells need to participate in calculations, enable the Include Hidden Configurations in the corresponding settings.
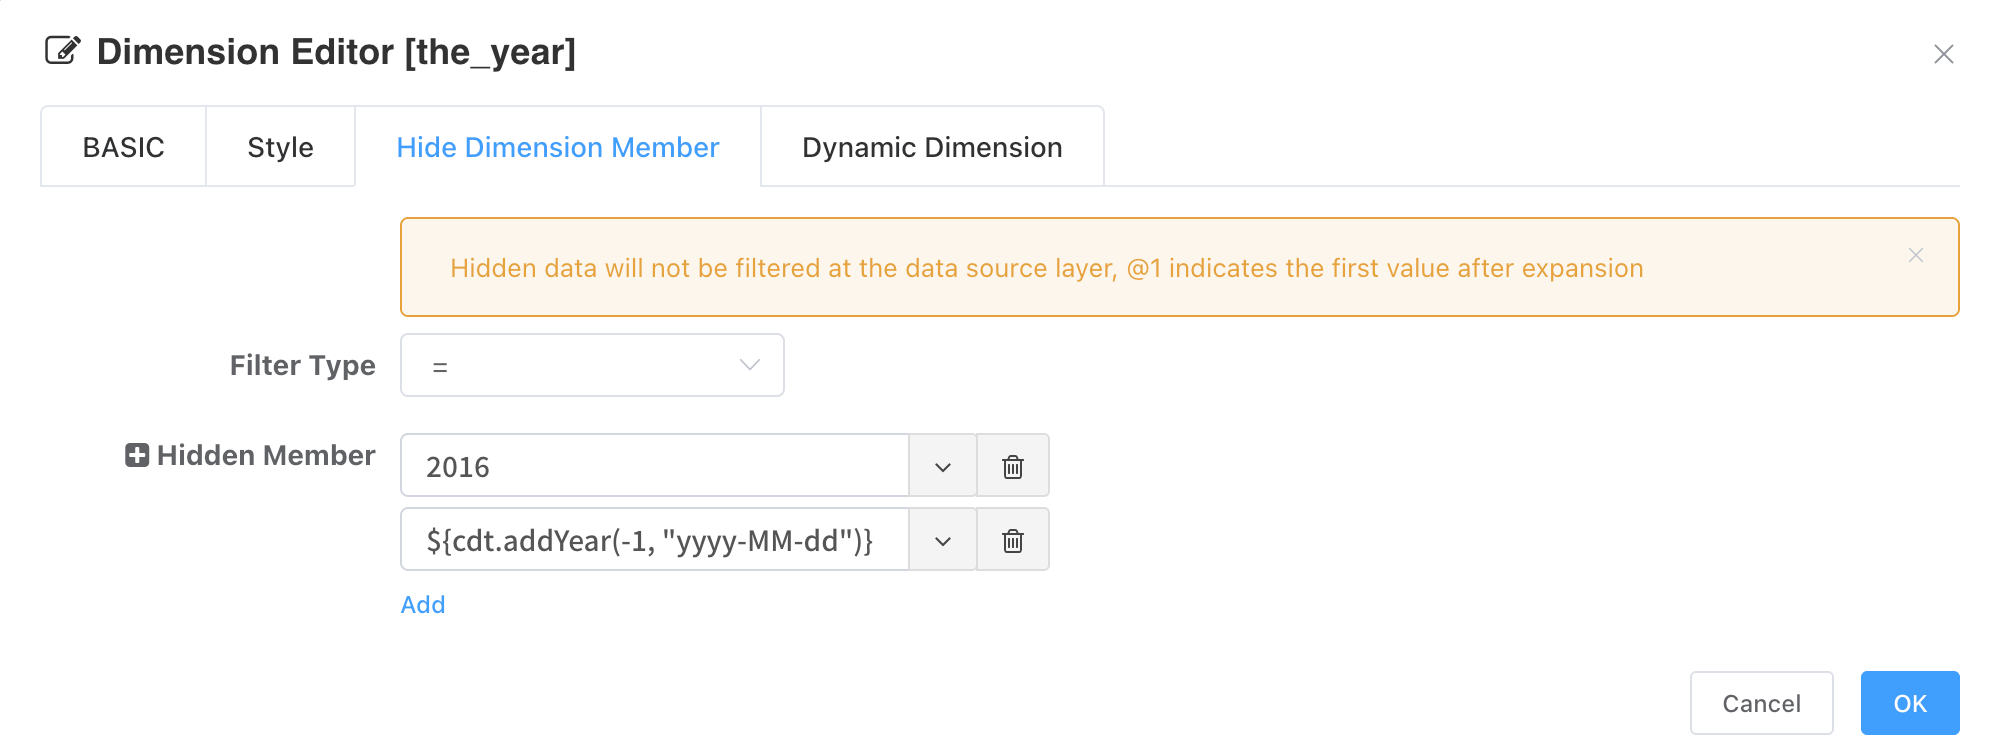
Hide Dimension Members
Hidden members are not mean filtered at the data source layer, only hidden in the insight view. @1 indicates the first value after expansion, often used for hiding in MoM/YoY calculations.
Hide Measures
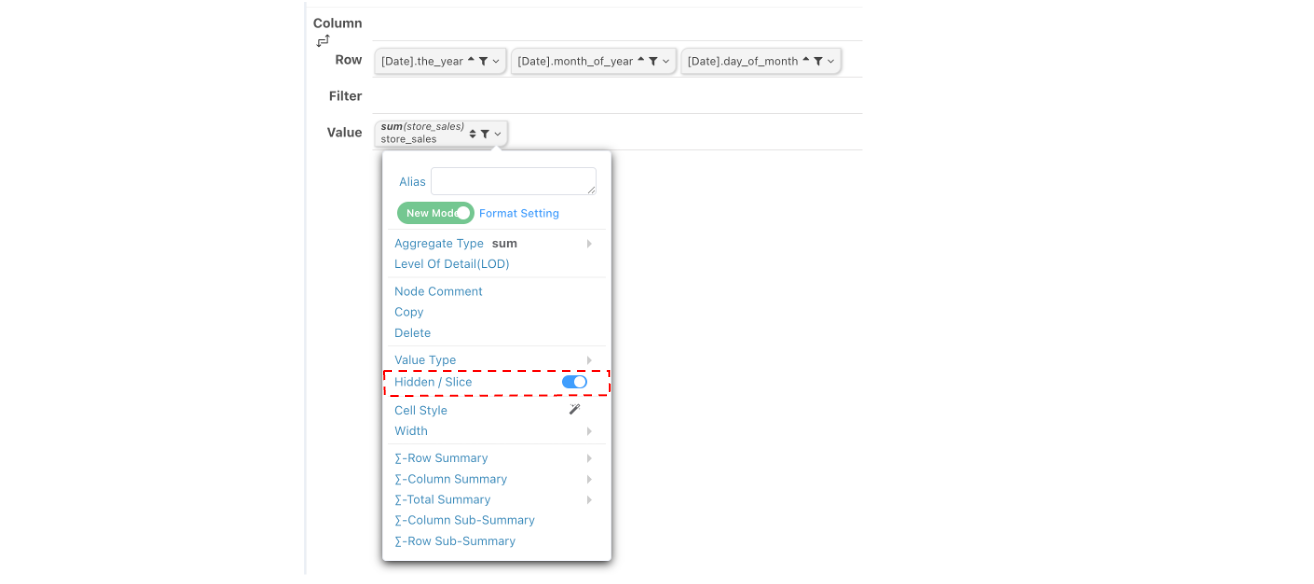
Turning on hiding for a measure without setting conditions will hide all measure columns.
Hide Measures with Dimension Conditions
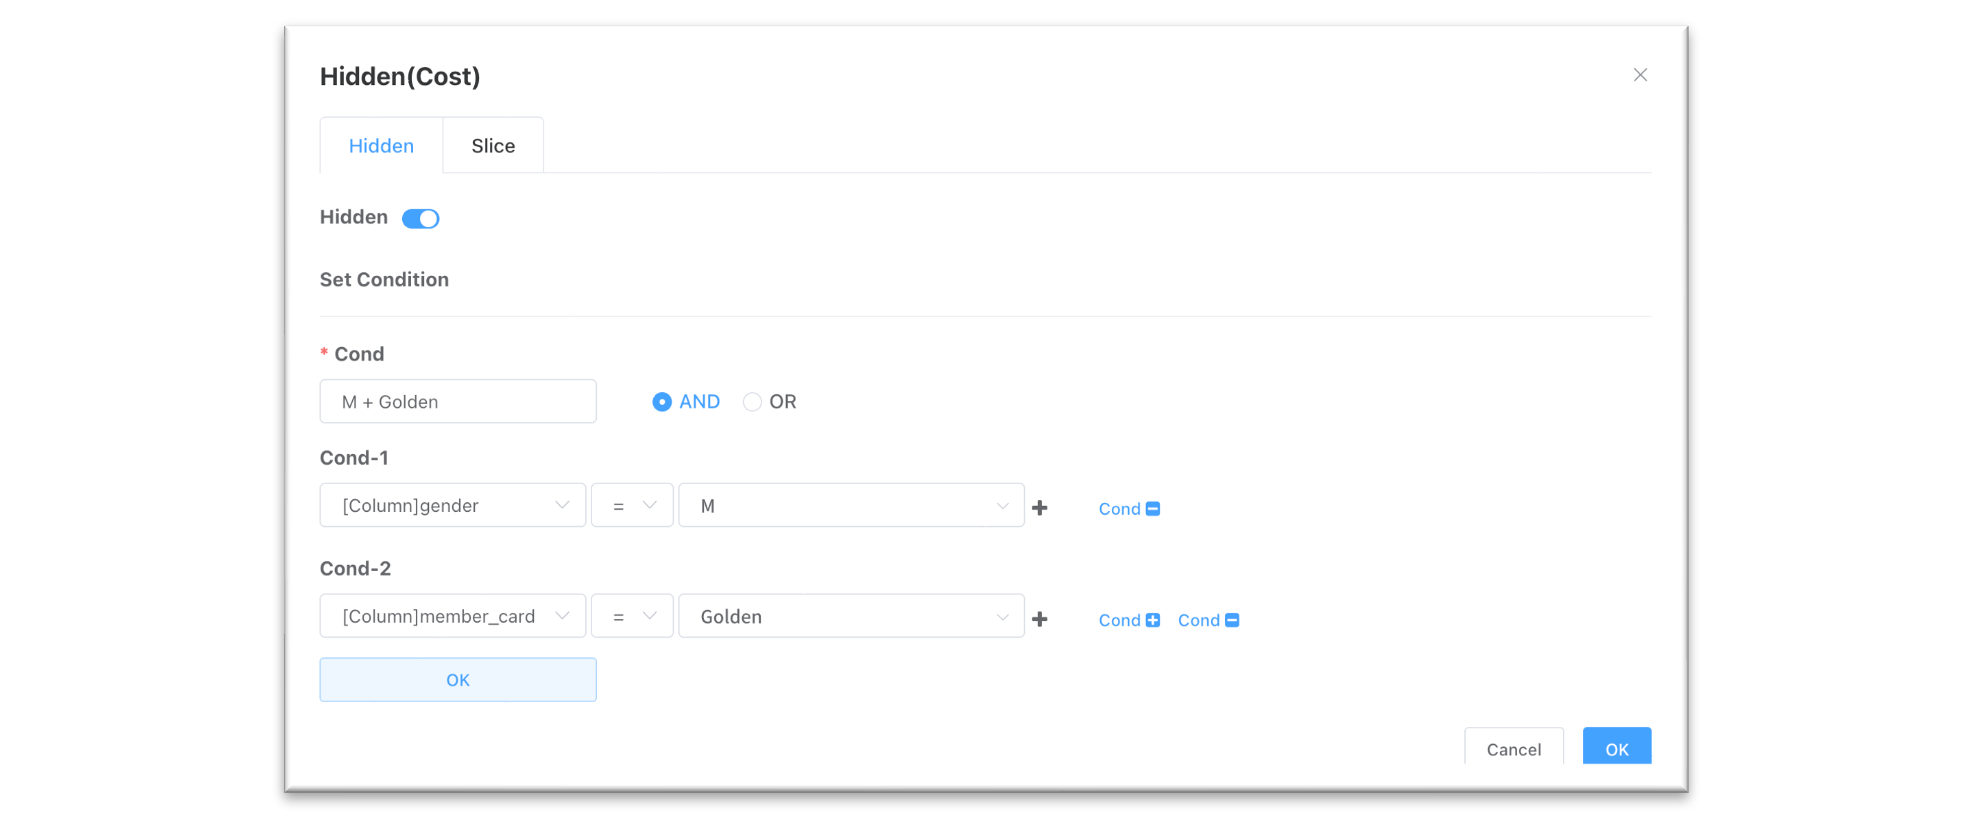
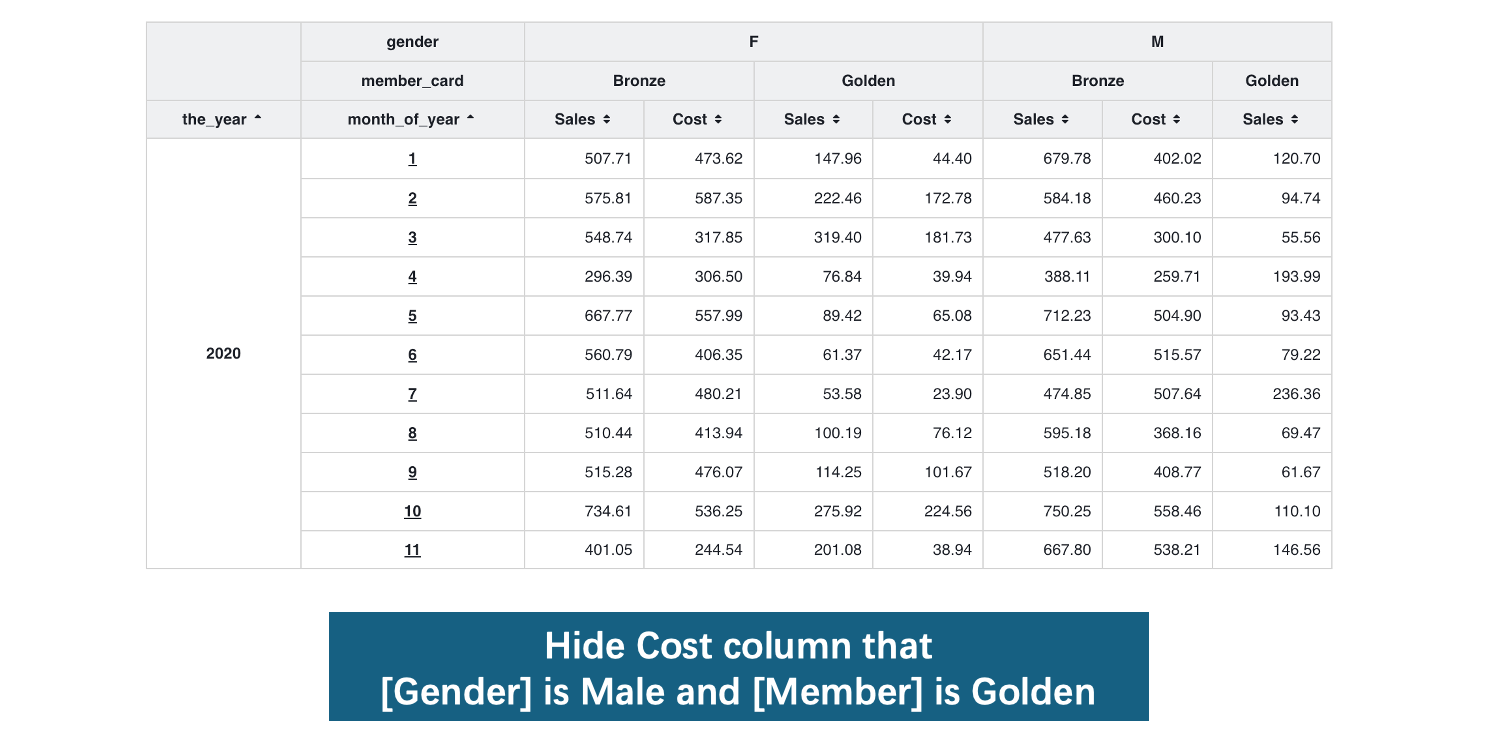
you can configure measure column hiding with dimension conditions.
Value Type (View Calculation)
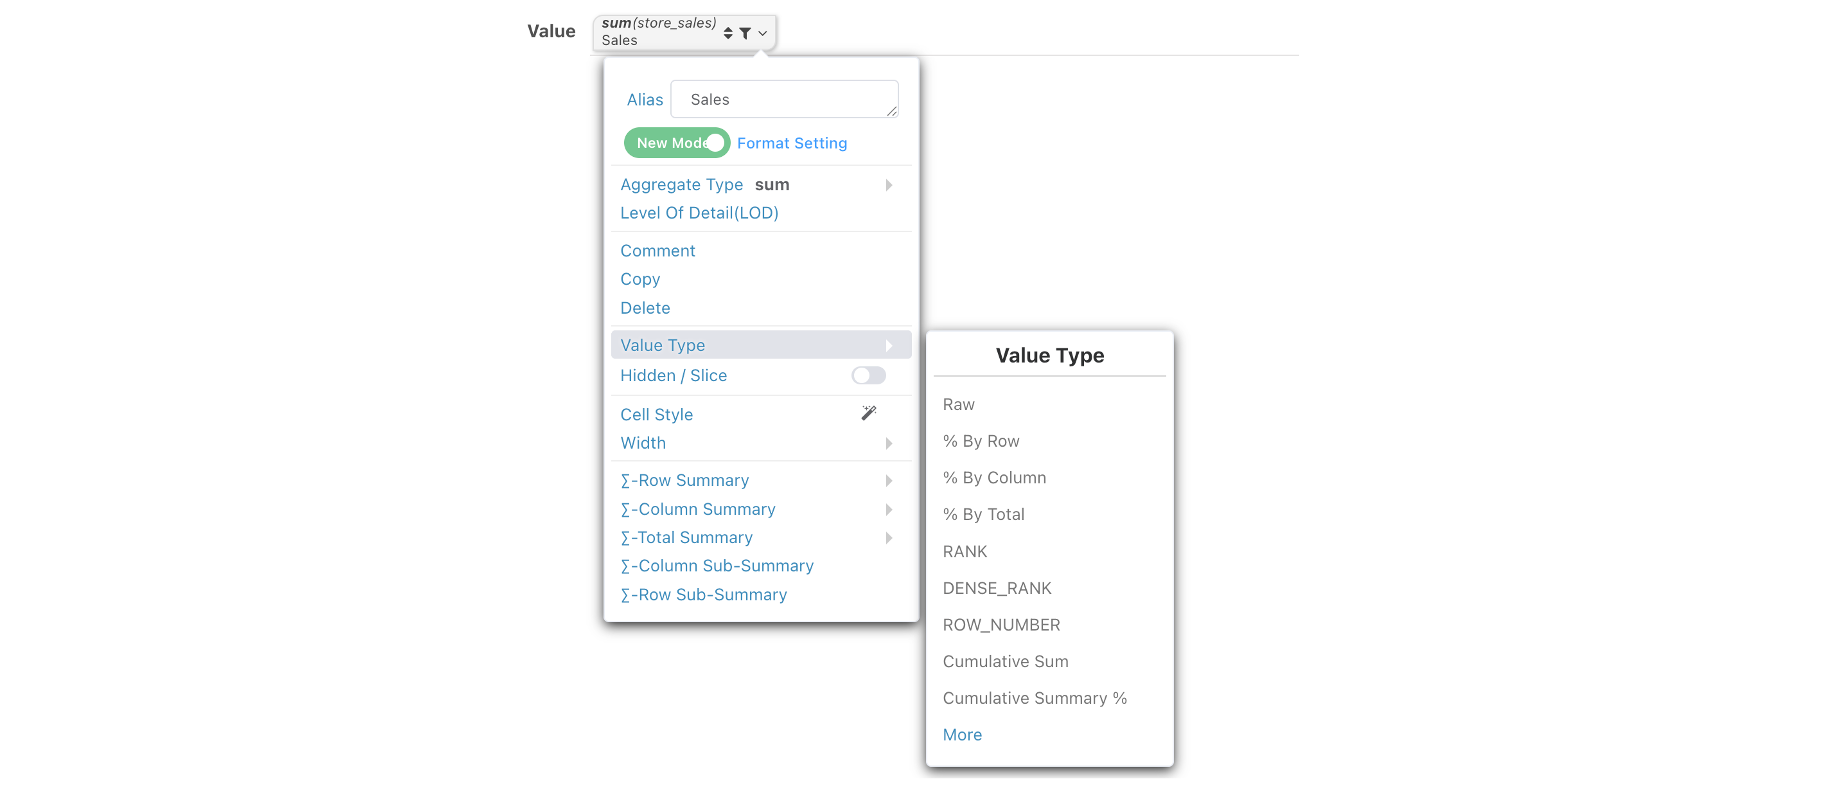
Based on the original values, simply setting the Value Type for a measure will convert the original numbers into percentages, YoY, MoM, etc.
Column Percentage
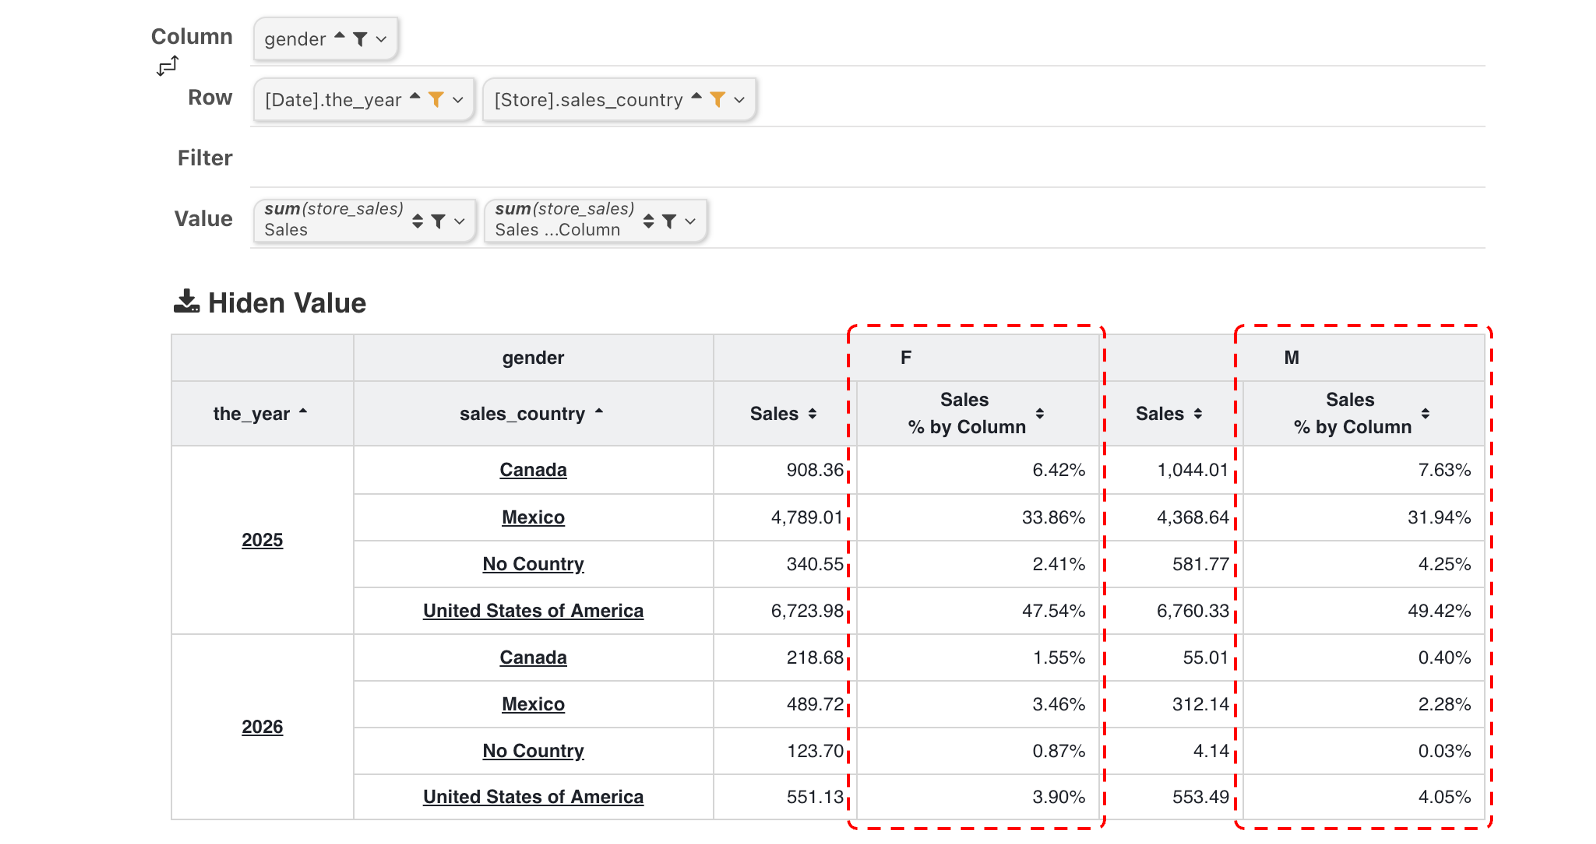
Original measure columns can be reused. For display effect, the following image uses the Cost measure twice.
The first column shows the original value, the second column converts to column percentage.
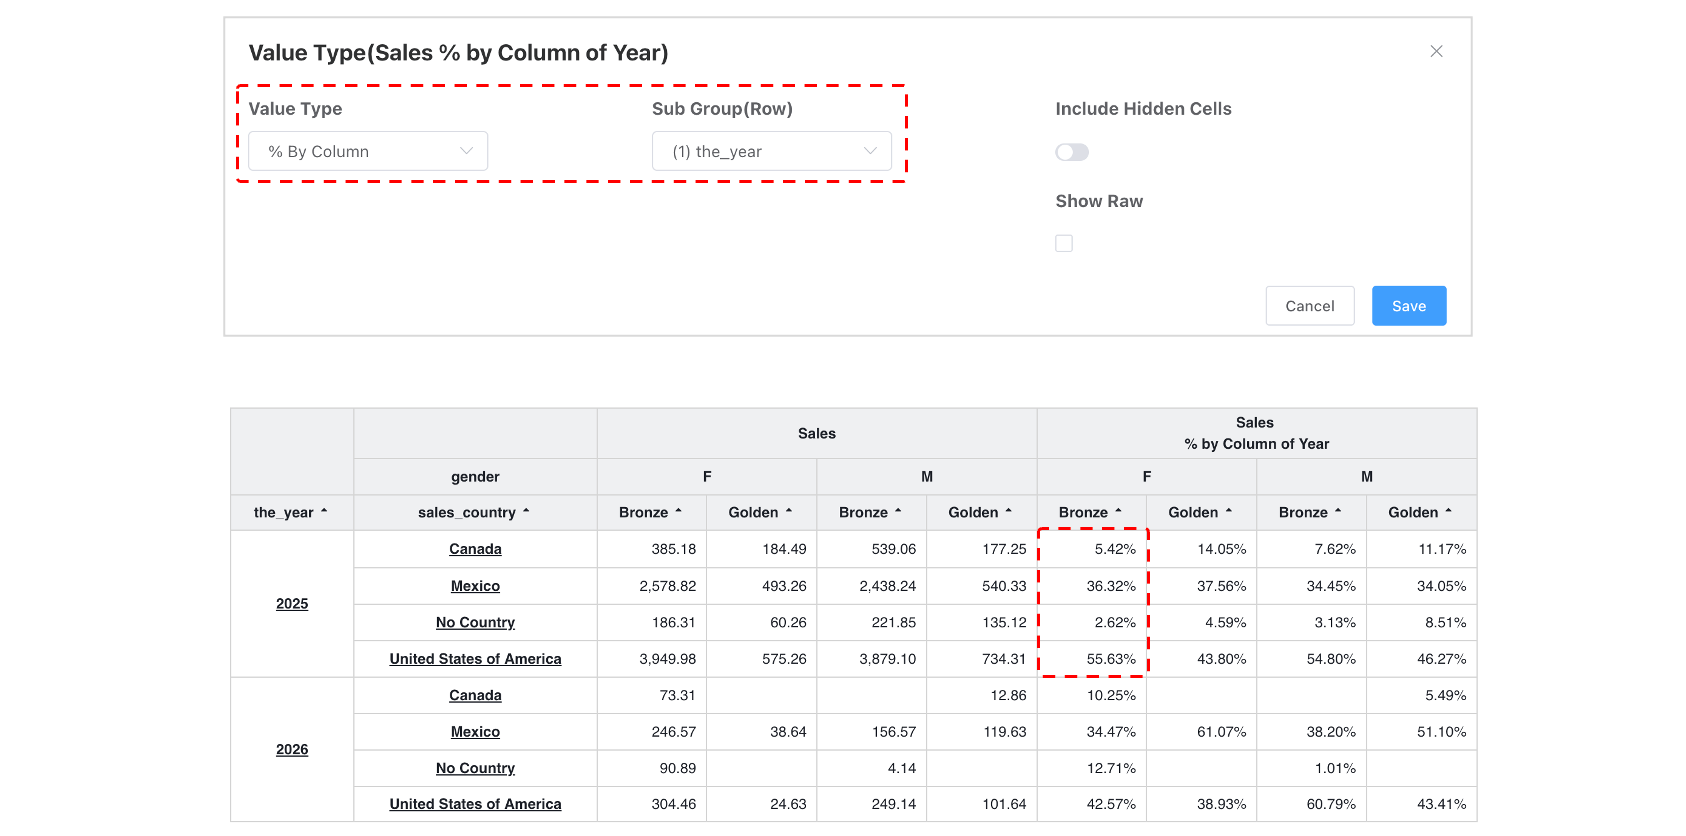
Column Percent with Sub-group
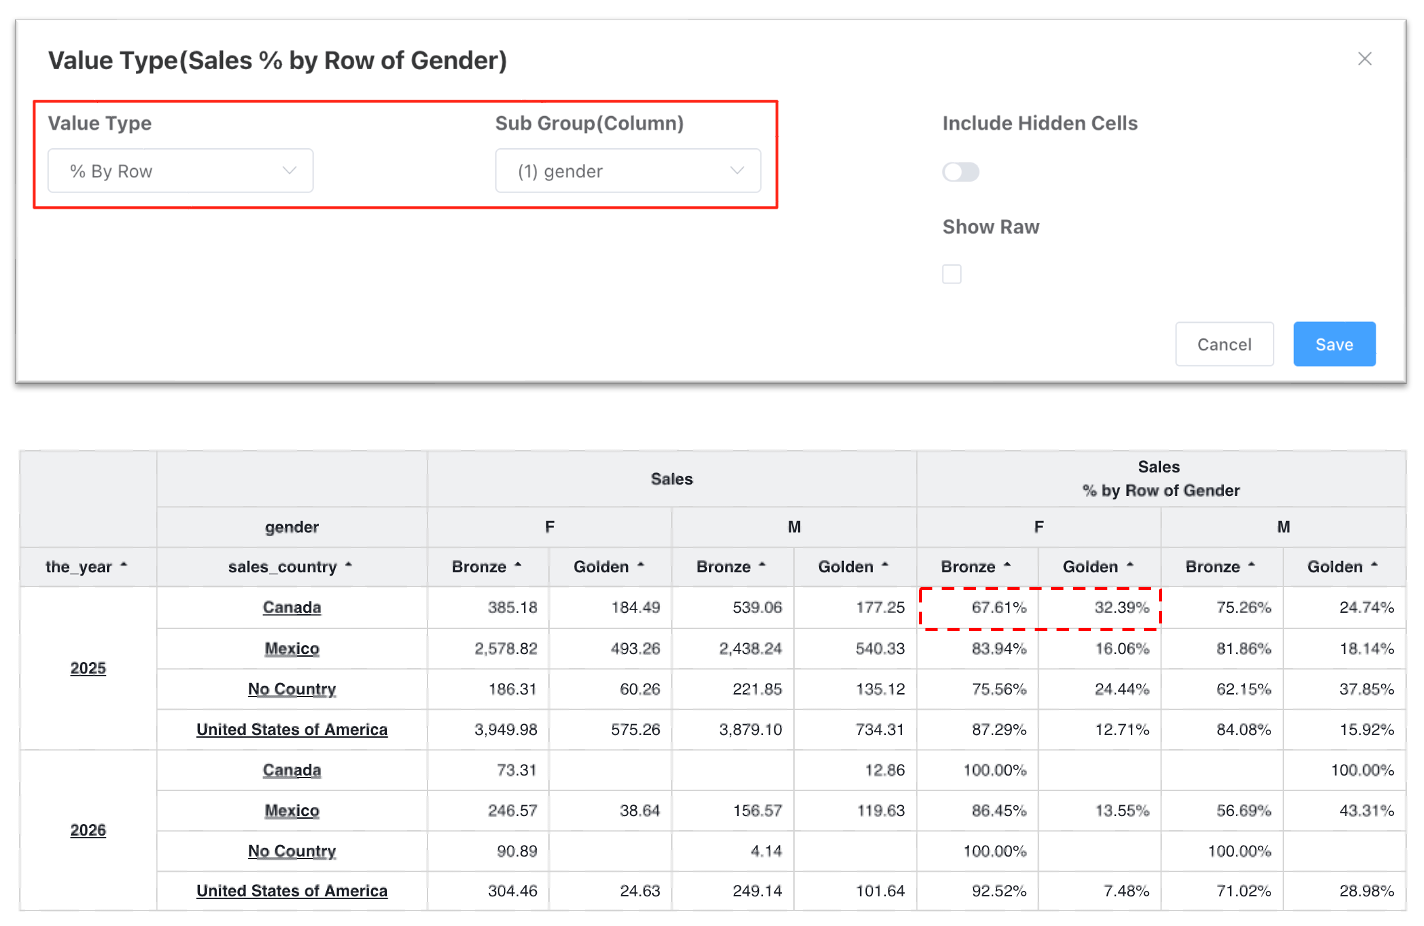
Row Percentage
For a given metric, expand horizontally with column dimensions, then compute percentage values row-wise.
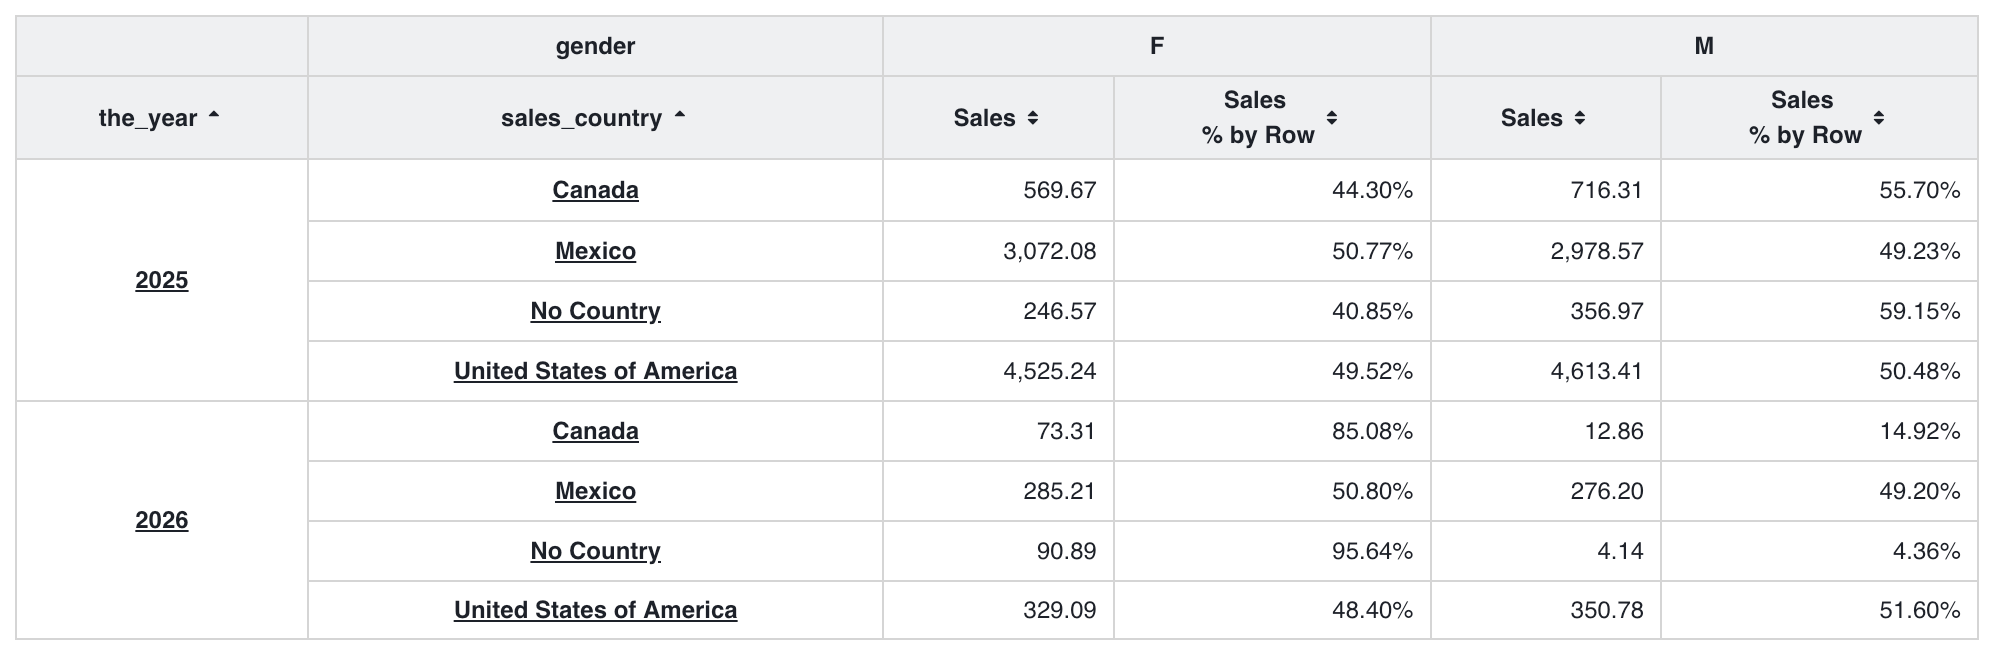
Row Percentage with Sub-group
Total Percentage
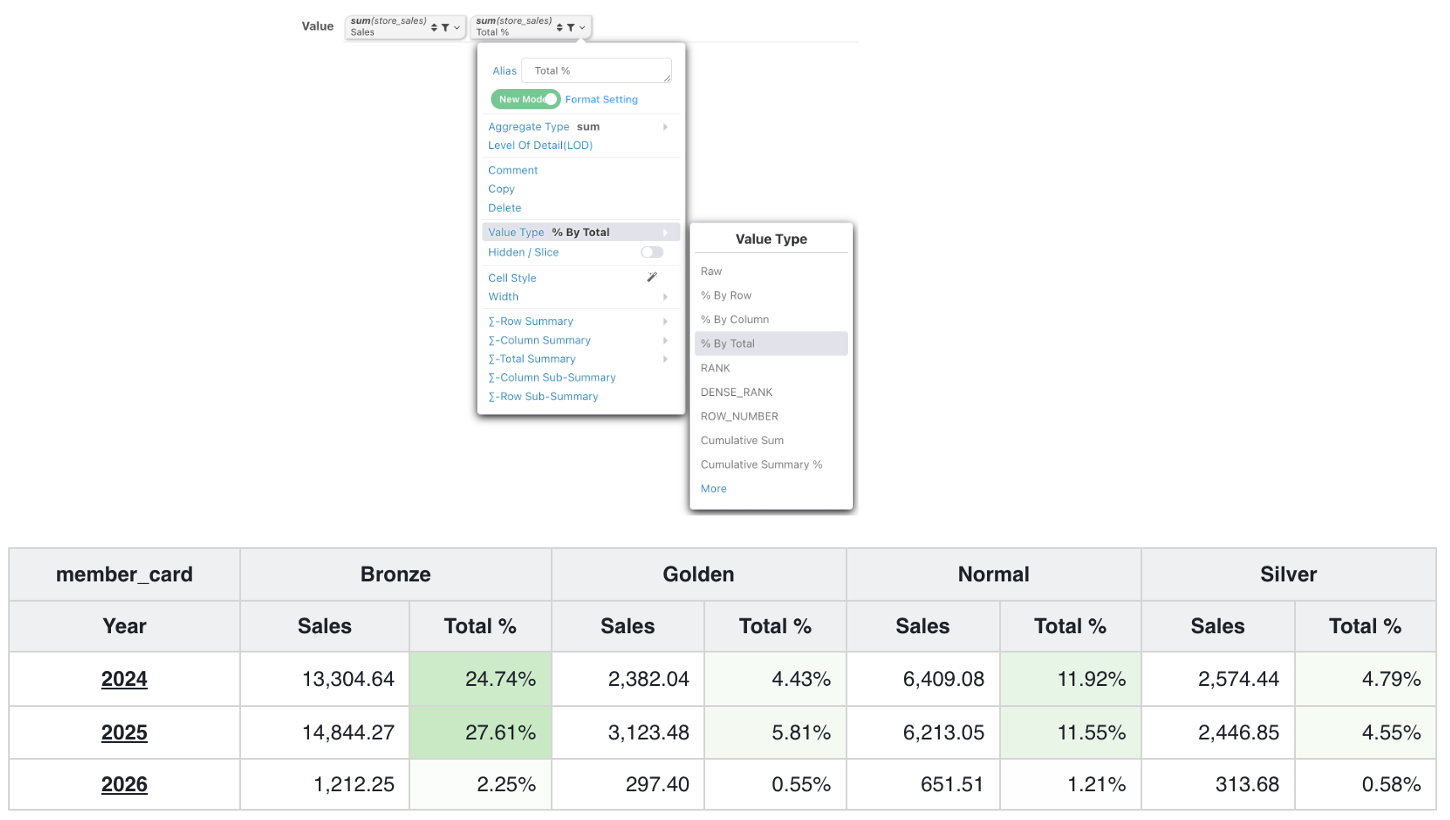
For a given metric, expand horizontally with column dimensions, then compute percentage values against the overall total of all data.
Rank / Dense Rank / Row Number
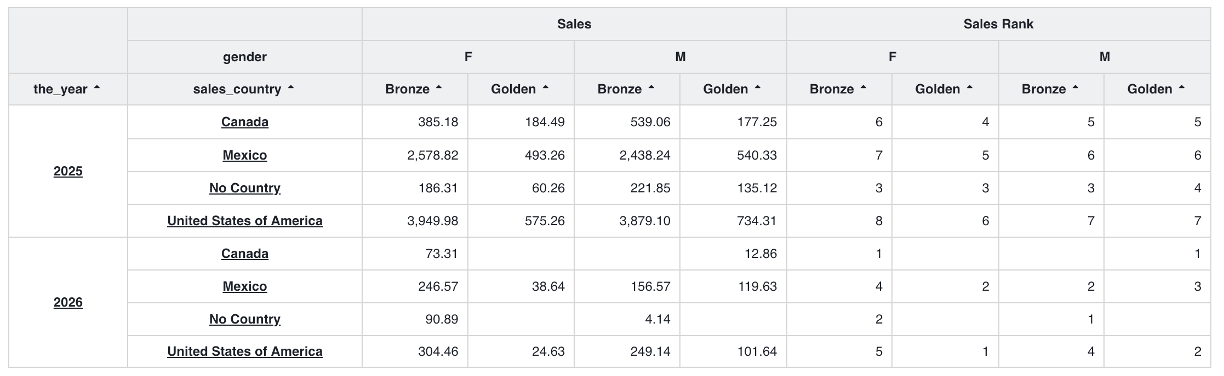
Values without data do not participate in calculation.
Cumulative (Percentage)
Cumulative
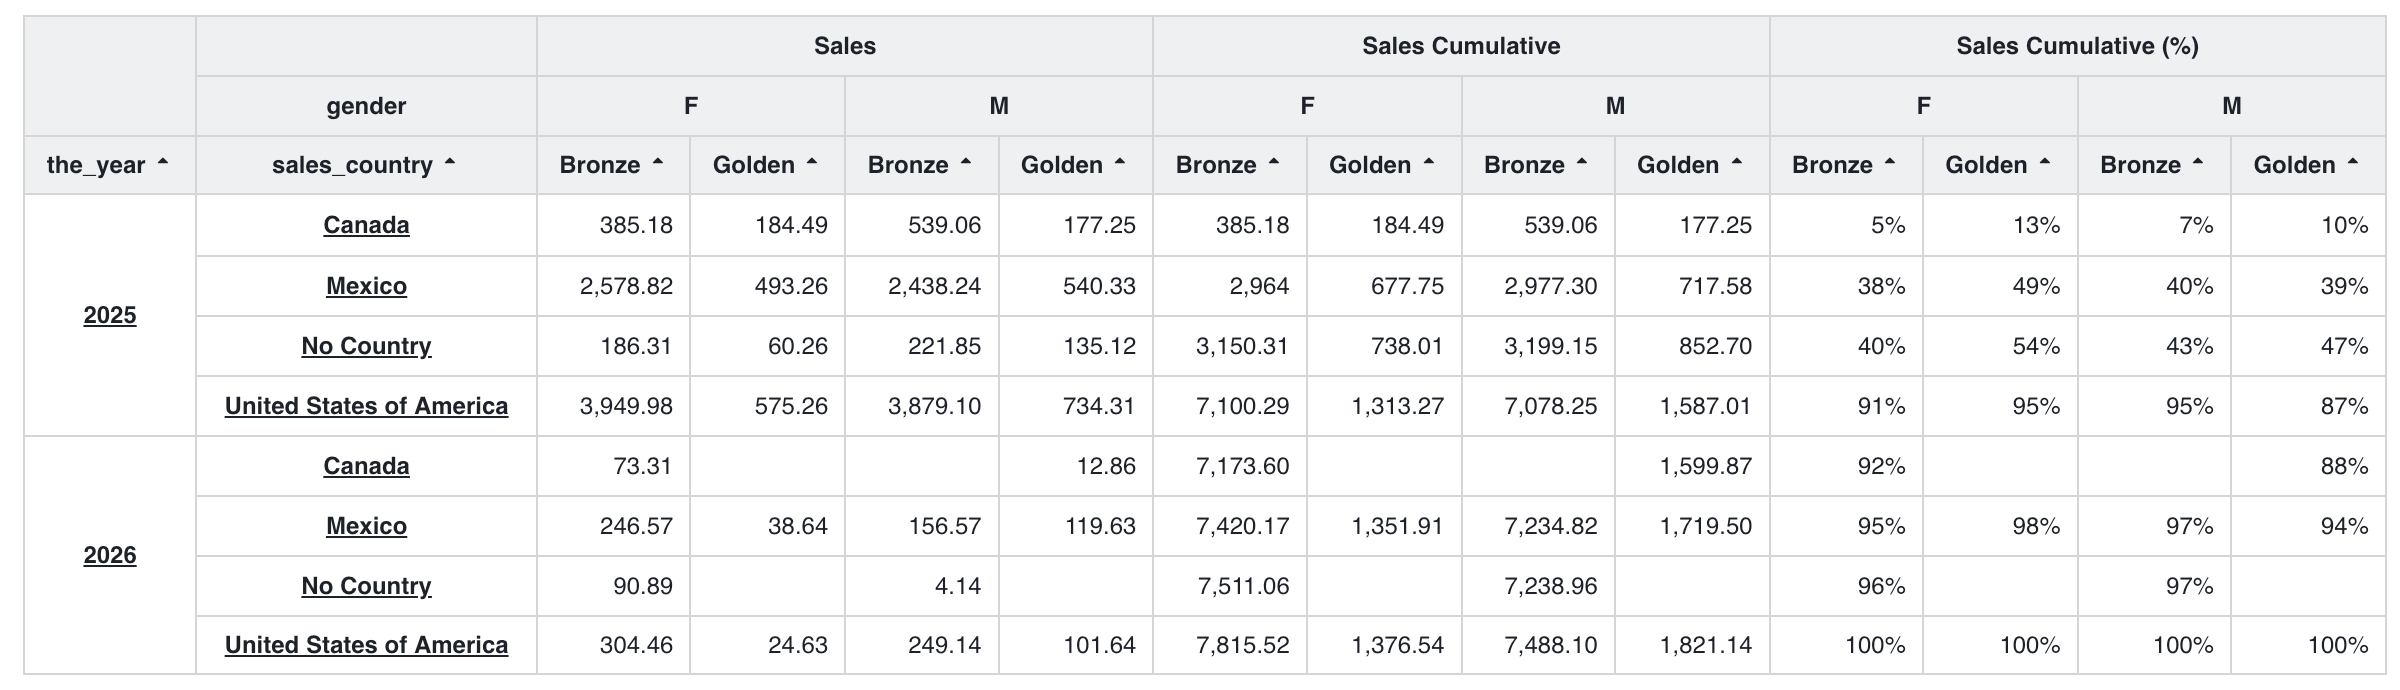
For a specified metric, expand horizontally via multiple column dimensions, then calculate running cumulative values along the row dimension hierarchy. The value of each row equals the sum of all metric values from the first row up to the current row within the same grouping scope.
Cumulative Percentage
Derived from the calculated cumulative metric values, this function computes progressive percentages against the global grand total of the metric. Each value shows the share of the running accumulated sum relative to the full dataset total; the last row of every metric column will display 100%.
Advanced Statistics
Month-over-Month (MoM) and Year-over-Year (YoY) statistics are advanced operations, with slightly more complex interaction.
Lag (Month On Month)
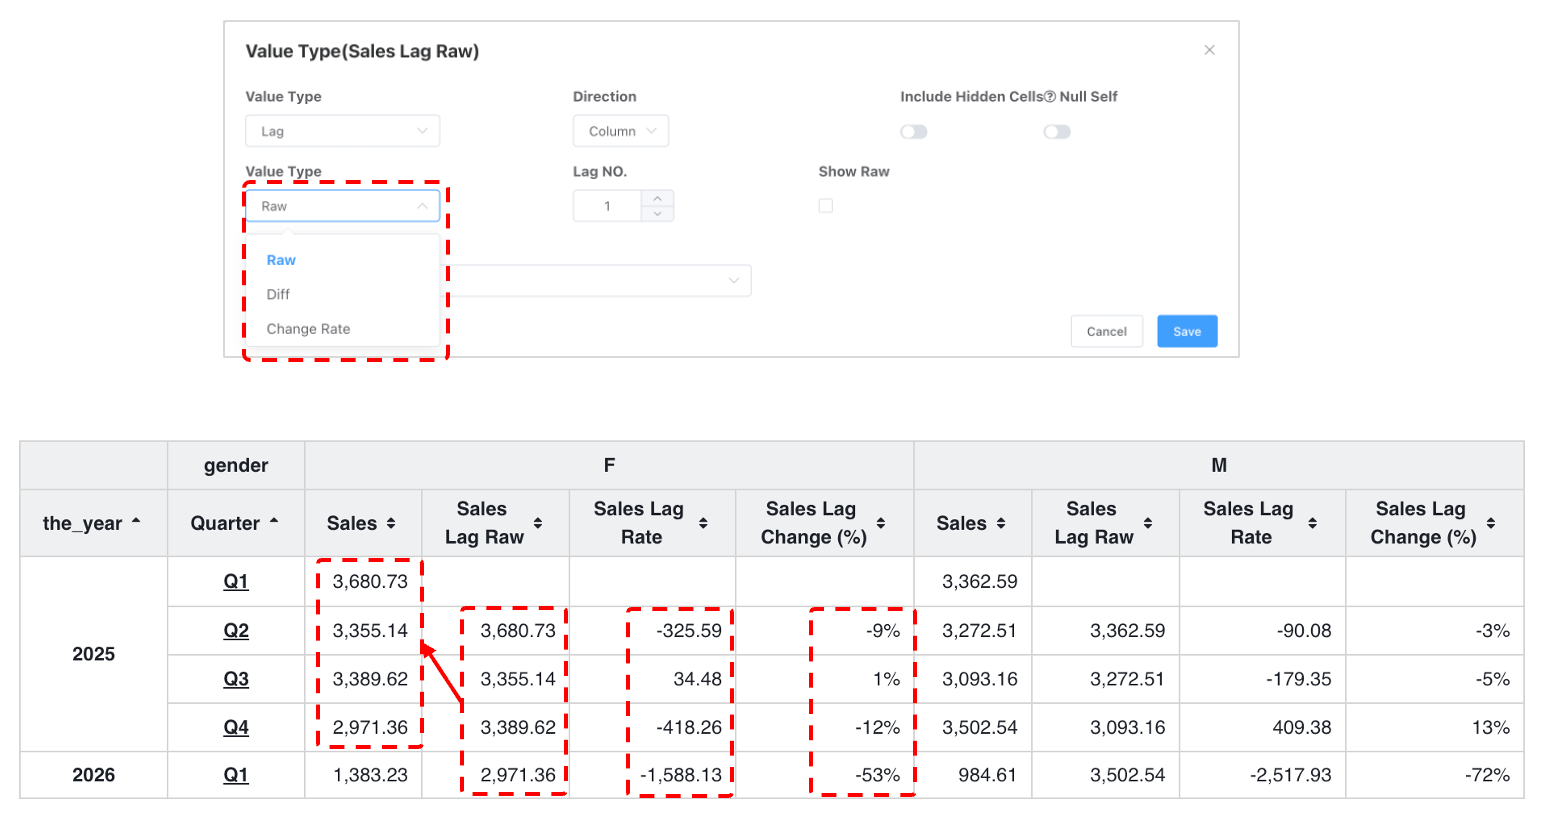
Click "More Operations" in the value type menu, a pop-up for advanced operations appears. Select Lag Comparison for Value Type.
- First, show the lag value type as the original value (leave
Value Typeblank). From the image below, you can see the originalSalescolumn is offset by 1 row in the column relative to the original value (lag amount can be adjusted, positive or negative). - Calculate the difference amount for MoM. Change
Value Typeto Difference. - Calculate the change rate. Change
Value Typeto Change Rate. - Column Lag/MoM supports specifying matching columns. After specifying a comparison column, the comparison column must be equal.
YoY (Year On Year)
YoY generally compares the nth month of this year with the nth month of last year. Design requires a column containing year information.
In the advanced value type operation dialog, select YoY for Value Type. Choose the column containing year information (e.g., year) for Date. The date format should match the actual date format for parsing. Similarly, you can first choose value types: Value, Difference, Change Rate.
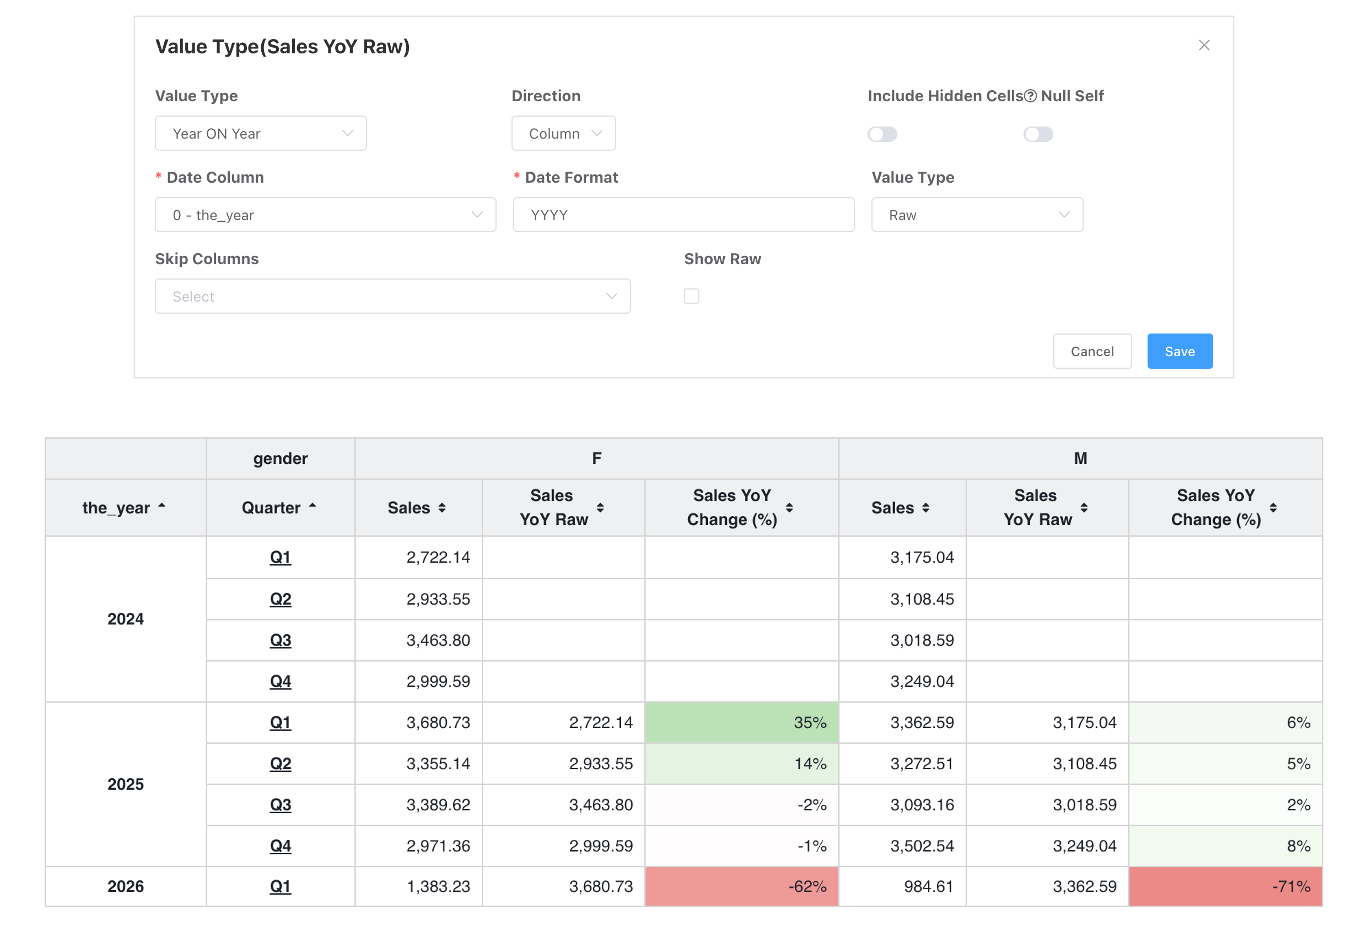
The definition for YoY value search is:
Find the row from the previous year, requiring that other dimension columns besides the year be identical. In this case, the date column obviously interferes with the YoY row search.
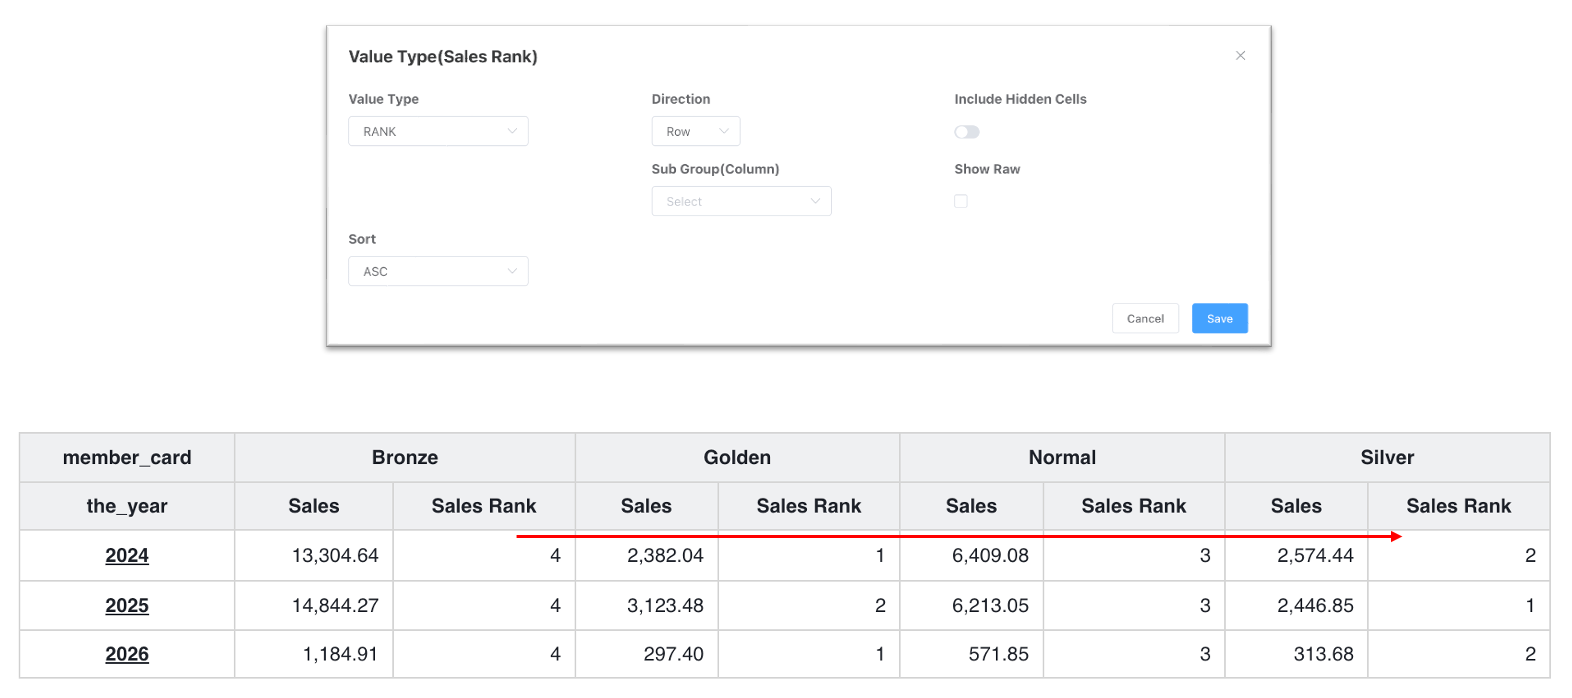
Calculation Direction
Besides the three percentages (Row Percentage, Column Percentage, Total Percentage), other value type changes can set the calculation direction. The default calculation direction is column.
Other Configurations
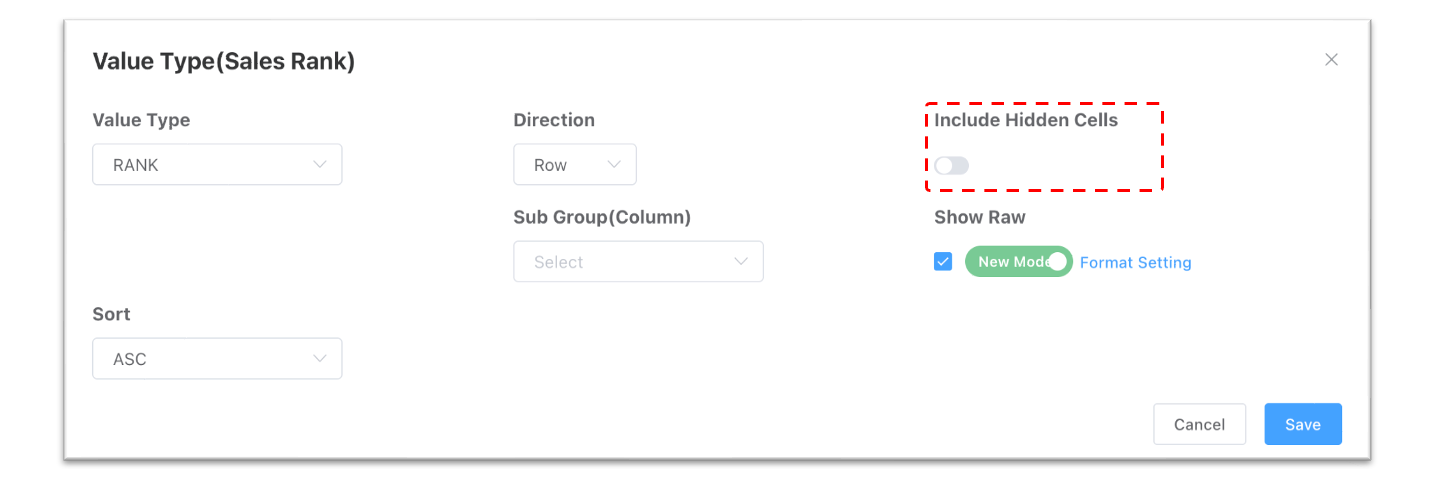
Include Hidden
Considering previous dimension hide settings, hidden values do not participate in calculation by default. If hidden cells need to participate in operations, enable the Include Hidden configuration.
Display Original Value
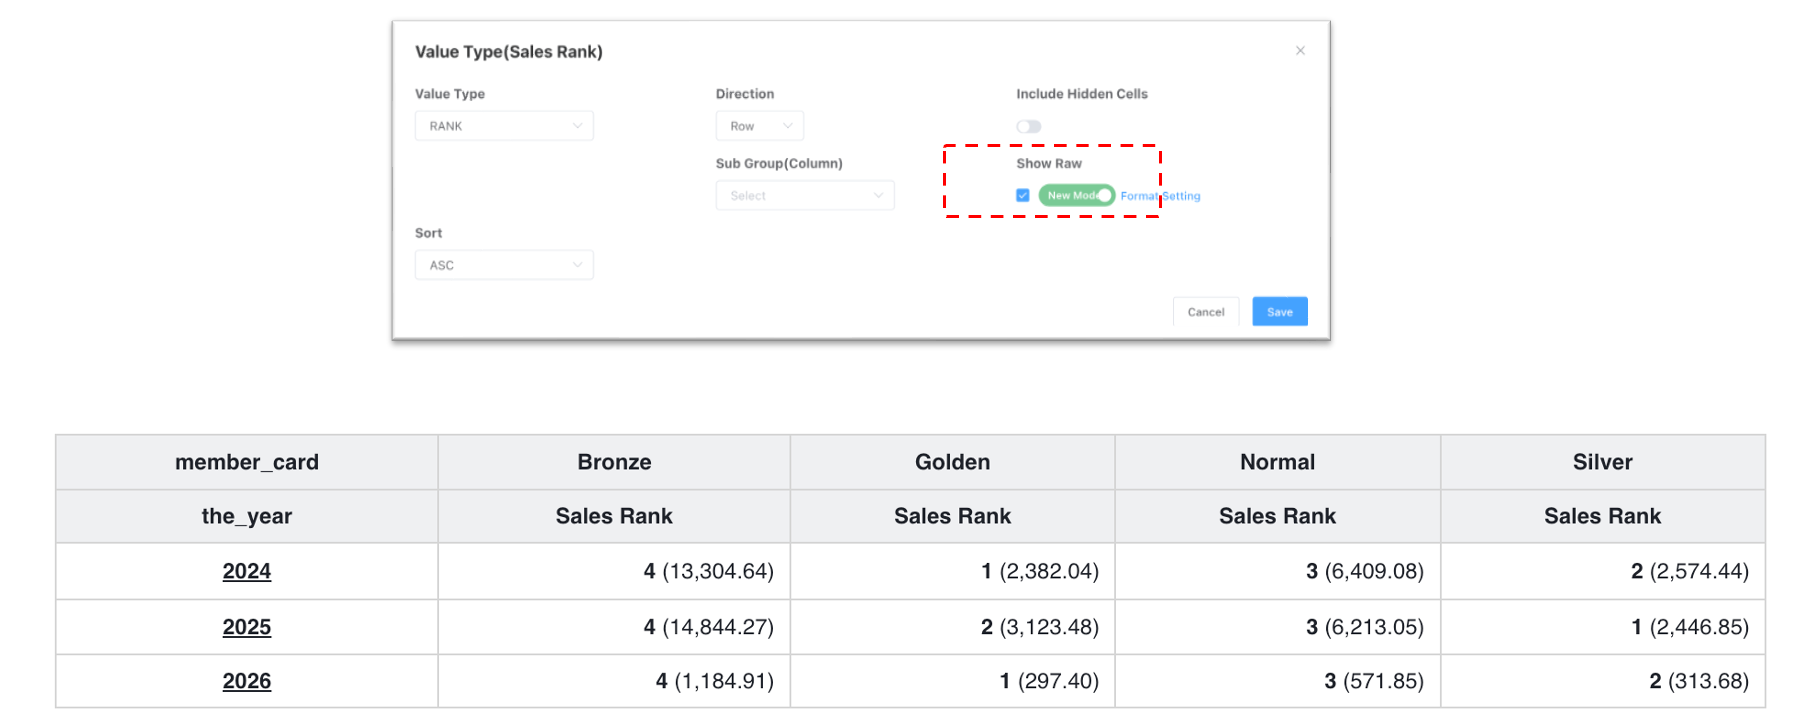
After value type change, if you need to display the original value, enable the Show Raw configuration. Additionally, you can configure the original value formatting.
Example
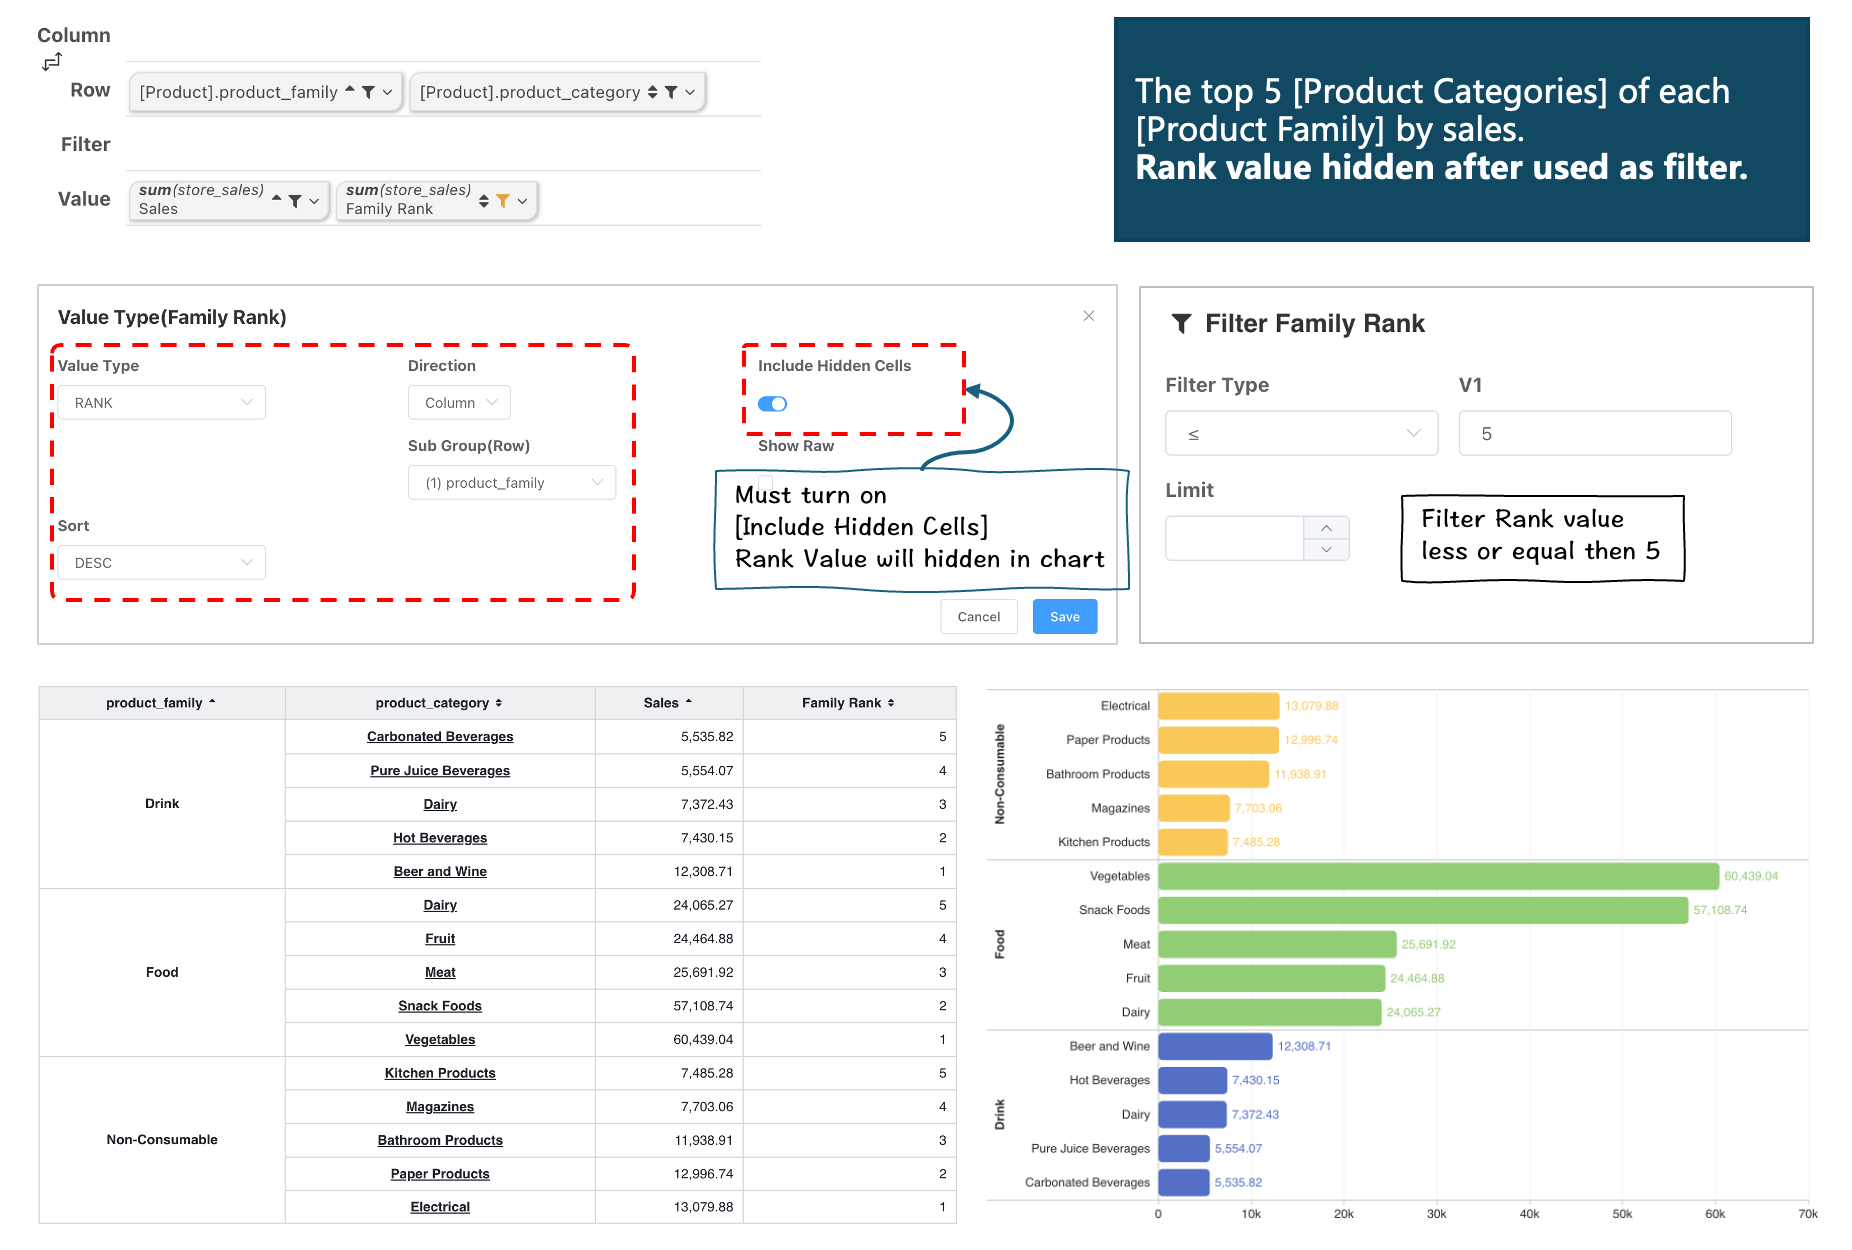
Find the top 5 [Product Category] of each [Product Family] by sales.
- Row Dimensions: [Product Family] + [Product Category]
- Measures:
- Sales (Original Value)
- Sales (Rank)
- Set Value Type to
RankinColumndirection + [Product Family] asSub Group+ Sort Descending. - Include hidden cells, because rank metric will be hidden in view
- Set Value Filter of [Family Rank] column to
<= 5. - Enable measure hiding.
- Set Value Type to
Value Type Expression
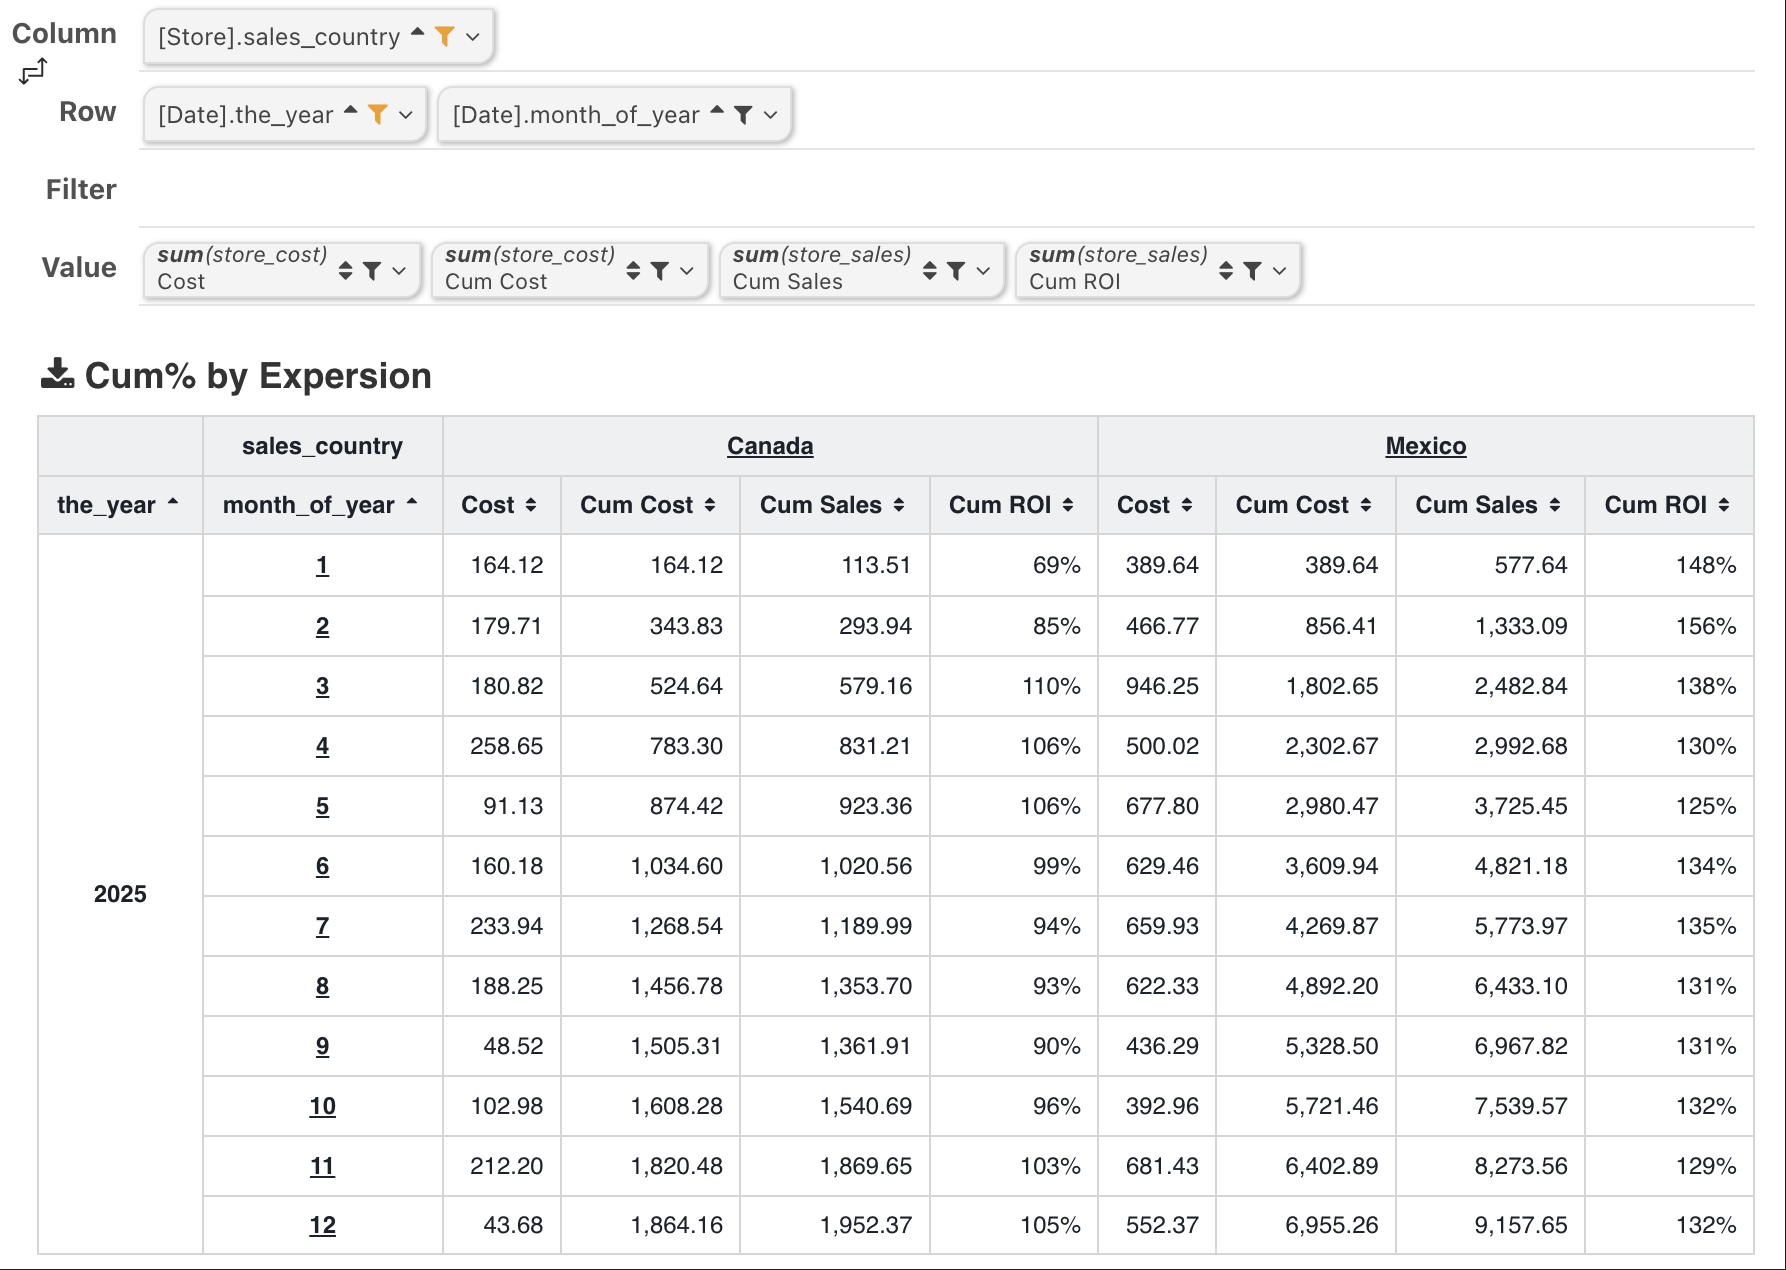
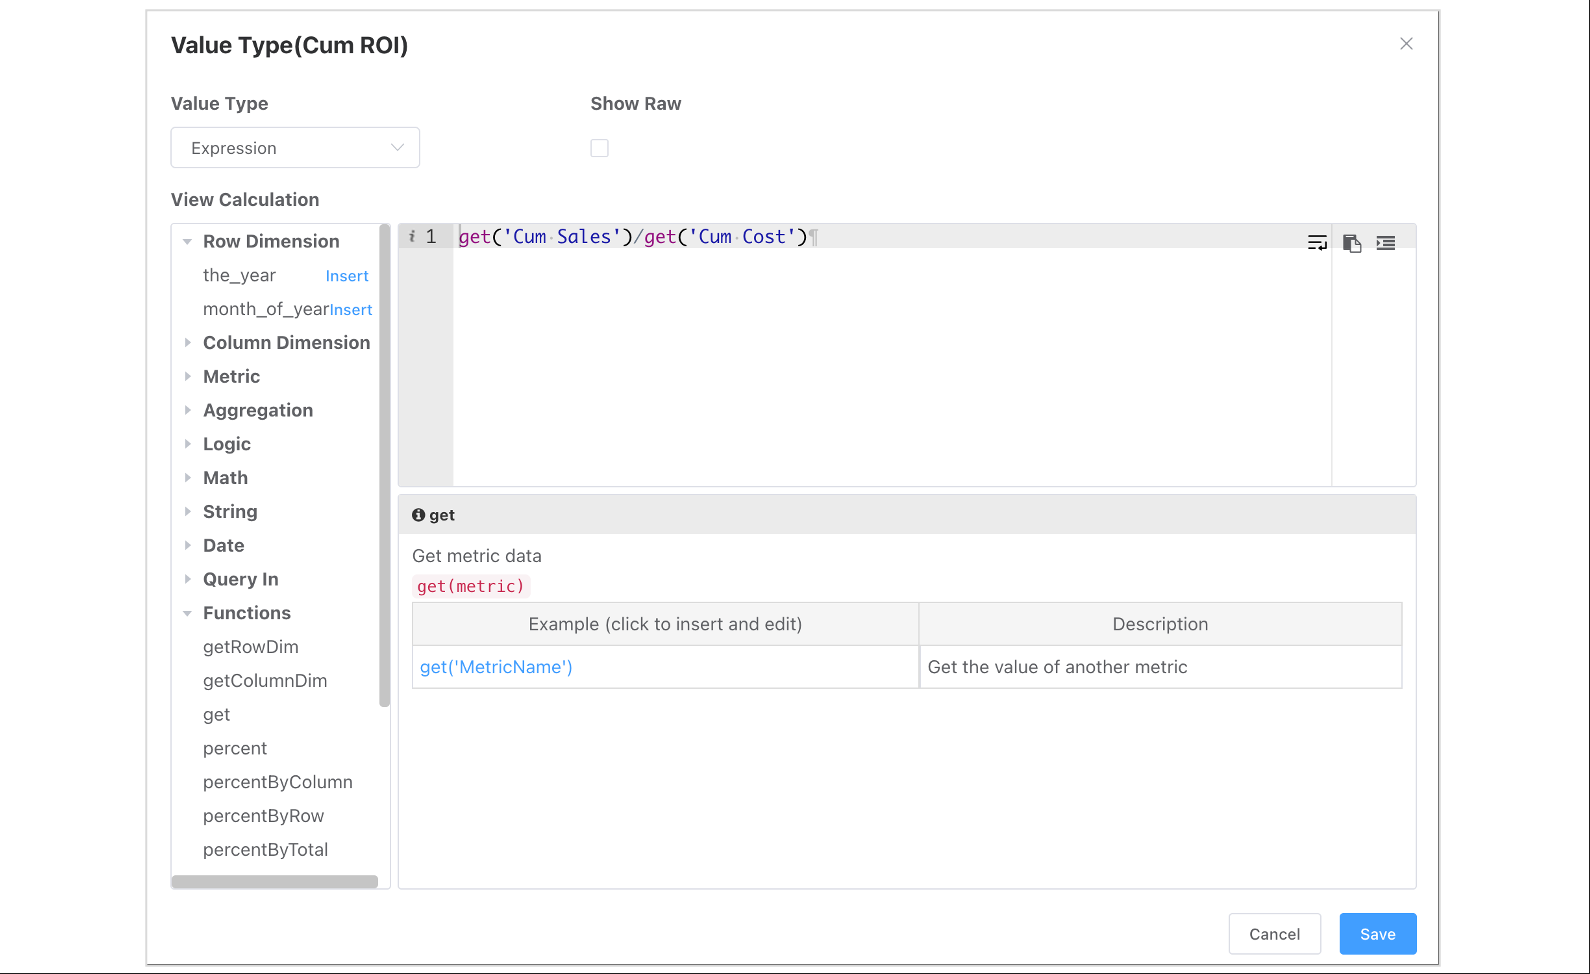
Value type expressions can achieve all the value changes mentioned above but are commonly used for dependency calculations, logical judgments, or outputting text values.
Note
The measure columns that the expression depends on must exist originally in the table. Even if they don't need show in the view. They can be set to hidden.
Logical Expression
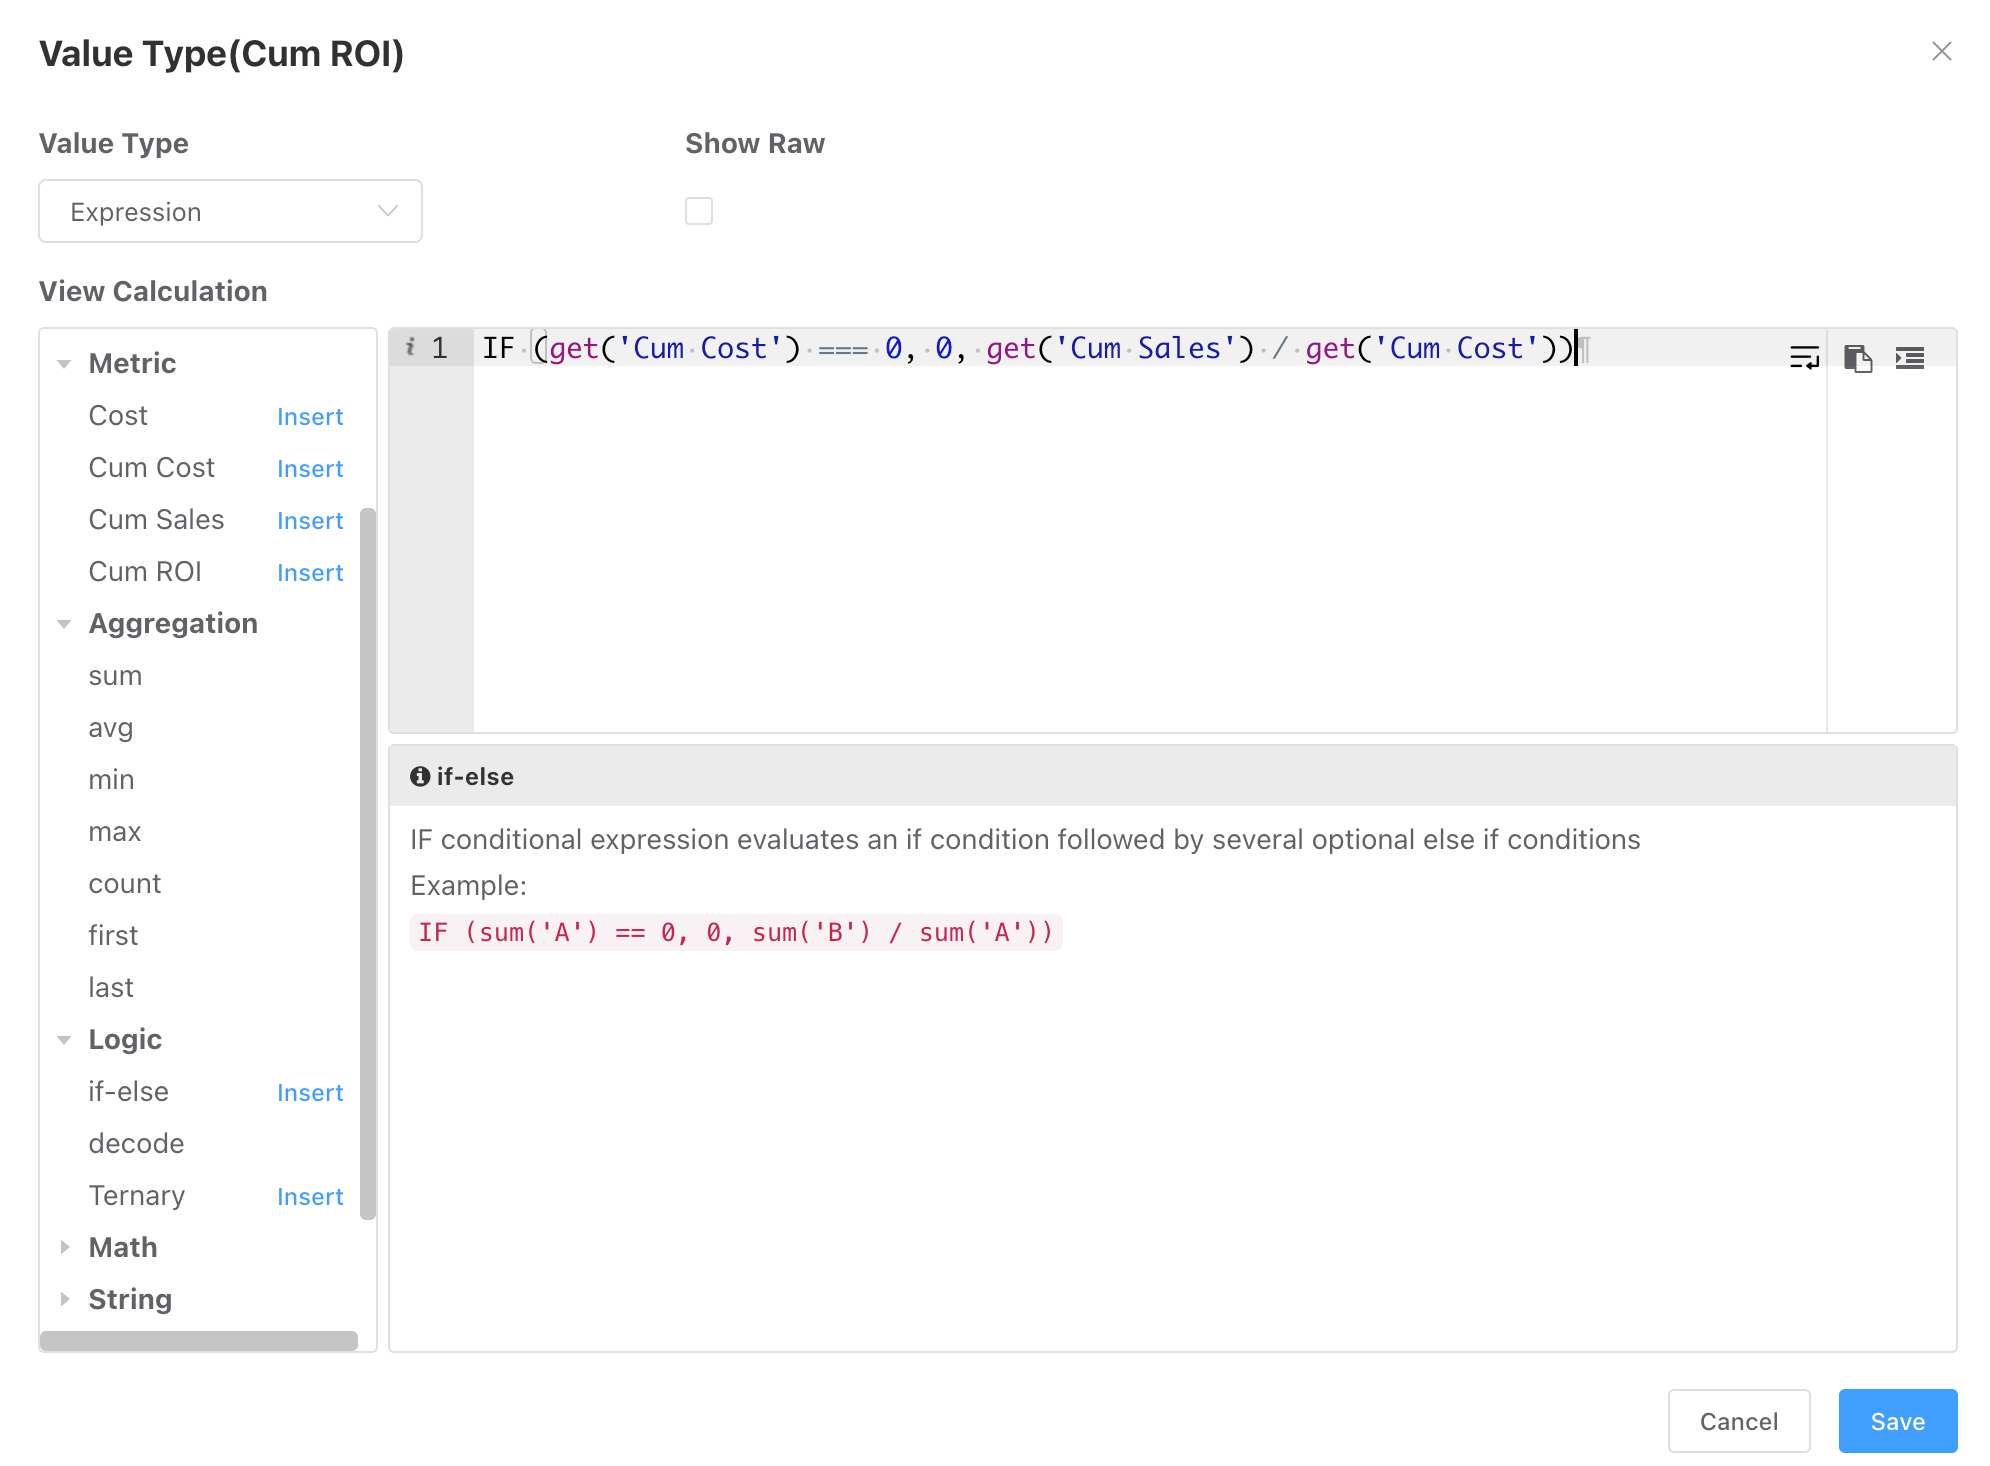
Dataset Expression vs. Value Type Expression
- Calculation Granularity
- Dataset expressions only support aggregate calculations within their own granularity.
- Value type expressions can perform secondary calculations on top of value type changes (any granularity).
- Original Value Dependency
- Dataset expressions do not require original aggregates to be configured in advance.
- Value type expressions require the aggregates they depend on to exist in the table.
Summary (Total)
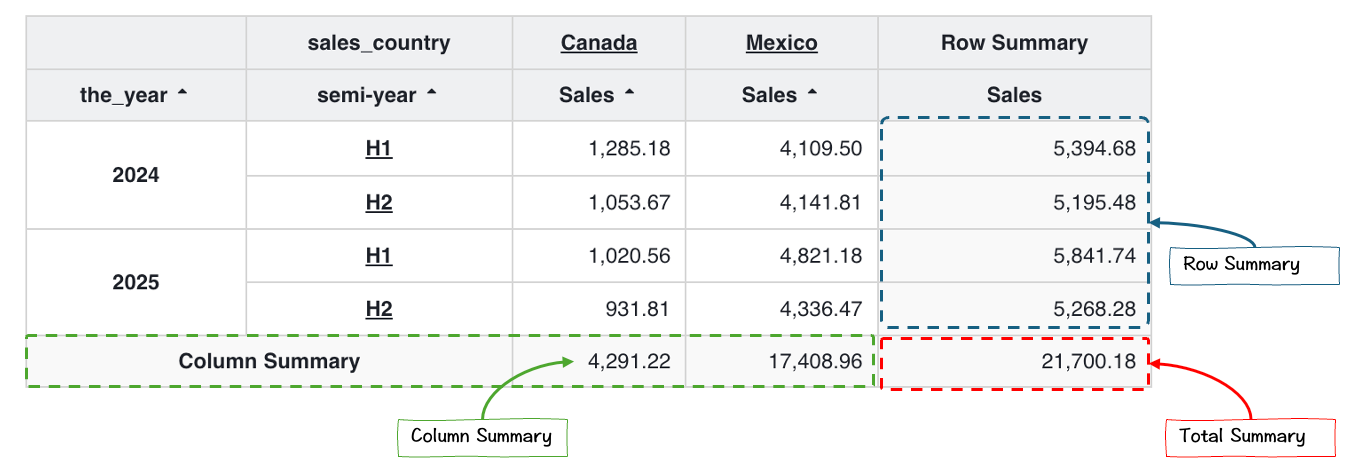
Table summary function can perform statistics on rows/columns: sum, average, max, min.
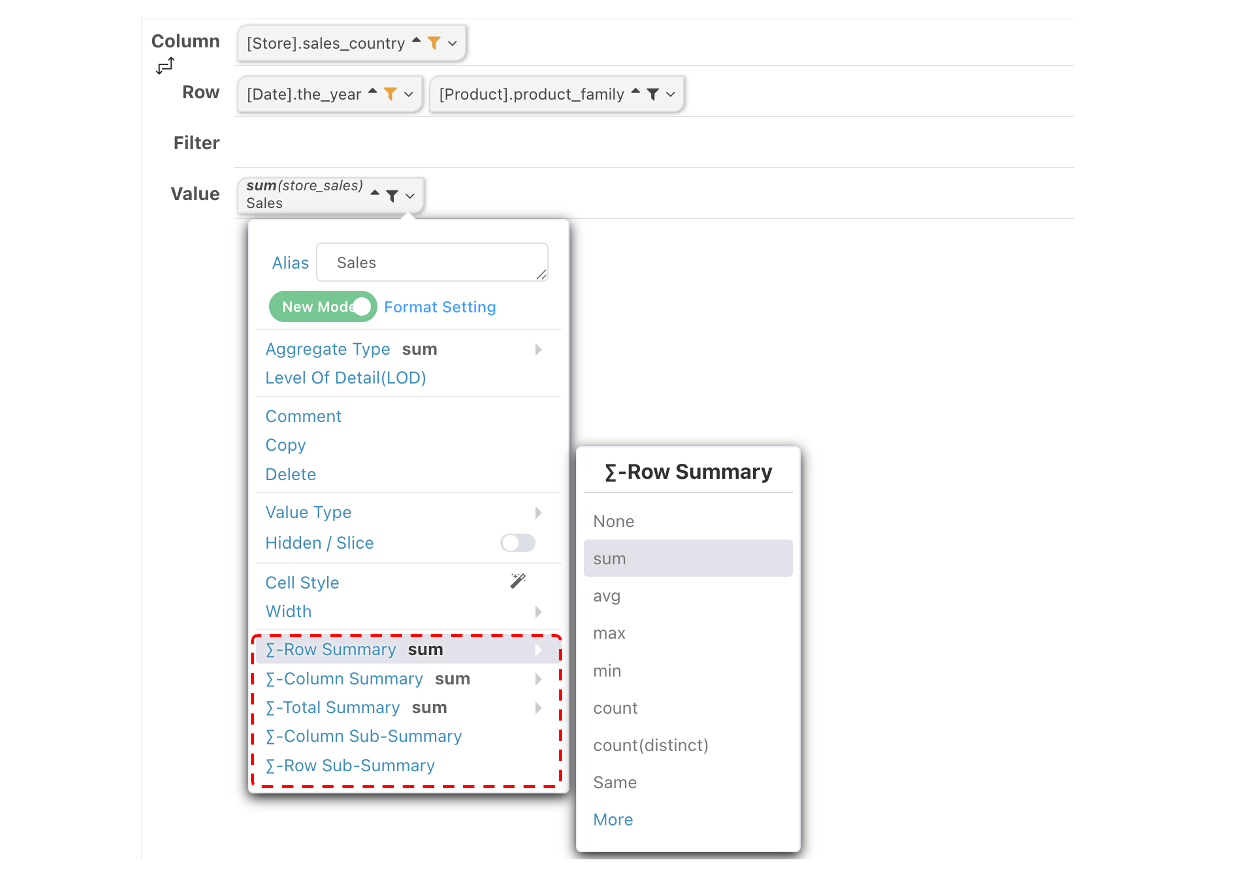
Summary header names can be modified in the chart fine-tuning configuration.
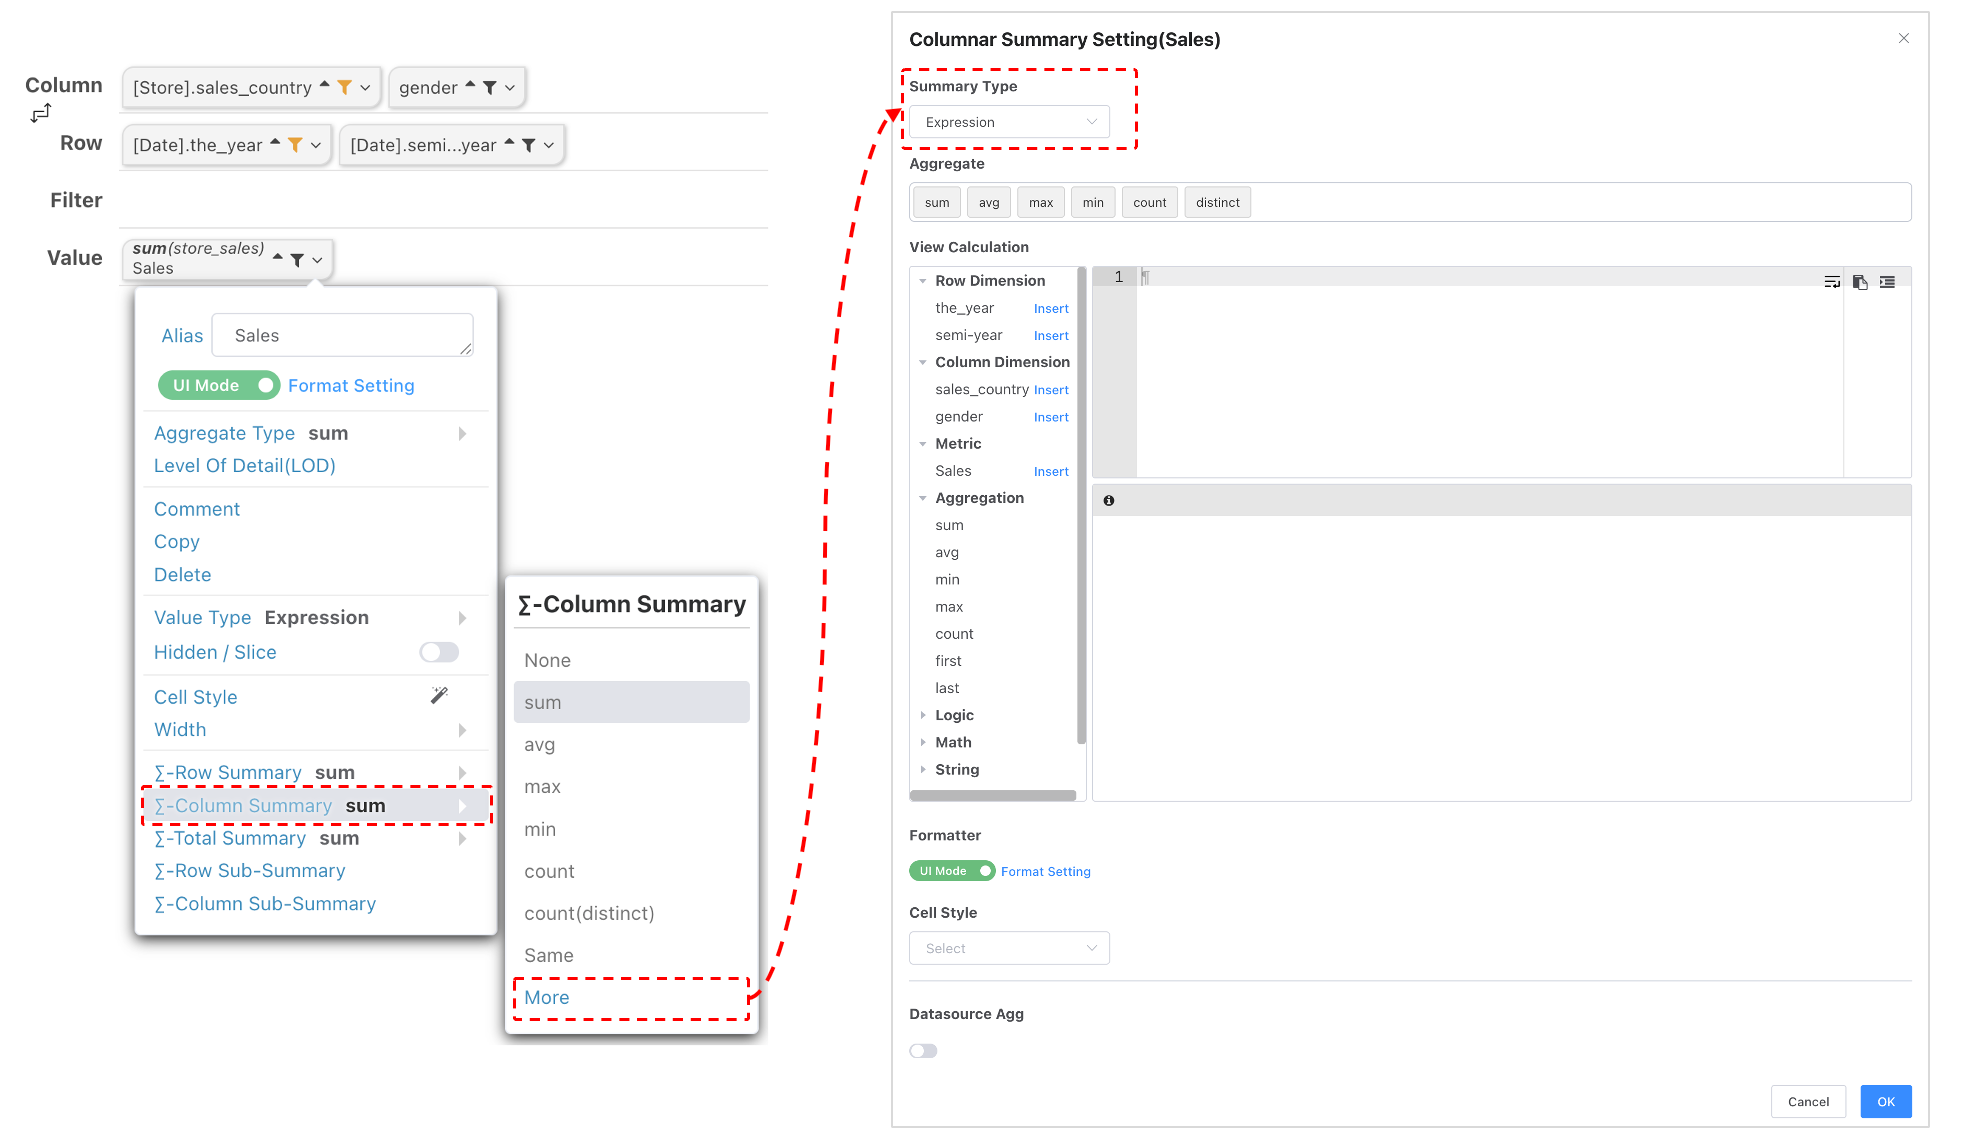
Column Summary Expression
Single aggregation function syntax:
agg('Measure', ['Column Dimension'...]). Can be assisted via theAggregationinput helper.
aggrepresents the aggregation type.- First parameter is the statistical measure name, can be assisted via the
Measureinput, needs to be enclosed in single quotes. Should match the final output measure header in the cross-table. - Second parameter is an array of column dimension header names. Multiple dimensions can be specified to change the aggregation granularity. Can be left empty (or input
null). E.g.,sum('Cost')uses the default granularity. - Column summary does not correspond to any row dimensions, so row dimension granularity cannot be adjusted.
- An empty array
[]for the dimension array represents aggregating data for all row/column dimension levels. - If the dimension array input by the user does not find a corresponding dimension definition in the table, it defaults to matching all dimensions.
- Arithmetic operations can be performed between multiple aggregation functions, e.g.,
sum('Cost', [])/sum('Sales Revenue', ['Country'])- Supports single-line comments
//and multi-line comments/* */.
// comment line
/*
 * Multi lines block comments
 */
sum('Cost', []) / sum('Sales Revenue', ['Country'])- After writing the expression,
Syntax Checkcan be performed.
Note
Syntax check can only detect obvious syntax errors in the expression, such as unsupported aggregation functions or Chinese parentheses where English parentheses are required. It cannot detect if the members of the input dimension array are correct. Runtime exceptions may still occur even after syntax check passes.
Row Summary Expression
Single aggregation function syntax:
agg('Measure', ['Row Dimension'...]). Can be assisted via theAggregationinput helper.
- Row summary expressions are basically the same as column summary expressions. The only difference is column summary does not correspond to any row dimensions, only column dimension granularity cannot be adjusted.
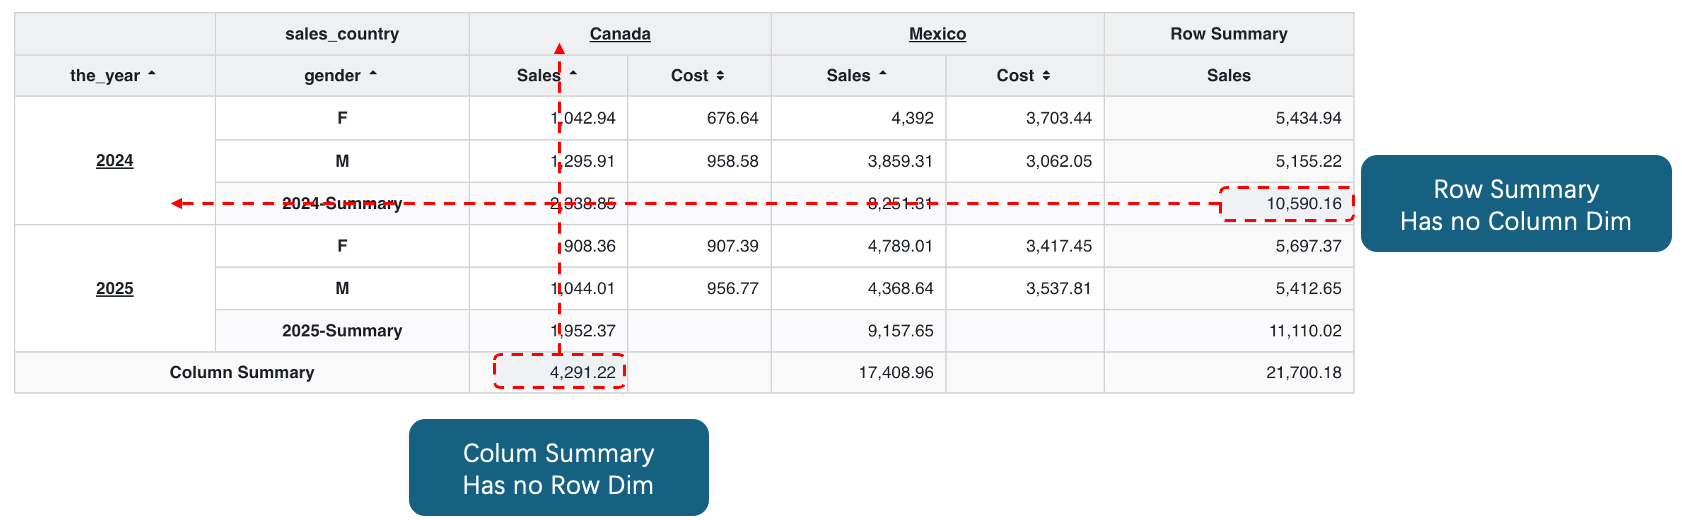
Grand Total
The grand total has neither row nor column dimensions. The grand total only appears when both row and column summaries exist.
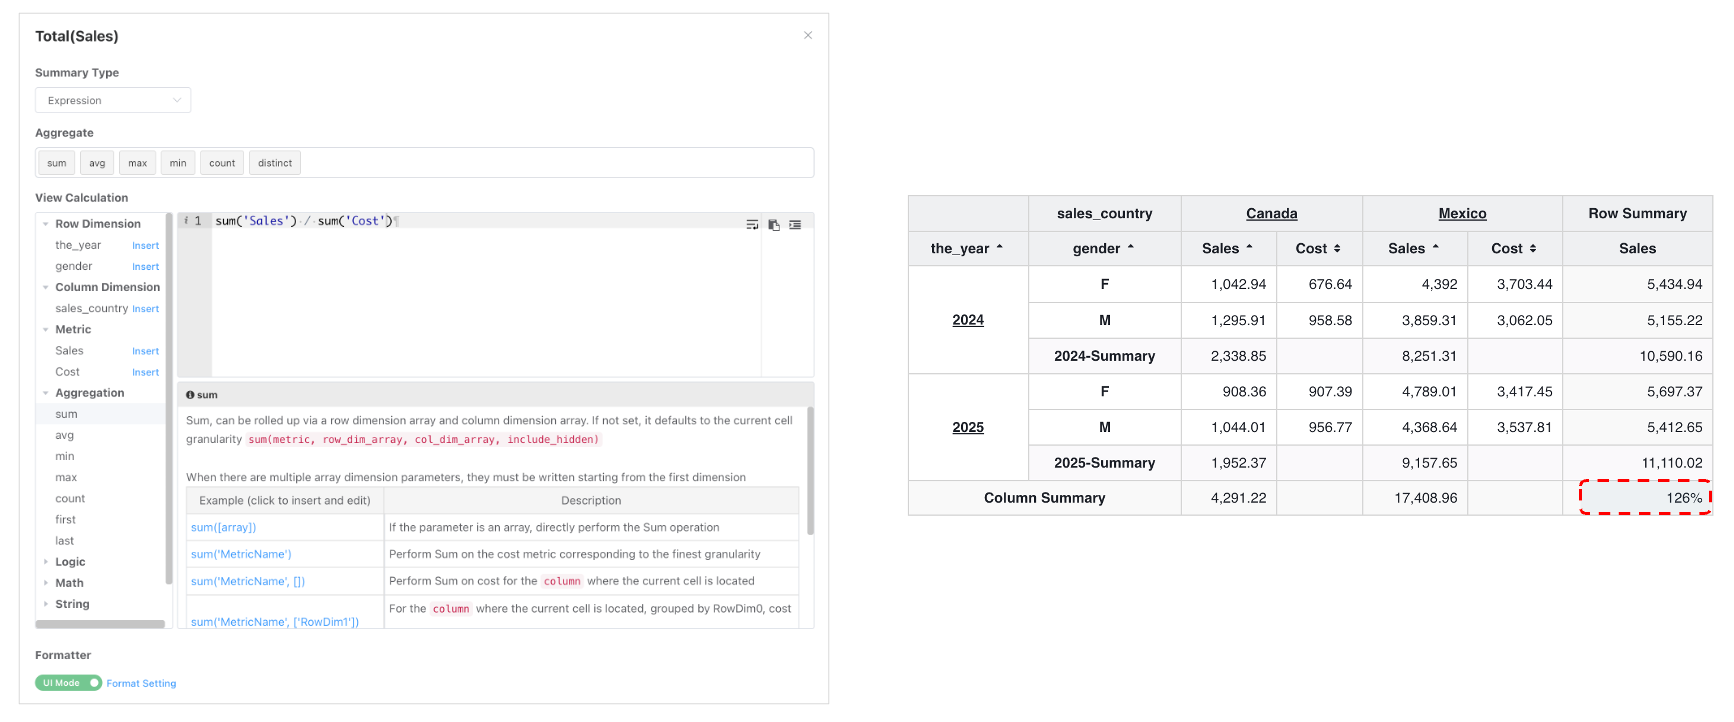
Column Subtotal
Simple Column Subtotal
Click the measure edit button, select Column Subtotal from the dropdown to enter column subtotal design:
- Subtotal Level: Specifies the level(s) for subtotal calculation. Can select multiple.
- Demo below: The
Costmeasure selected subtotal at theYear-Genderlevel; theSales Revenuemeasure selected subtotal at theYearlevel. - After selecting Subtotal Level, the default aggregation granularity is determined. E.g., in the example below, the
Year-Gendersubtotal level corresponds to the granularity: Row DimensionsYear-Gender+ fixed Column DimensionMember Level[Golden].
- Demo below: The
- Calculation Type: Choose simple aggregation or complex aggregation. Simple aggregation only sums the values of the cells corresponding to that level. For example, the gender subtotal in the image below will aggregate all data for that column (
Golden+Cost) under theGenderdimension. - Formatting: Column subtotals can have separate formatting. If not set, the default formatting parameters of the parent value are used.
- Aggregation Parameters: Options sum/min/max/avg.
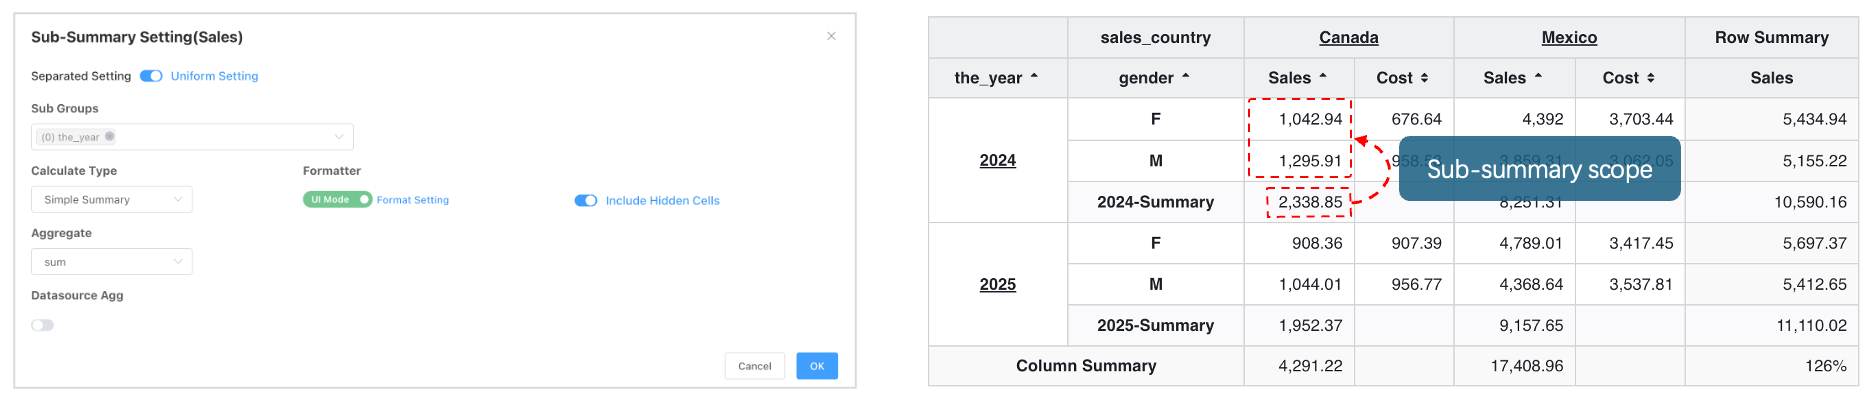
Advanced Column Subtotal
As mentioned, the cell range for simple column subtotal statistics is fixed. Users can only modify the aggregation type. However, if you need to change the aggregation granularity or perform arithmetic operations between two different measures, you need to use expression subtotals.
Select Complex Aggregation from the subtotal calculation type dropdown to enter subtotal expression editing:
Single aggregation function syntax:
agg('Measure', ['Row Dimension'...], ['Column Dimension'...]). Can be assisted via theAggregationinput helper.
aggrepresents the aggregation type.- First parameter is the statistical measure name, can be assisted via the
Measureinput, needs to be enclosed in single quotes. Should match the final output measure header in the cross-table (duplicate measure inputs will have a suffix). - Second and third parameters are arrays of row dimension header names and column dimension header names. Multiple dimensions can be specified to change the aggregation granularity. Both parameters can be left empty (or input
null). E.g.,sum('Cost')uses the default granularity.
Understanding Default Granularity
The subtotal cell above
sum('Sales Revenue') = sum('Sales Revenue', null, null) = sum('Sales Revenue', ['Year'], ['Country'])
Granularity Promotion
Subtotal granularity changes can only roll up (coarsen) from the default granularity of that subtotal level, not drill down. E.g., for subtotal level ['Year', 'Gender'], you can roll up to ['Year'], but cannot drill down to ['Year','Gender','Country'] because there is no corresponding country dimension value on that subtotal.
- An empty array
[]for the dimension array represents aggregating data for all row/column dimension levels. - If the dimension array input by the user does not find a corresponding dimension definition in the table, it defaults to matching all dimensions.
- Arithmetic operations can be performed between multiple aggregation functions, e.g.,
sum('Cost')/sum('Sales Revenue')- Supports single-line comments
//and multi-line comments/* */. - After writing the expression,
Syntax Checkcan be performed.
// Calculate monthly percentage in the subtotal column
sum('Cost', ['Year', 'Month']) / sum('Cost', ['Year']);
Syntax check can only detect obvious syntax errors in the expression, such as unsupported aggregation functions or Chinese parentheses where English parentheses are required. It cannot detect if the members of the input dimension array are correct. Runtime exceptions may still occur even after syntax check passes.
Style Configuration
Table Layout
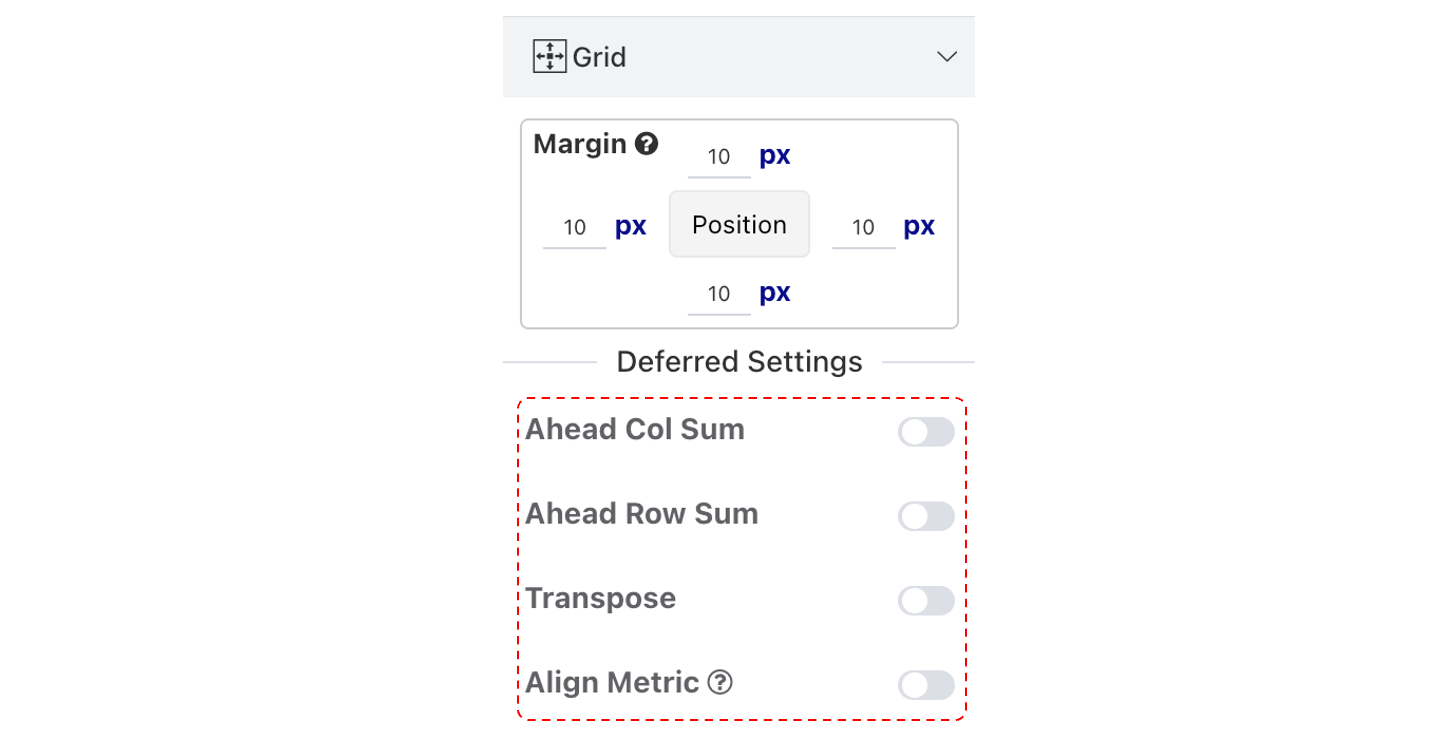
You can easily change the pivot table layout through configuration.Note that structural changes are non-immediate effect properties.After modifying the configuration, you need to click Preview to update the chart for the changes to take effect. Structural changes include:
- Row summary placement
- Column summary placement
- Align metrics (by default, column dimensions come first, then metrics; after alignment, the column header displays metrics first, then column dimensions)
- Transpose
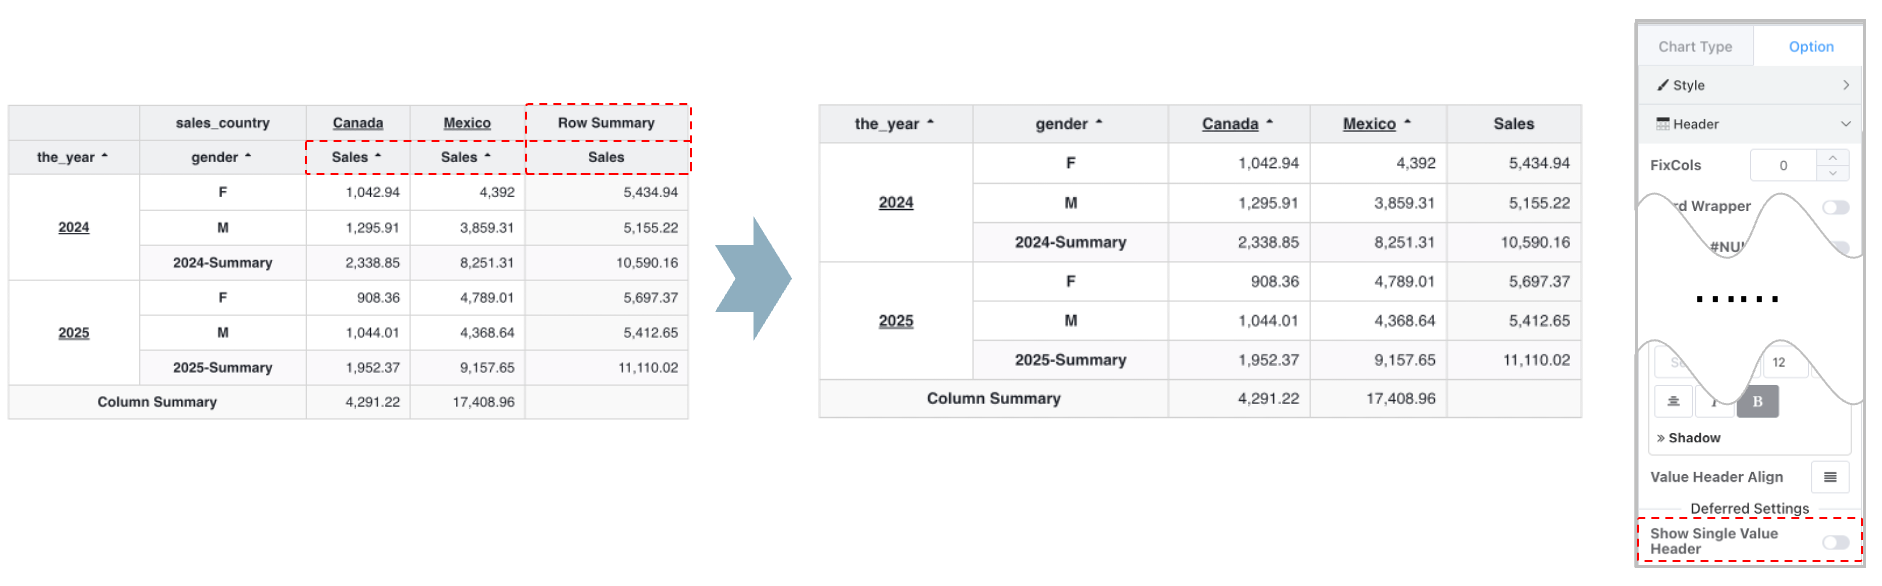
Hide Value Header for Single Measure
When column dimensions exist and there is only one measure, if the repeated measure name is undesirable, you can turn off the Show Value Header for Single Measure switch. Effect as below.
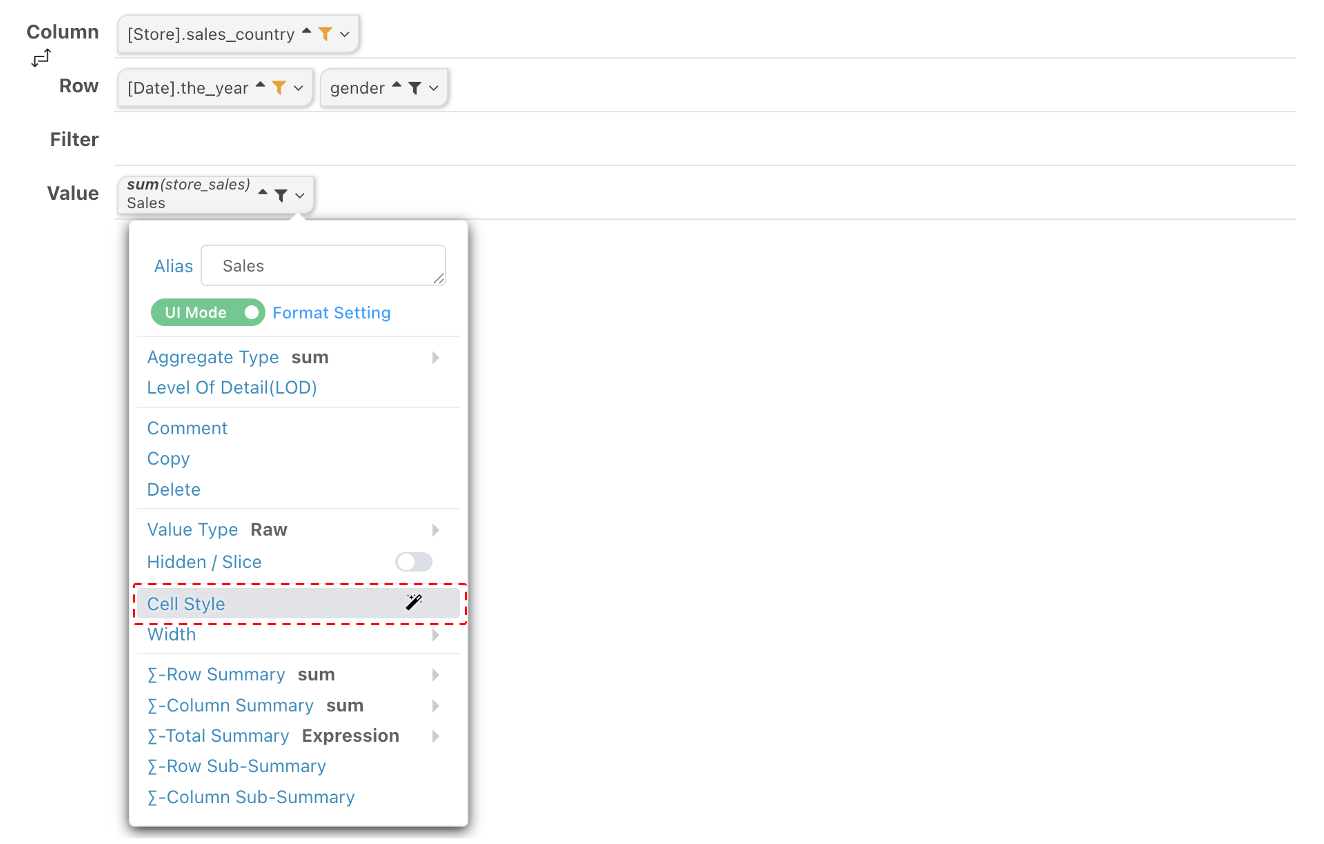
Cell Style
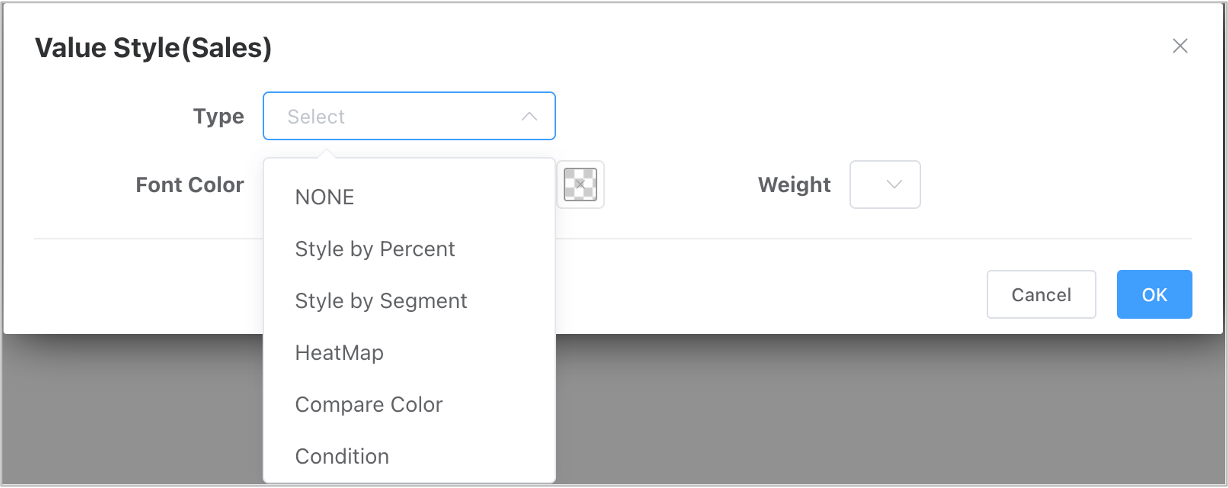
Cell style includes percentage style, segmented style. When setting value display to percentage, percentage style is automatically mapped.
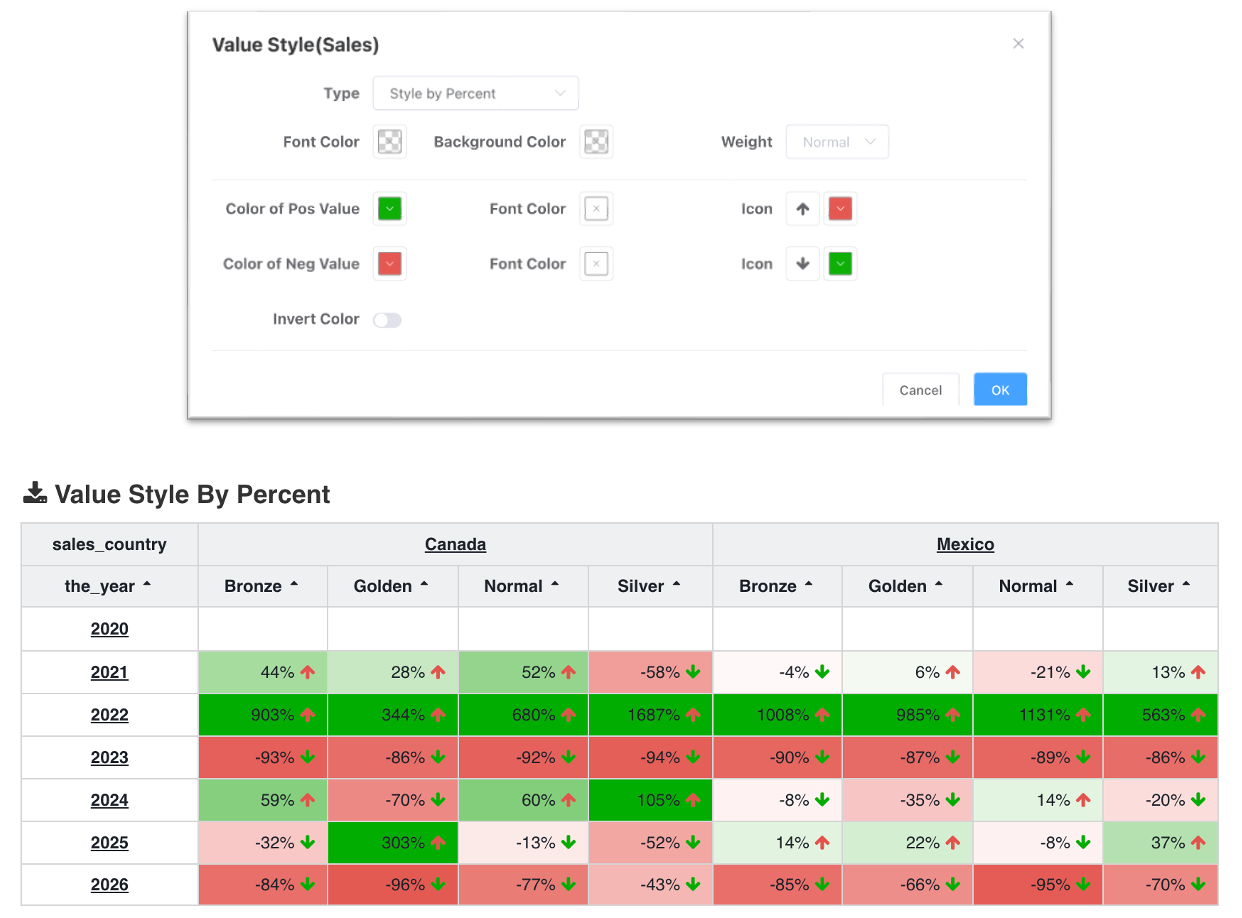
Style by Percent
When a measure is formatted as a percentage, using percentage style can quickly set the measure's style, including positive/negative background color, font color, icons, icon colors. Icon configuration is supported from version 2.0.
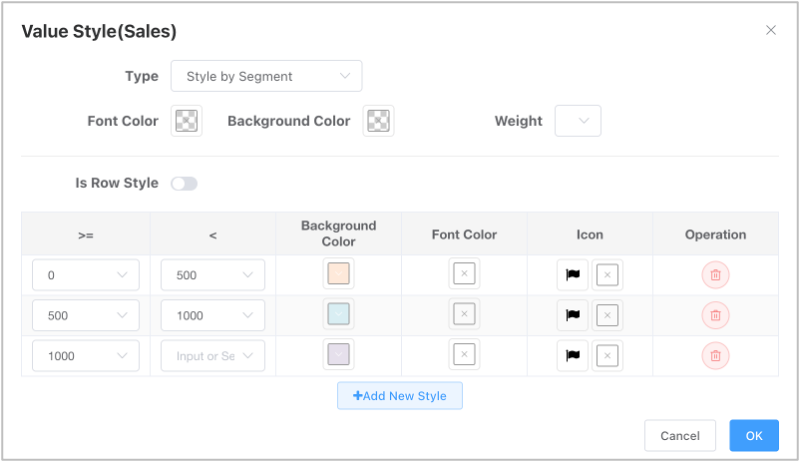
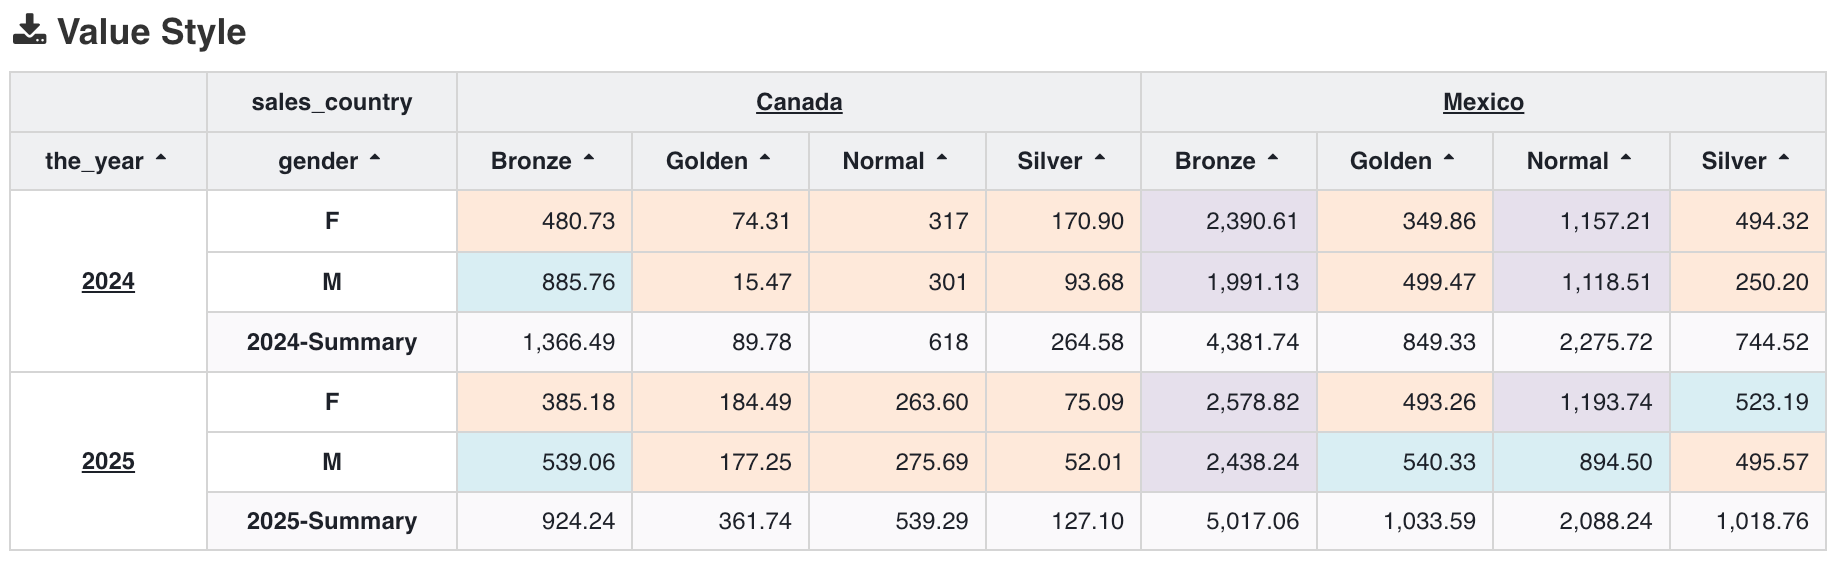
Style by Segmented
- In segment configuration, upper/lower limits can be input as constants, or selected via dropdown to dynamically use the measure's corresponding dimension as dynamic limits (prerequisite: dimension must be a comparable numeric value).
- Can configure only upper or lower limit, making the segment an open interval.
- Icon configuration is supported from version 2.0.
Heatmap
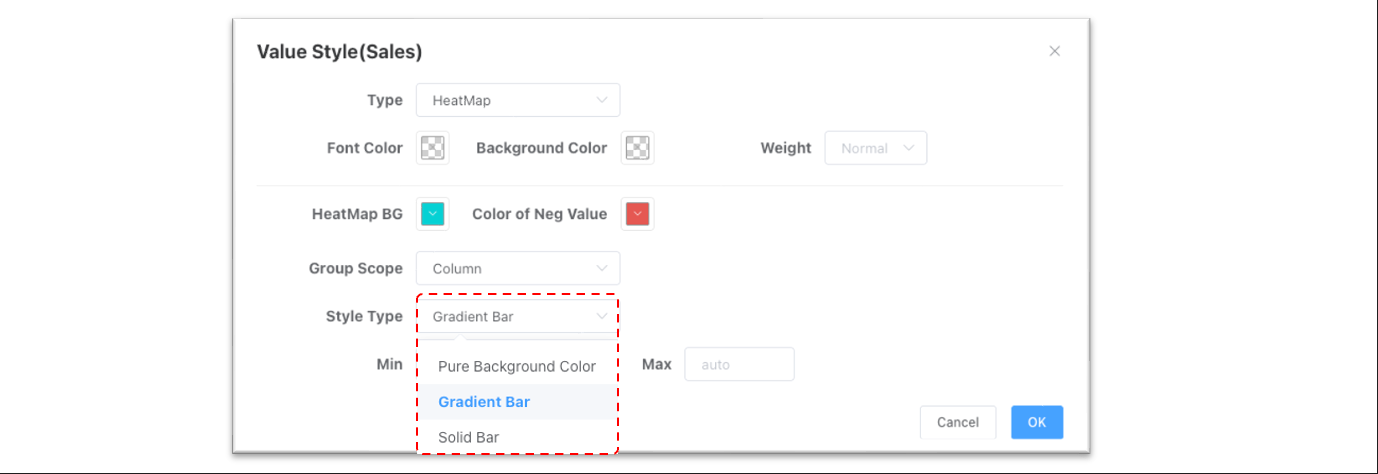
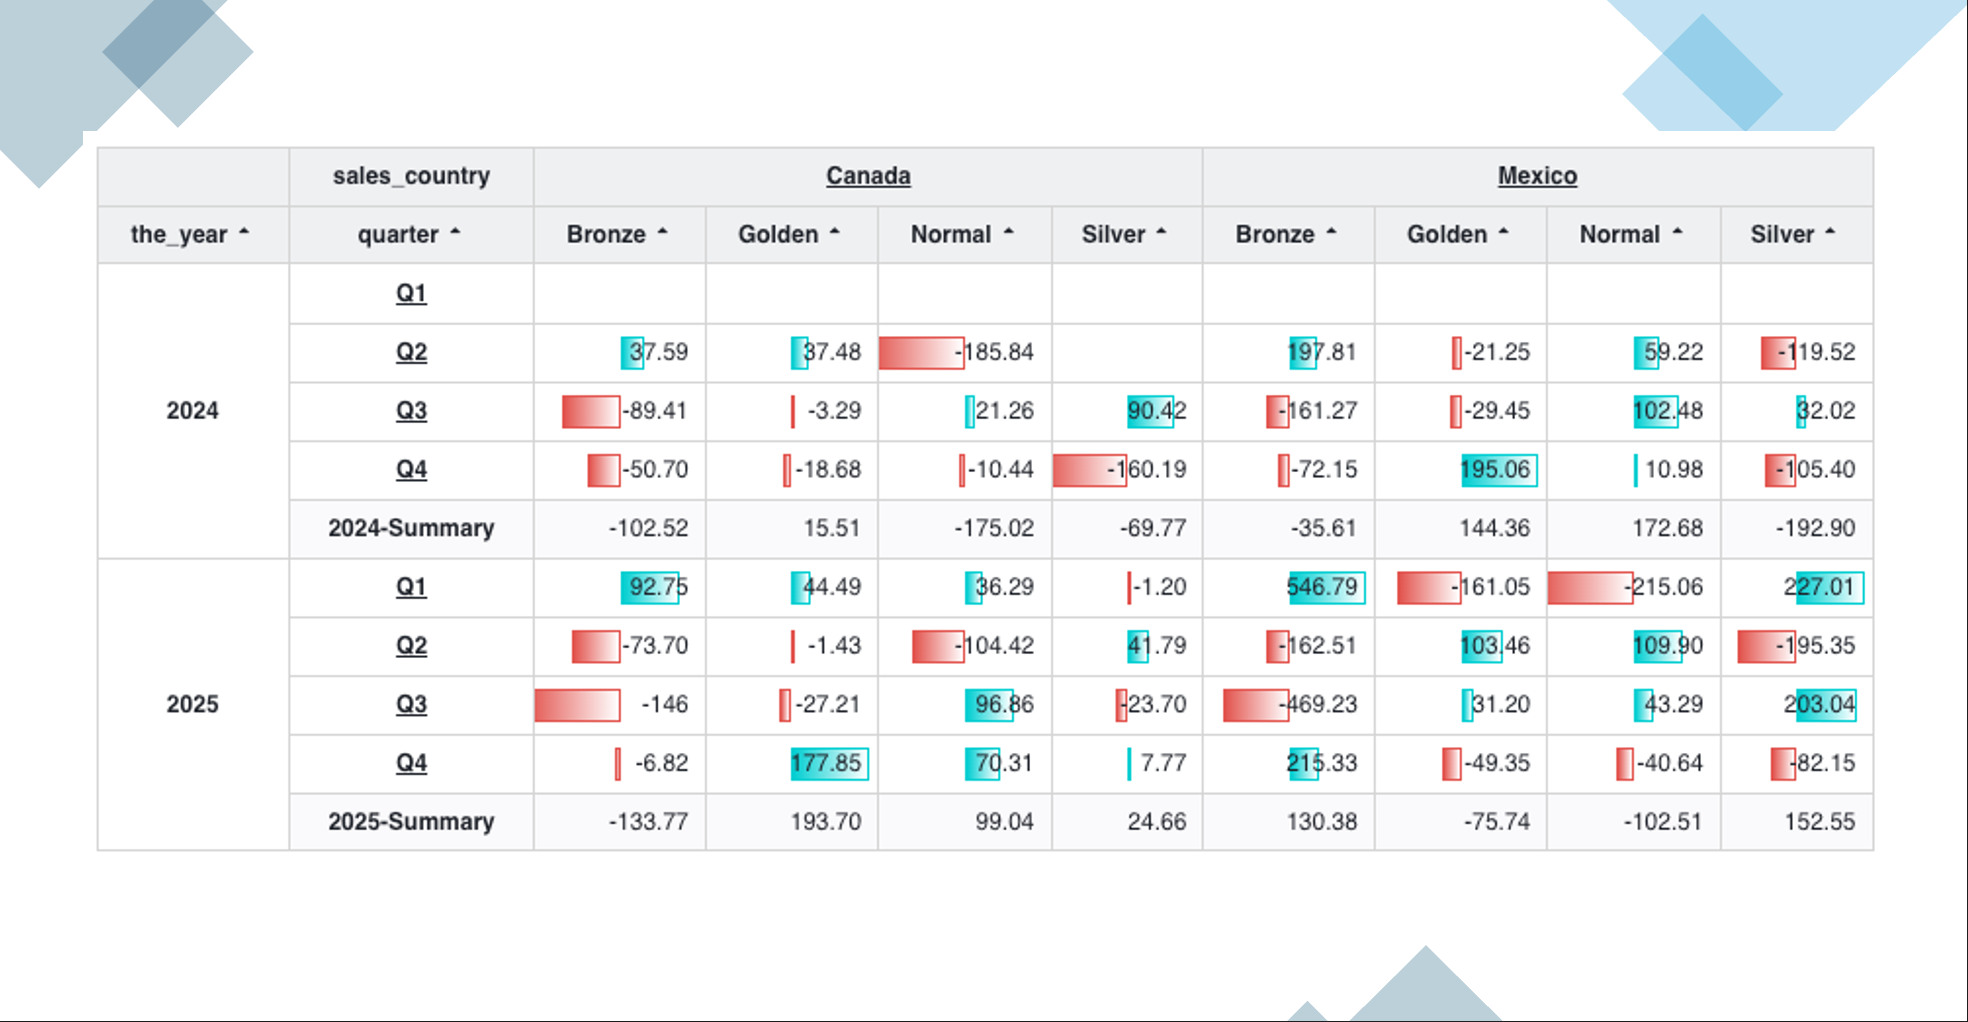
Through the table cell style heatmap, users can quickly locate value distribution in the table. In heatmap configuration, font color and cell background color have defaults. Min and max values can be automatically calculated; no special settings needed.
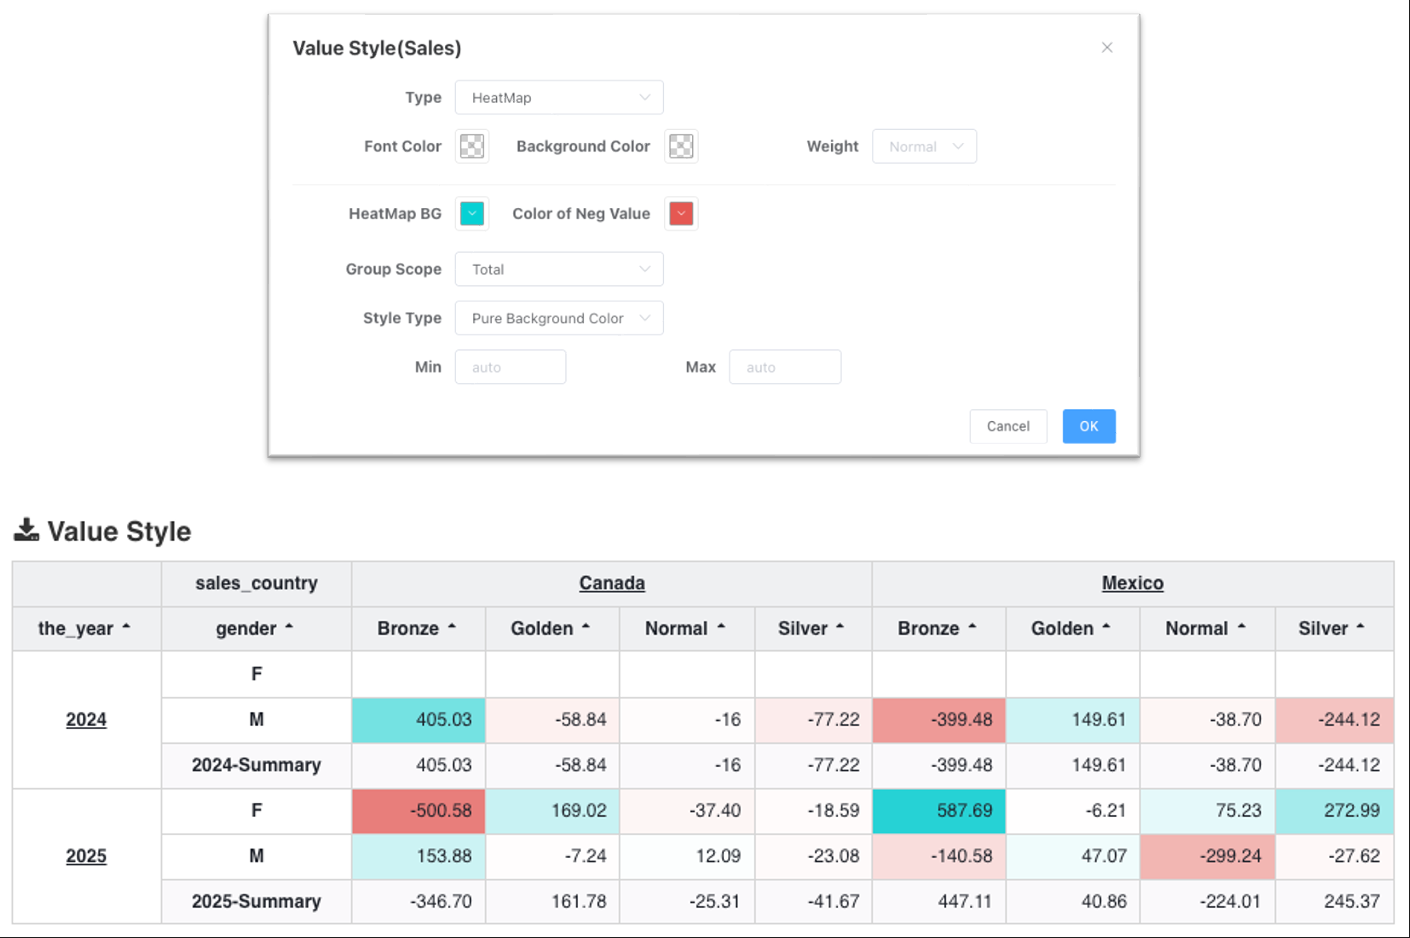
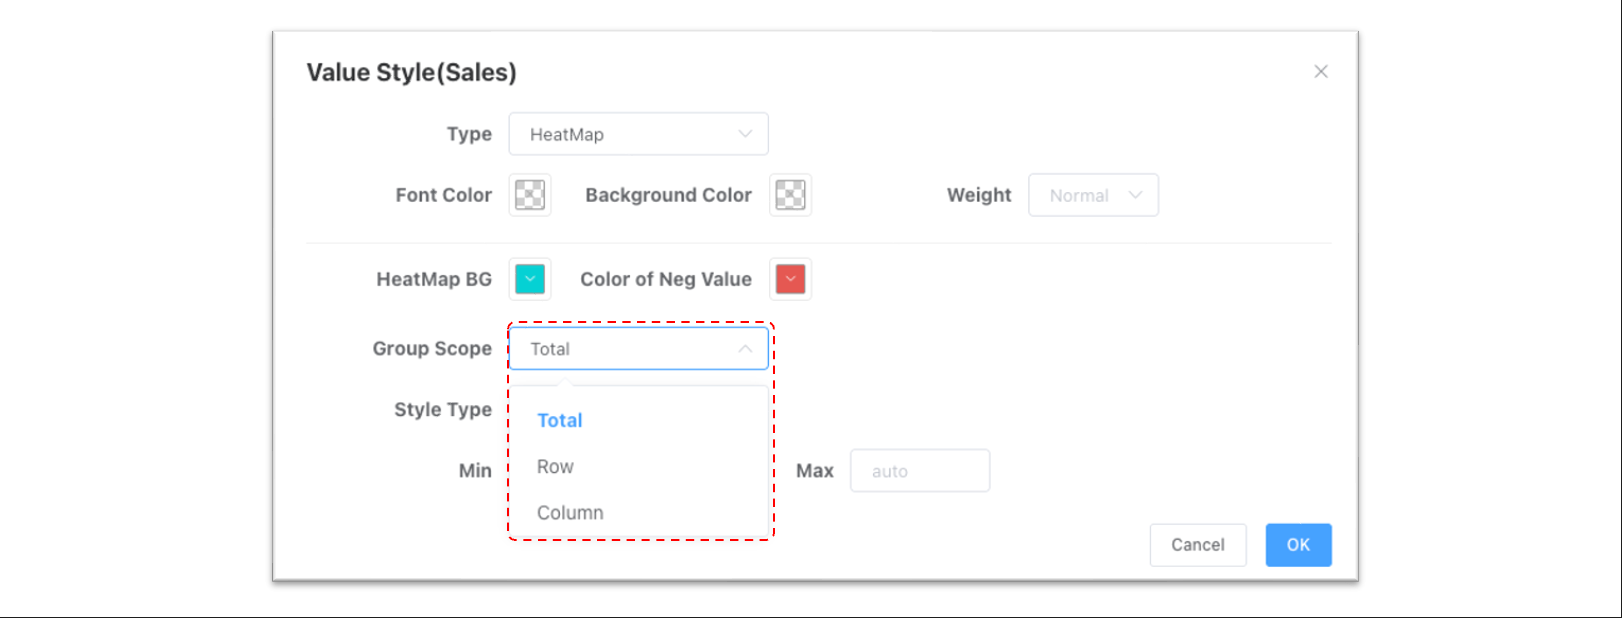
- Cell style heatmap supports configuring calculation scope: row, column, entire table.
- Cell style display form adds gradient bar, solid color bar.
Conditional Style
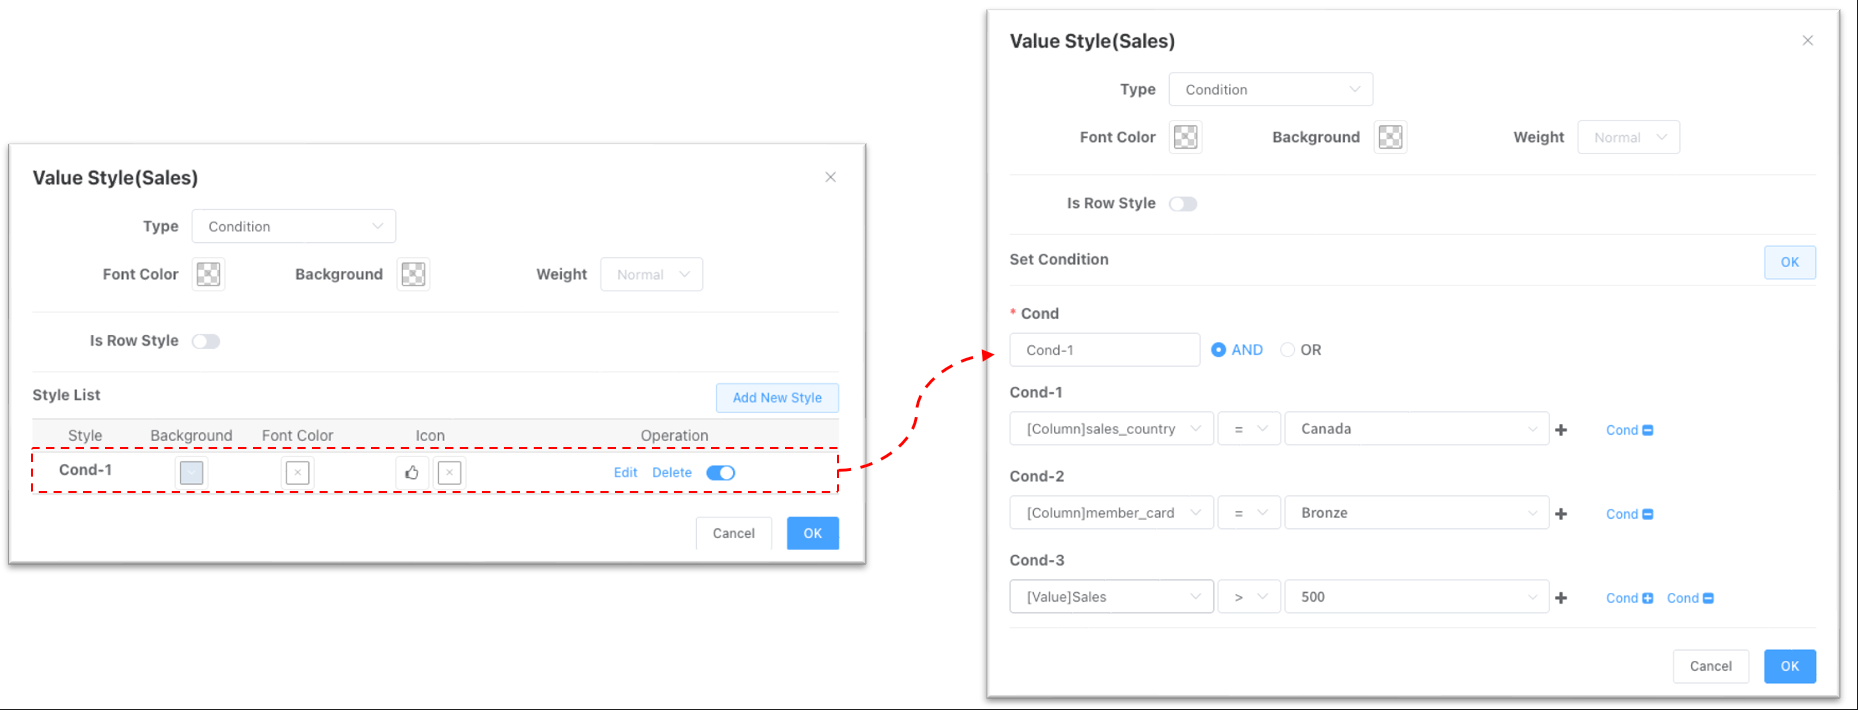
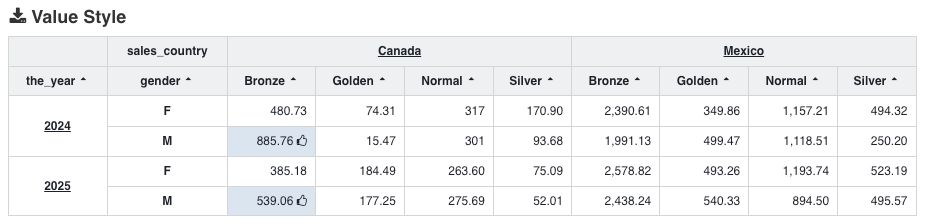
Use conditional style to configure dimension conditions and measure conditions to precisely target measure cells, e.g.:
- Same measure, different column dimensions (country, department) set different anomaly thresholds.
Borders
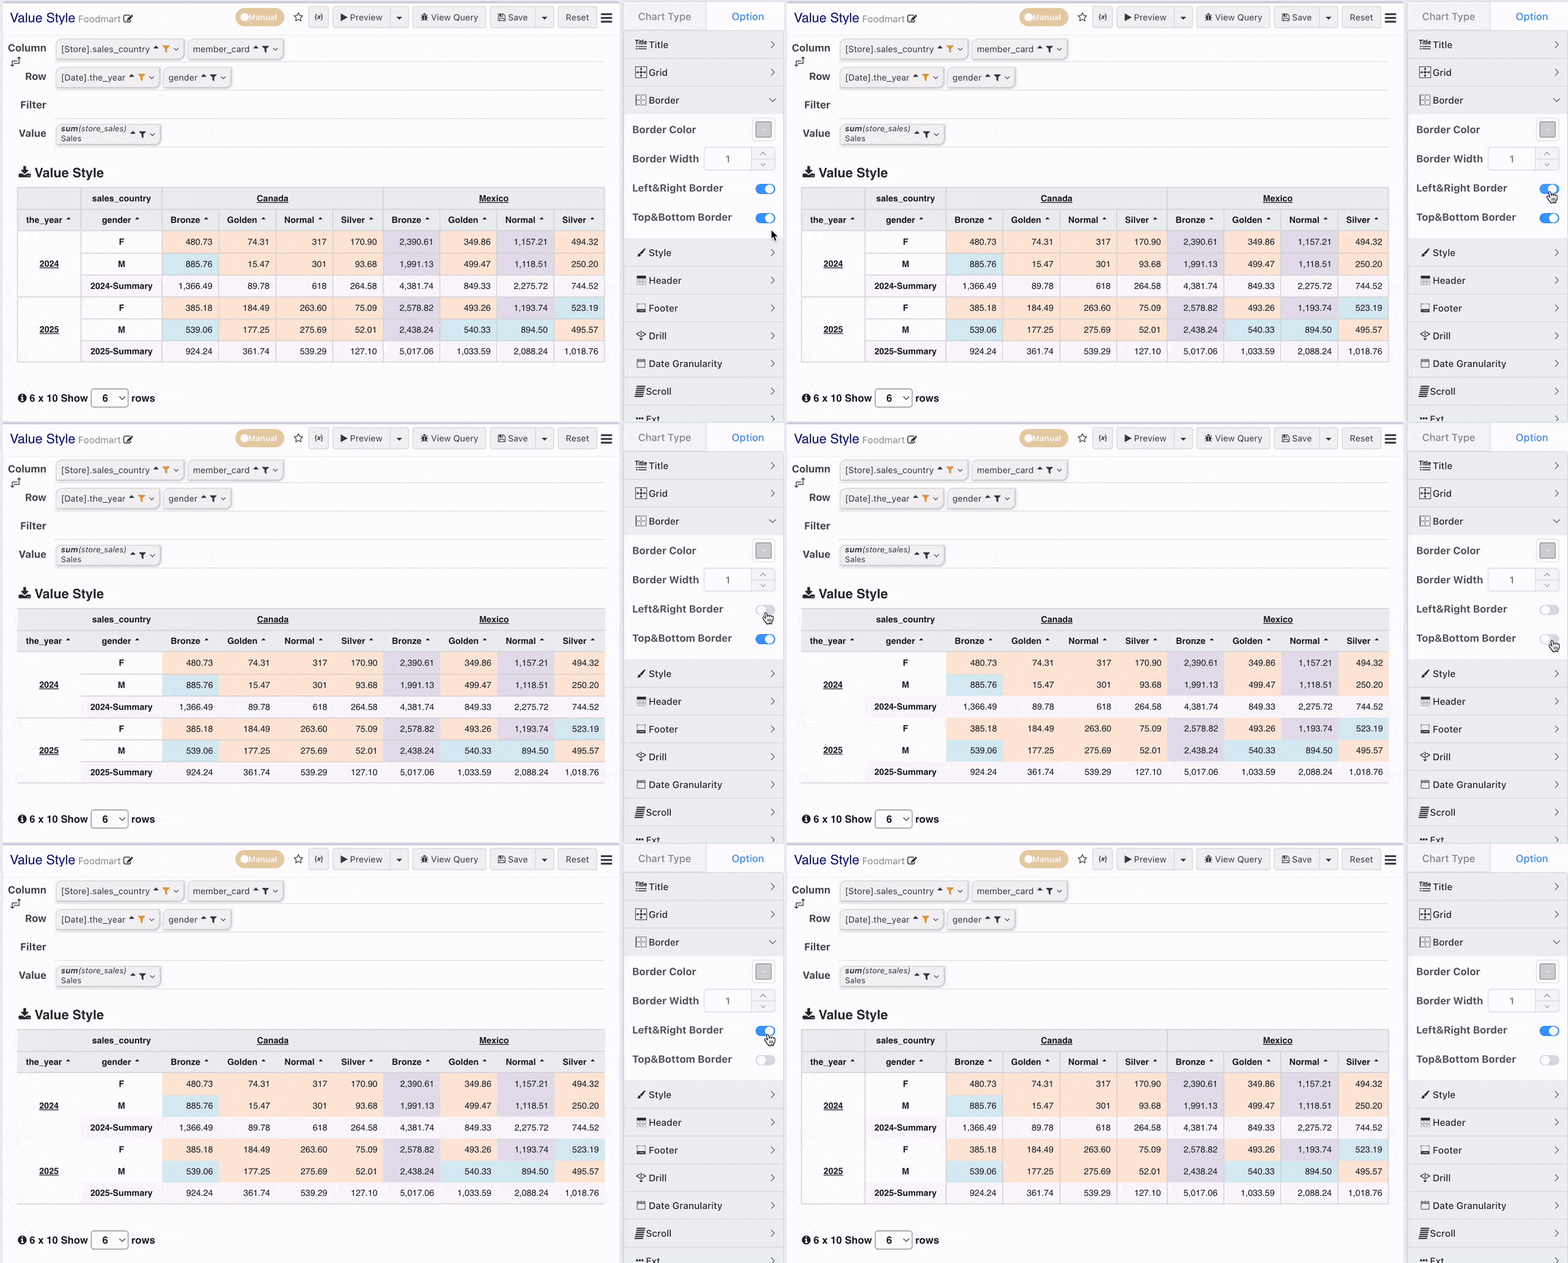
Cross-table supports separate configuration for showing/hiding left/right borders and top/bottom borders. Note: when top/bottom borders are turned off, the header's bottom border and the last data row's bottom border are not hidden. To hide all borders, set border line width to 0.
Headers
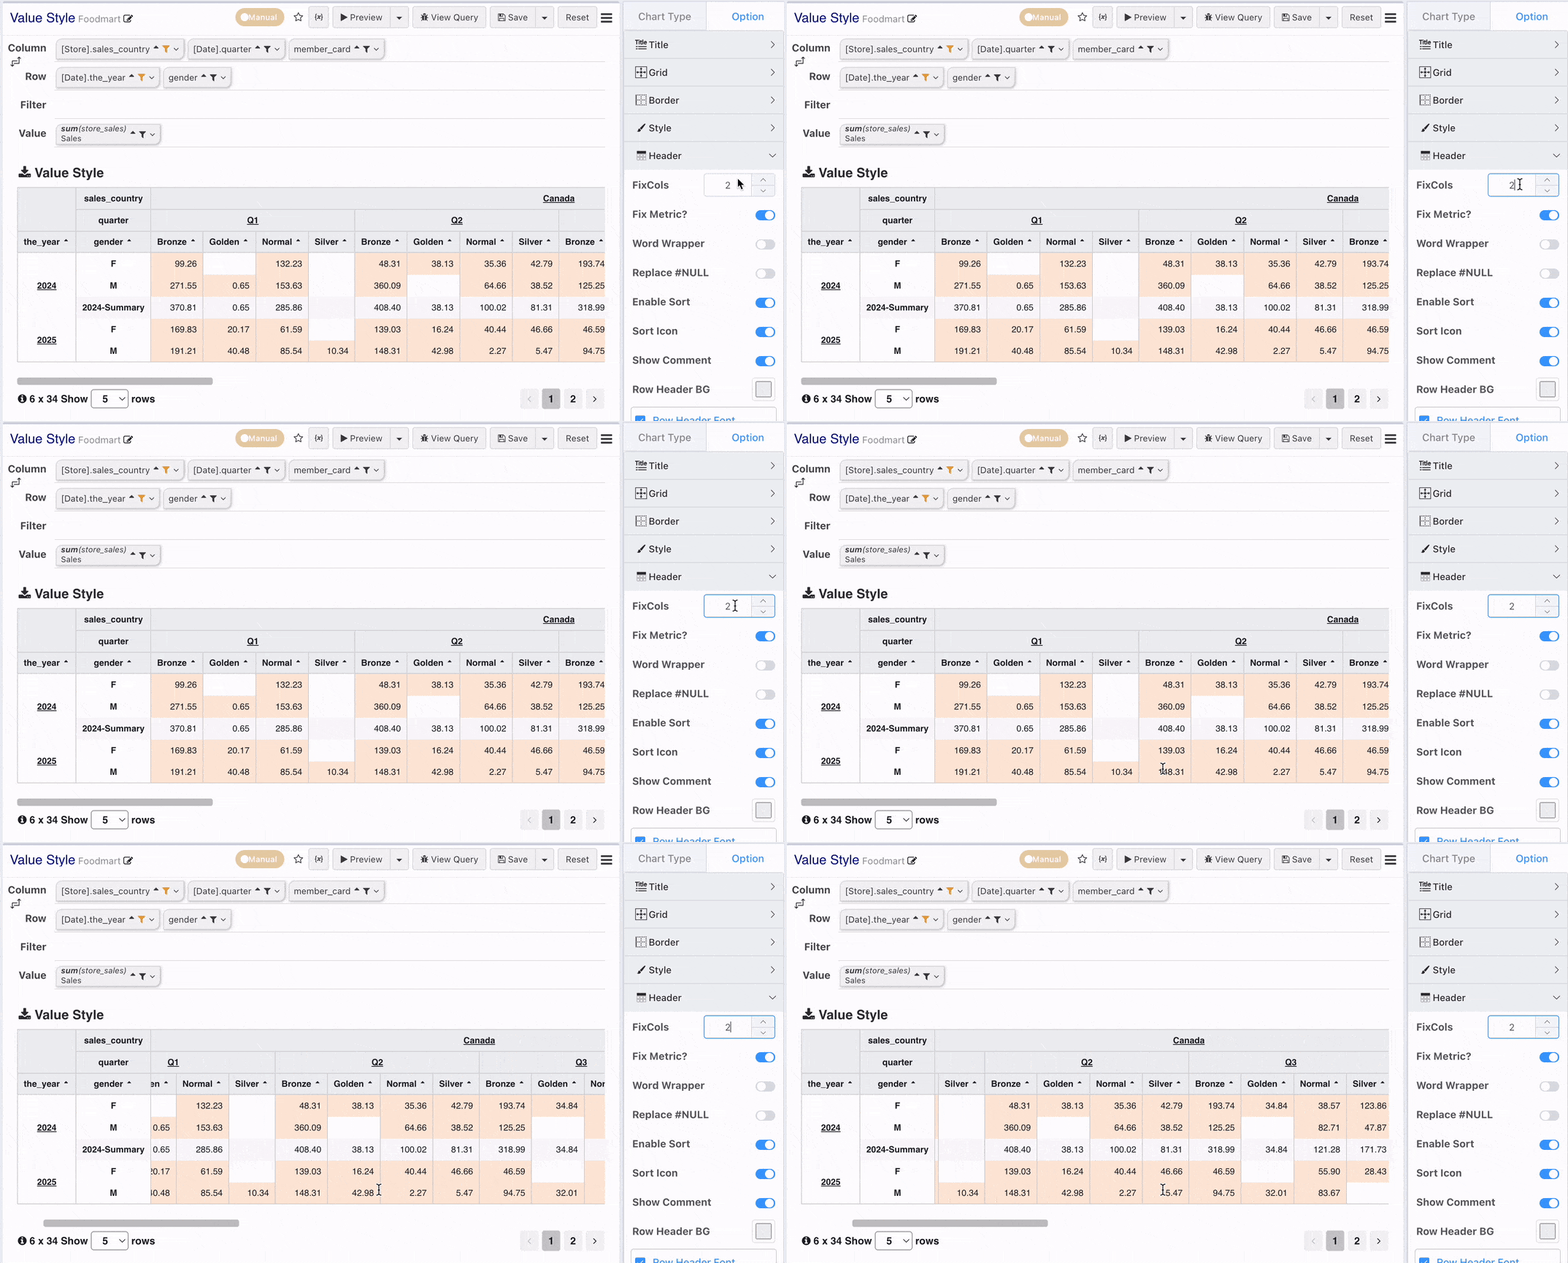
Fix First N Columns
Configure fixing the first N columns to achieve header fixation. By default, the first N columns include measure columns. If measure columns don't need fixing, turn off the Fix Measure Switch.
Column Width and Wrapping
Header line wrapping, setting column width for row dimensions and measures. By default, cell content does not wrap. If column width is configured and wrapping is desired, turn on the Allow Wrapping Switch.
Interactive Sorting
Interactive sorting refers to clicking on the value header to achieve sorting effects. Note:
- If row dimensions have sorting, row dimension sorting takes priority.
- Only one measure column can be selected for sorting at a time.
- Turning off the
Sorting Interactionfunction hides the sorting indicator.
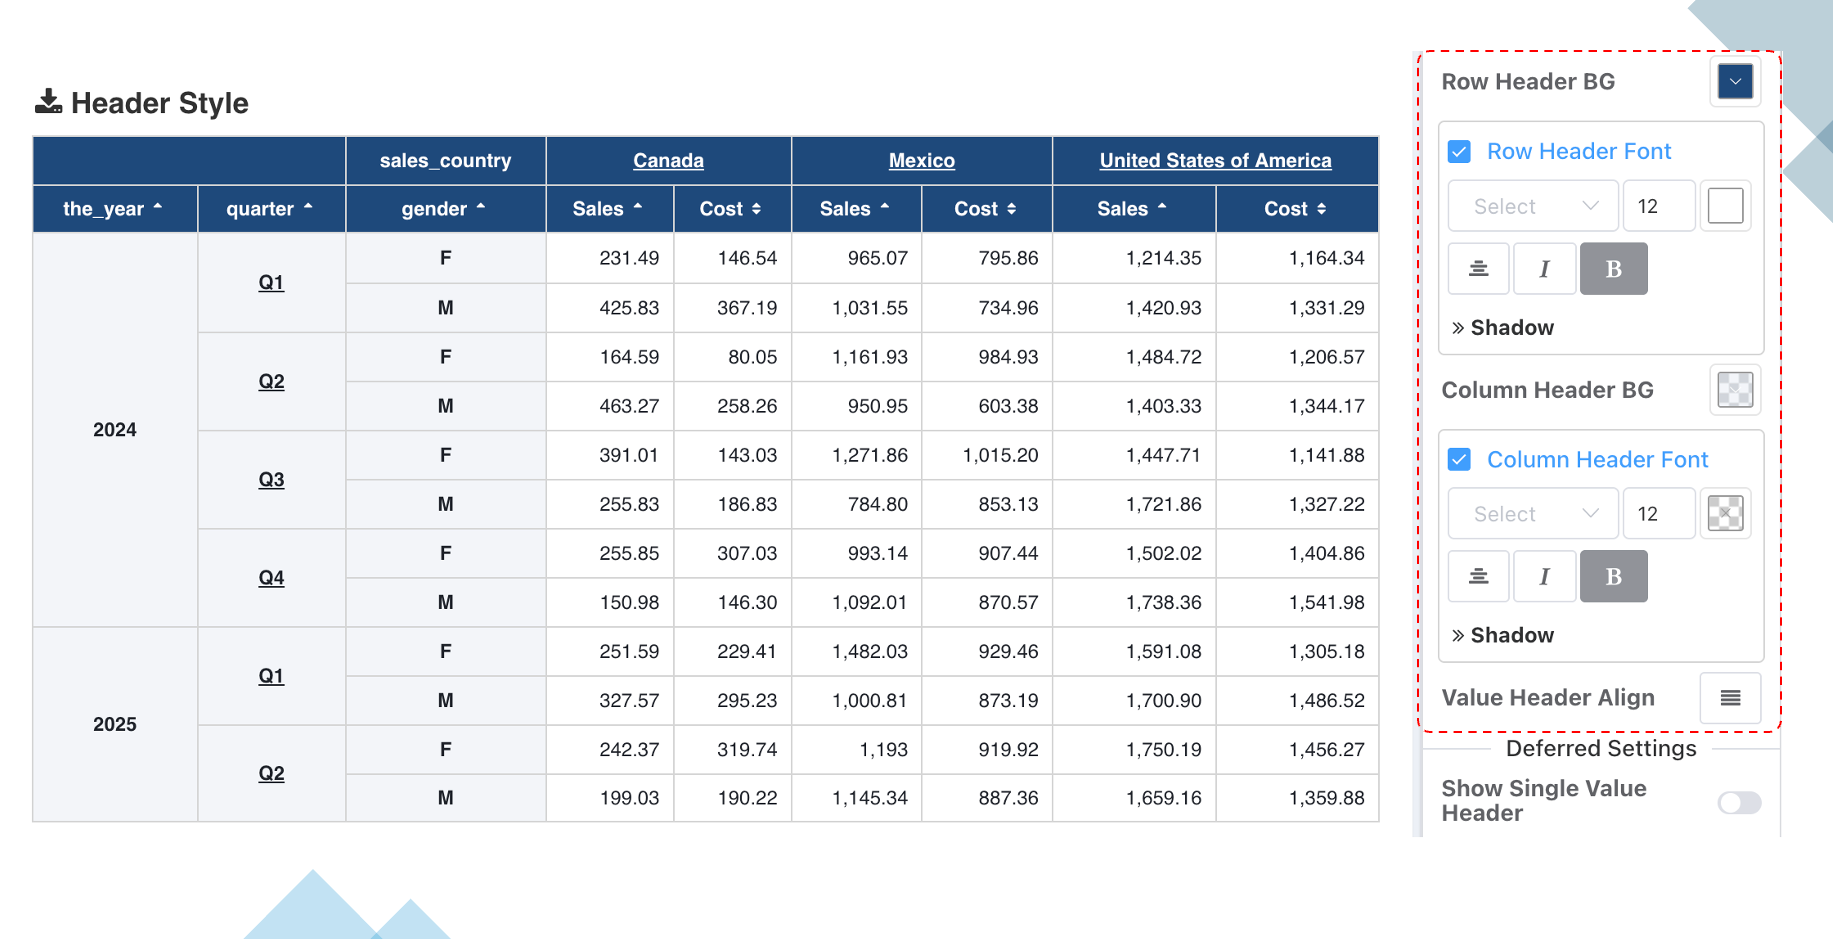
Header Font
Column headers and row headers can have independent font configurations.
Footer
Show Page Numbers
By default, the table automatically paginates based on container height. Turning off Show Footer or Show Page Numbers can disable pagination.
Page Number Style Adjustment
Supports adjusting:
- Number of page number buttons
- Page number button background color, active background color, font, etc.
Scrollbar
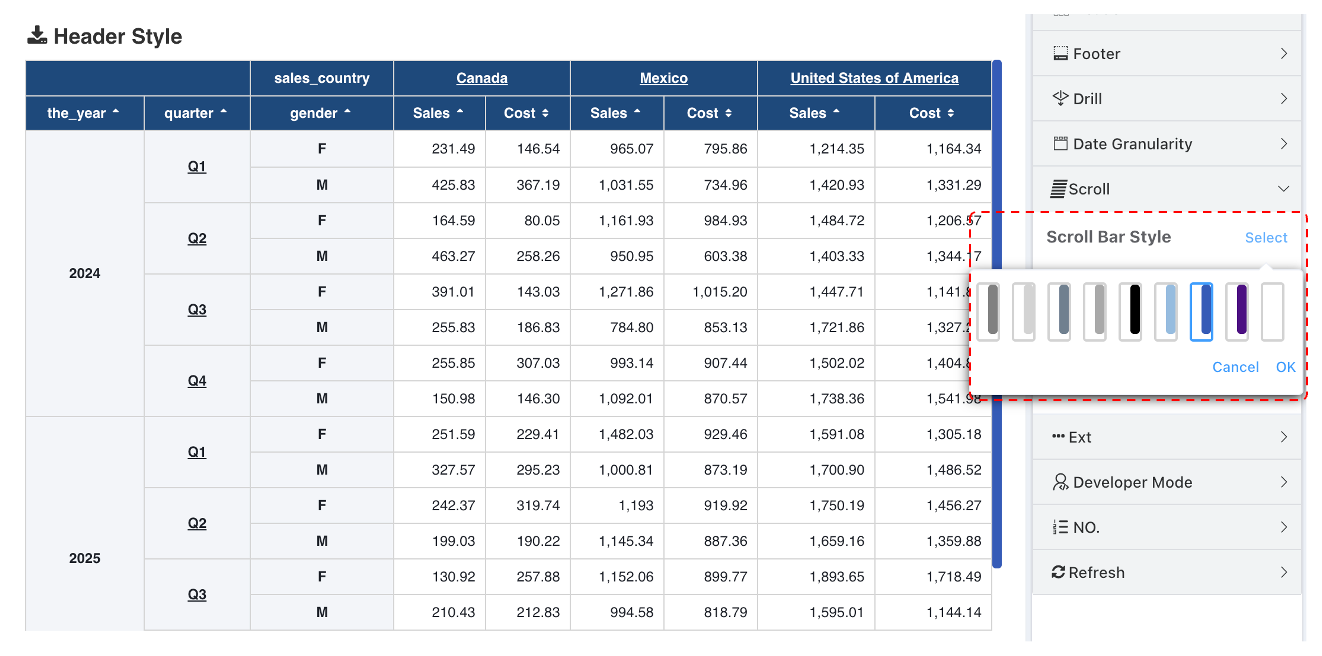
When the table is not paginated, scrollbar color can be configured, which is useful for large-screen styling.
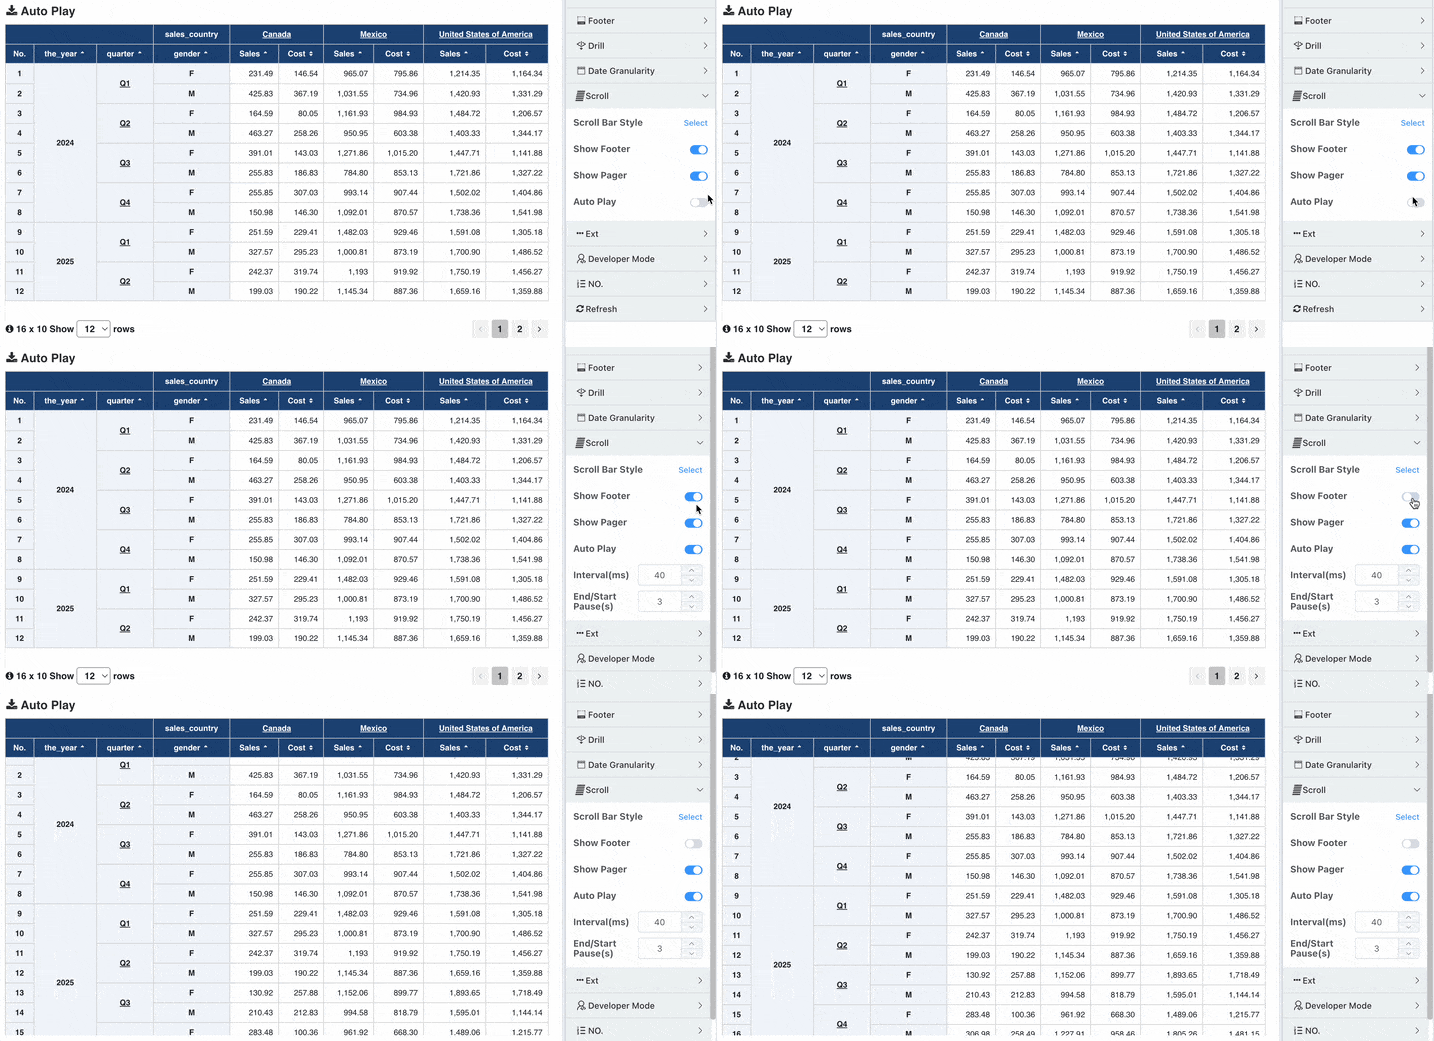
Auto-Scroll
Cross-table supports enabling auto-scroll. Simply set Scrollbar -> Disable Page Numbers -> Turn on Auto-Scroll.
- Supports setting pause time at start/end.
- Supports pausing scroll on mouse hover.
- Supports configuring scroll speed.
- When auto-scroll is enabled, you can configure scrollbar color to be transparent to hide the scrollbar.
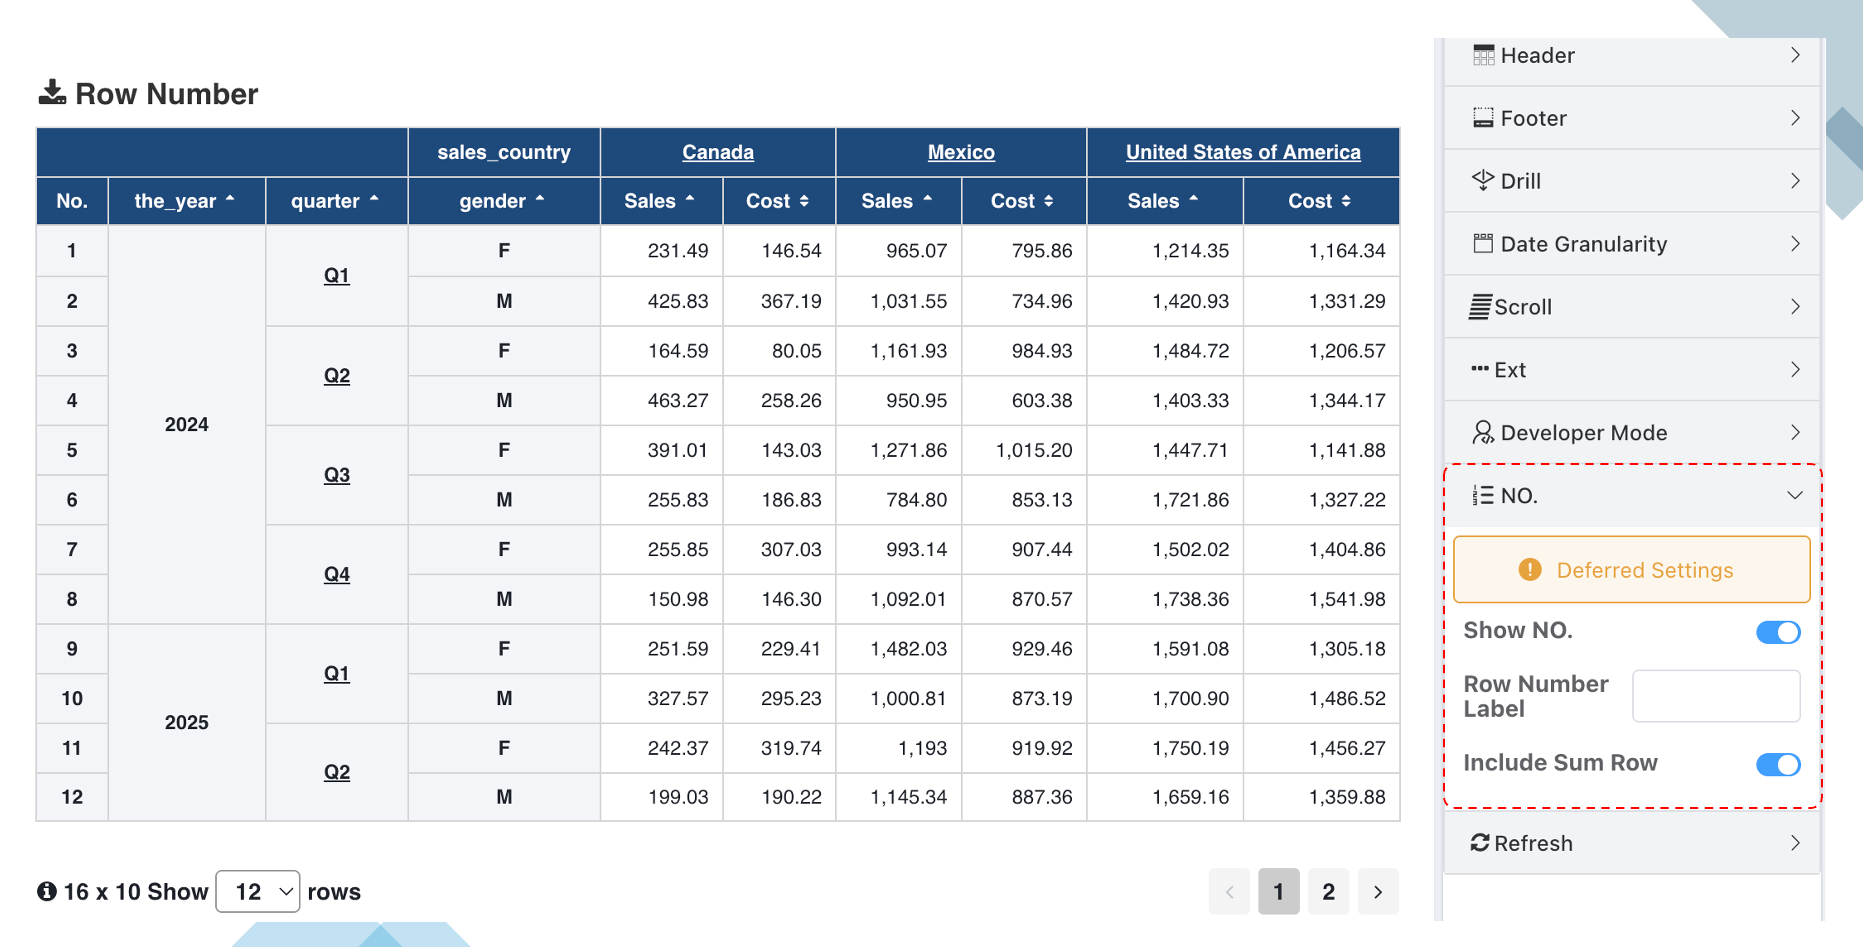
Serial Number Configuration
Other Configurations
- Column summary header
- Row summary header
- Subtotals
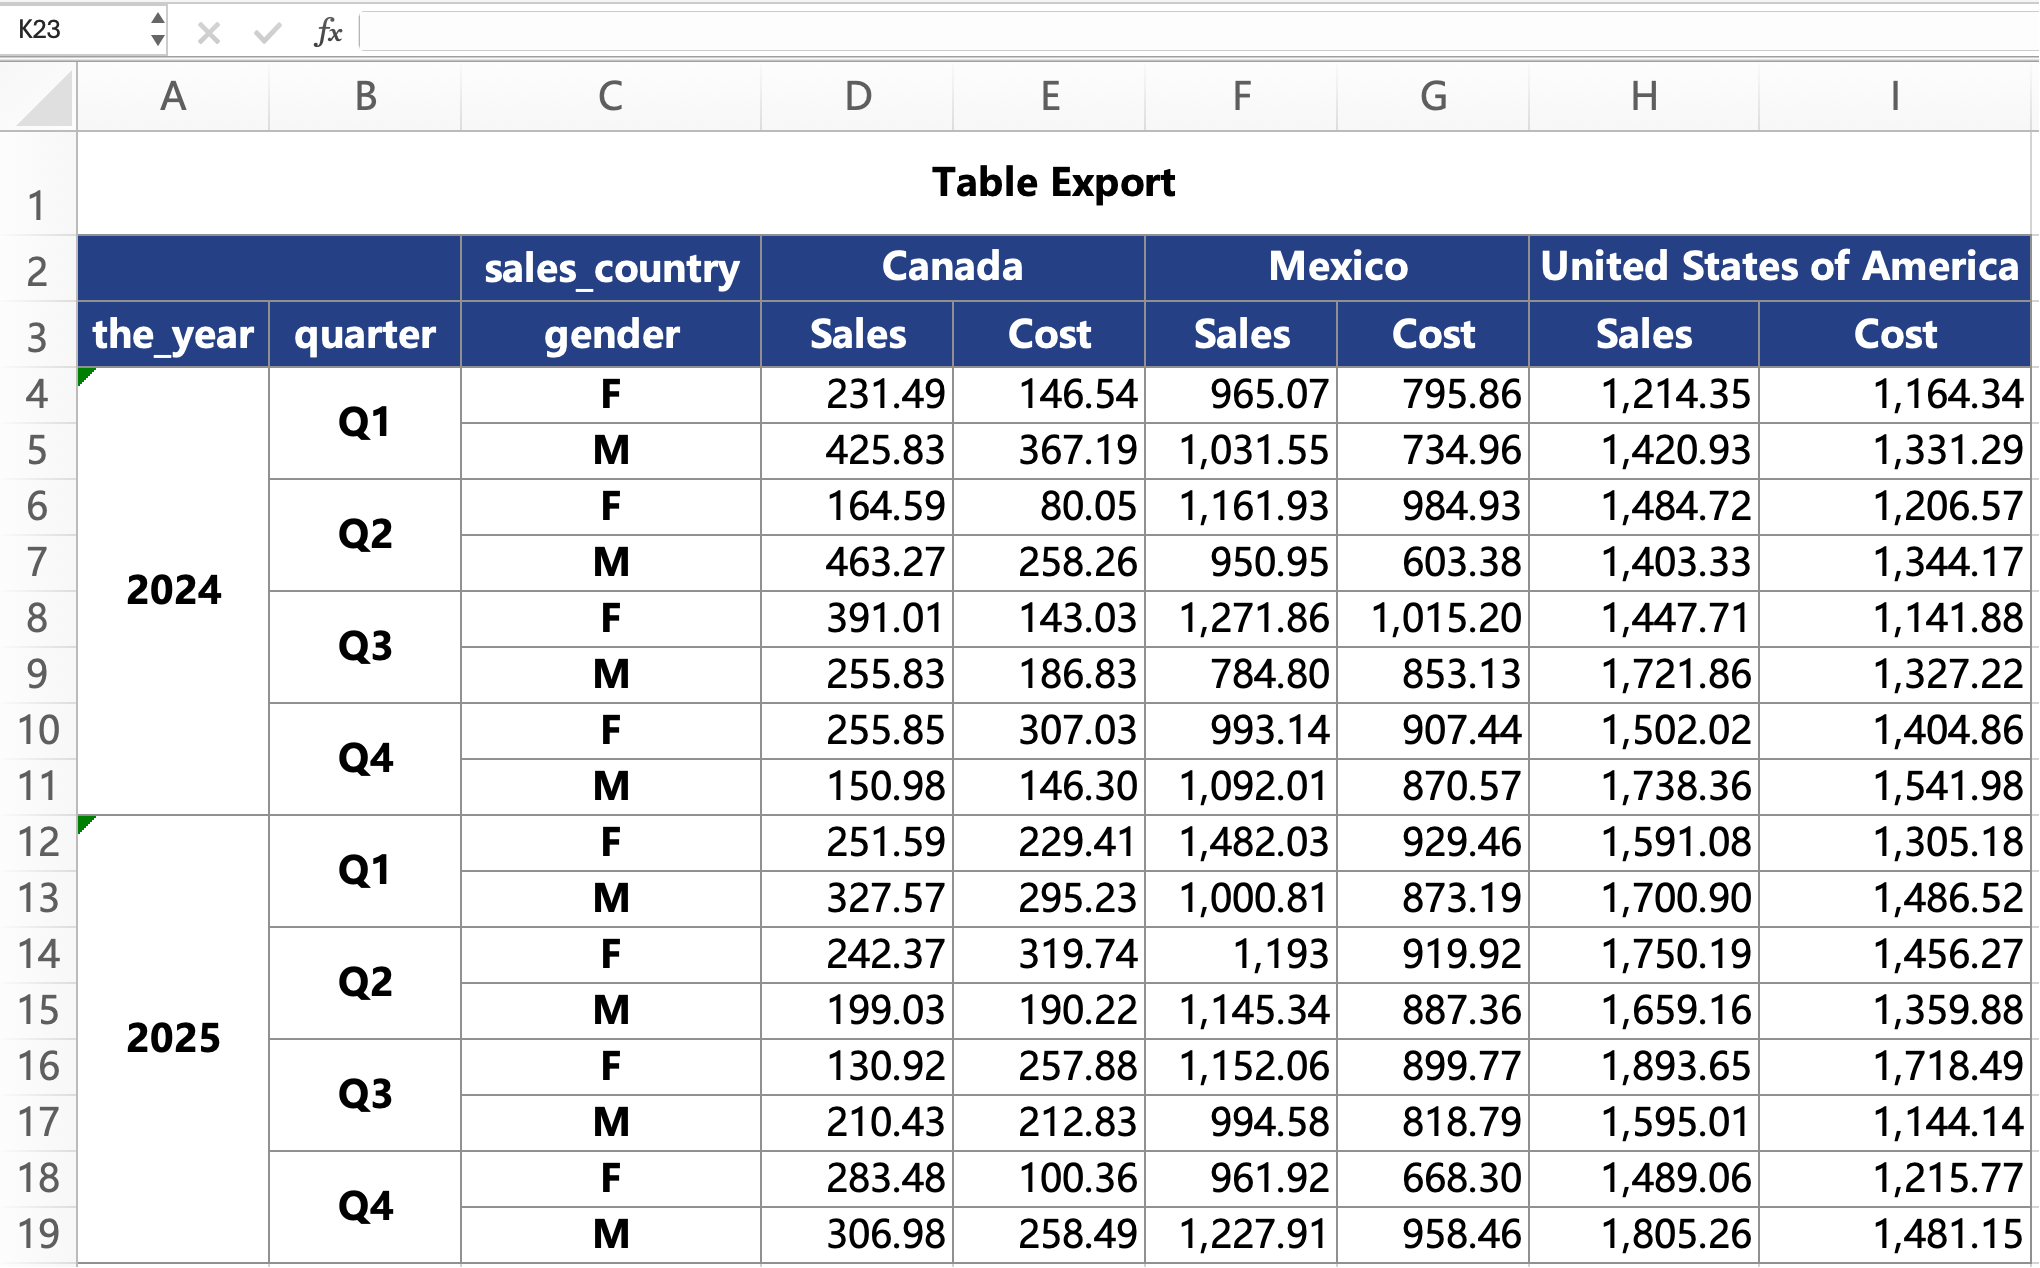
Table Export Excel
Besides cell styles which currently cannot be kept consistent during export, value types and summaries can be reflected in Excel exports. Cell style export compatibility will be implemented later.
Summary Push-Down to Data Source
Background on Summary Calculation
Previously, row/column summaries, subtotals, and grand totals were only calculated by secondary processing on the existing data (view data/surface data) in the table.
- Benefit: For sum-type calculations, it avoids multiple queries to the data source, improving chart performance.
- However, it becomes powerless when encountering calculations that must be performed on the original data.
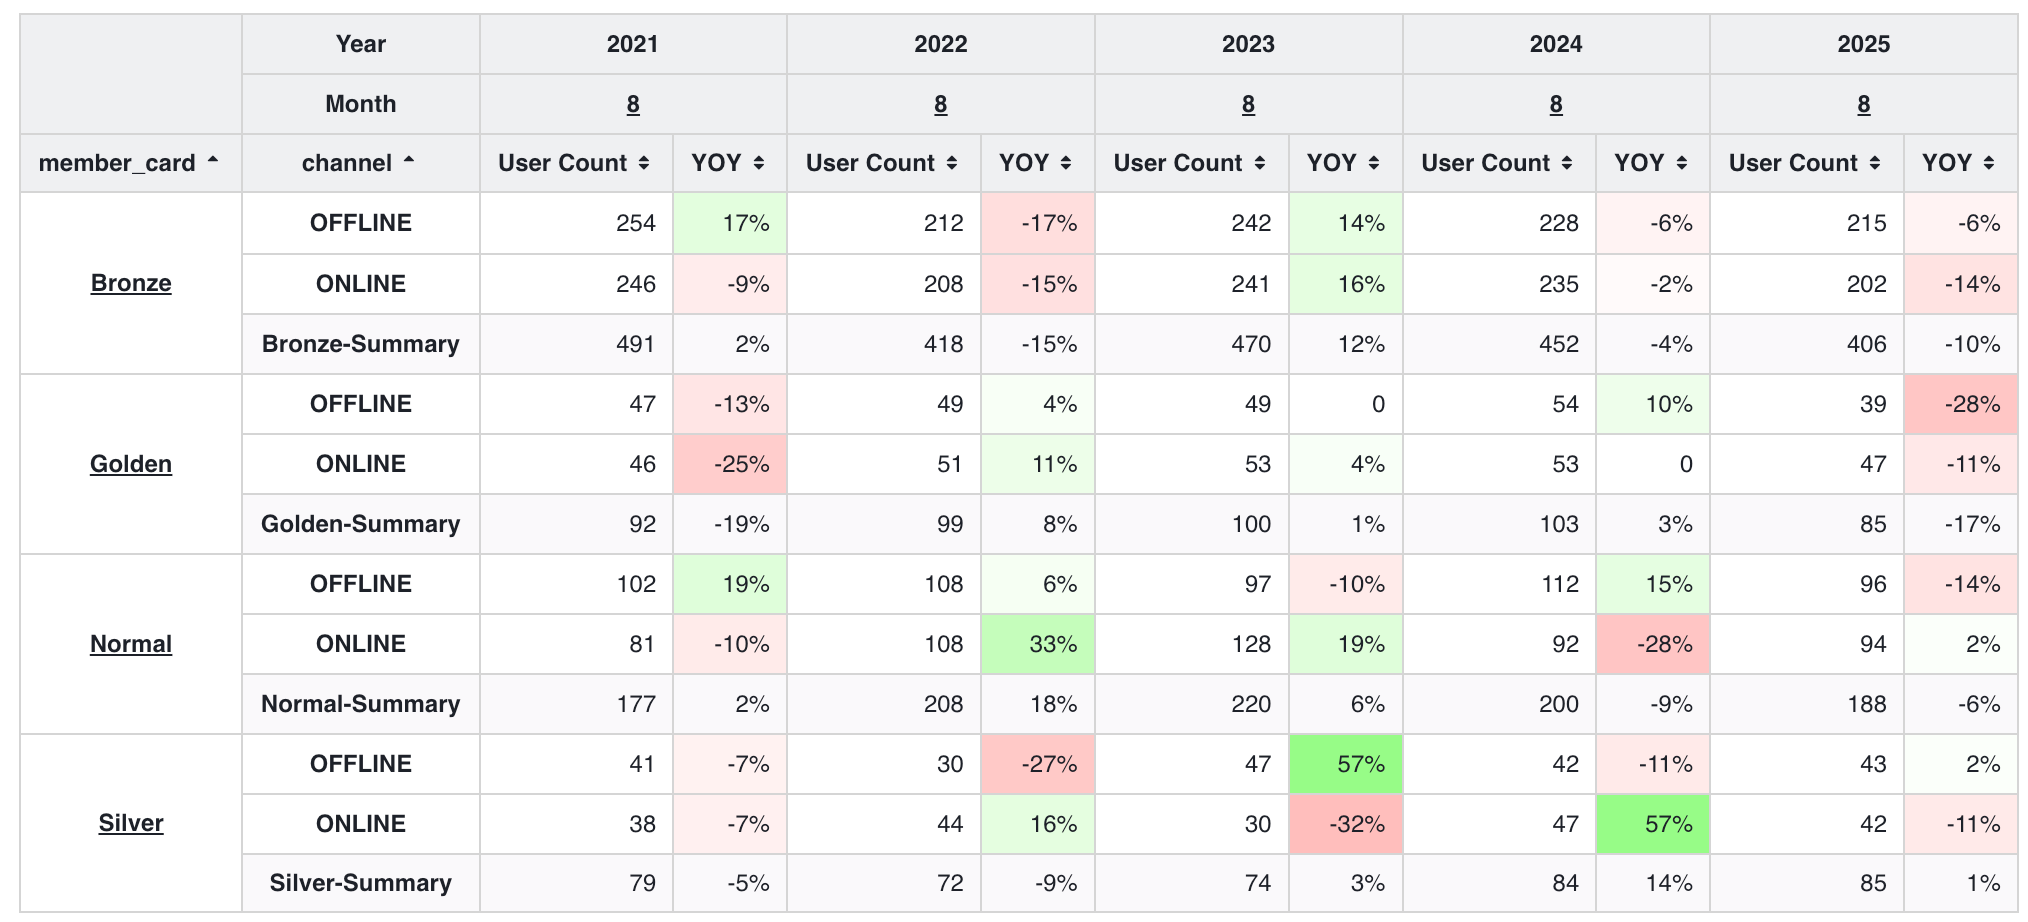
As shown below, counting the number of users in order table data, aggregation method is count(distinct userid). White cells are precise results from the query.
select member_card, channel, year, month,
       count(distinct userid)
  from table
 group by member_card, channel, year, month
We know a user may have placed orders in different channels (OFFLINE, ONLINE), and membership level may have been upgraded or downgraded within a year. Therefore, for subtotal and column summary counts, simple summation is not correct; instead, we need to elevate the aggregation granularity and query again.
-- Column subtotal statistics
select member_card, year, month,
       count(distinct userid)
  from table
 group by member_card,  year, month

-- Column summary statistics
select year, month,
       count(distinct userid)
  from table
 group by year, month
Summary YoY/MoM and other value type changes
Users familiar with summary functions know that summary cells do not support view calculations like percentages, YoY, MoM. The YoY/MoM for subtotal and summary rows in the table below cannot be calculated with the previous single query approach.
Feature Introduction
To solve such problems, this update adds the feature of pushing summary calculations down to the data source. When encountering calculations that must be pushed down, like count(distinct), dataset expressions, etc., they will be automatically pushed down. Below is the list of features implemented with summary push-down to data source:
- Support row summary, column summary.
- Support subtotals.
- Support dataset expression push-down.
- Pushed-down summaries support value type configuration.
- Summary expressions support push-down calculation.
- Ordinary summaries can be forced to push down to data source calculation.
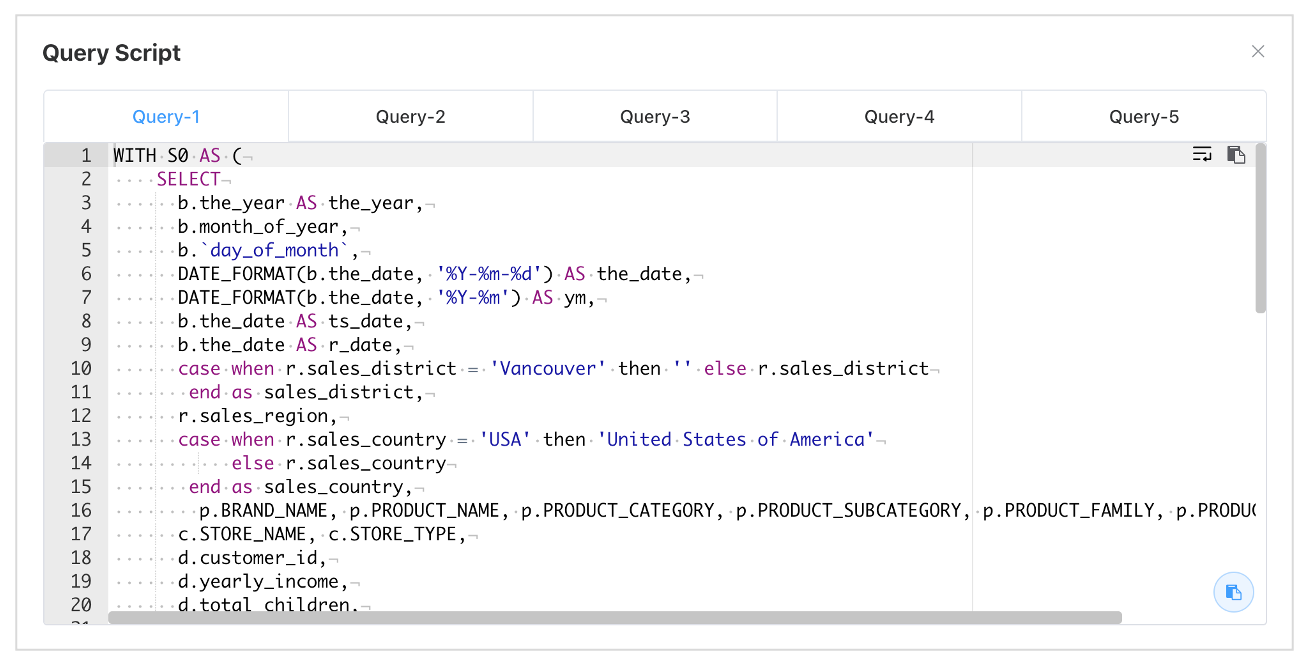
- Preview query supports multiple queries.
Dataset Summary Exp Push-Down
For dataset expression type summaries, add original type to value types, using the original aggregation formula at the summary granularity.
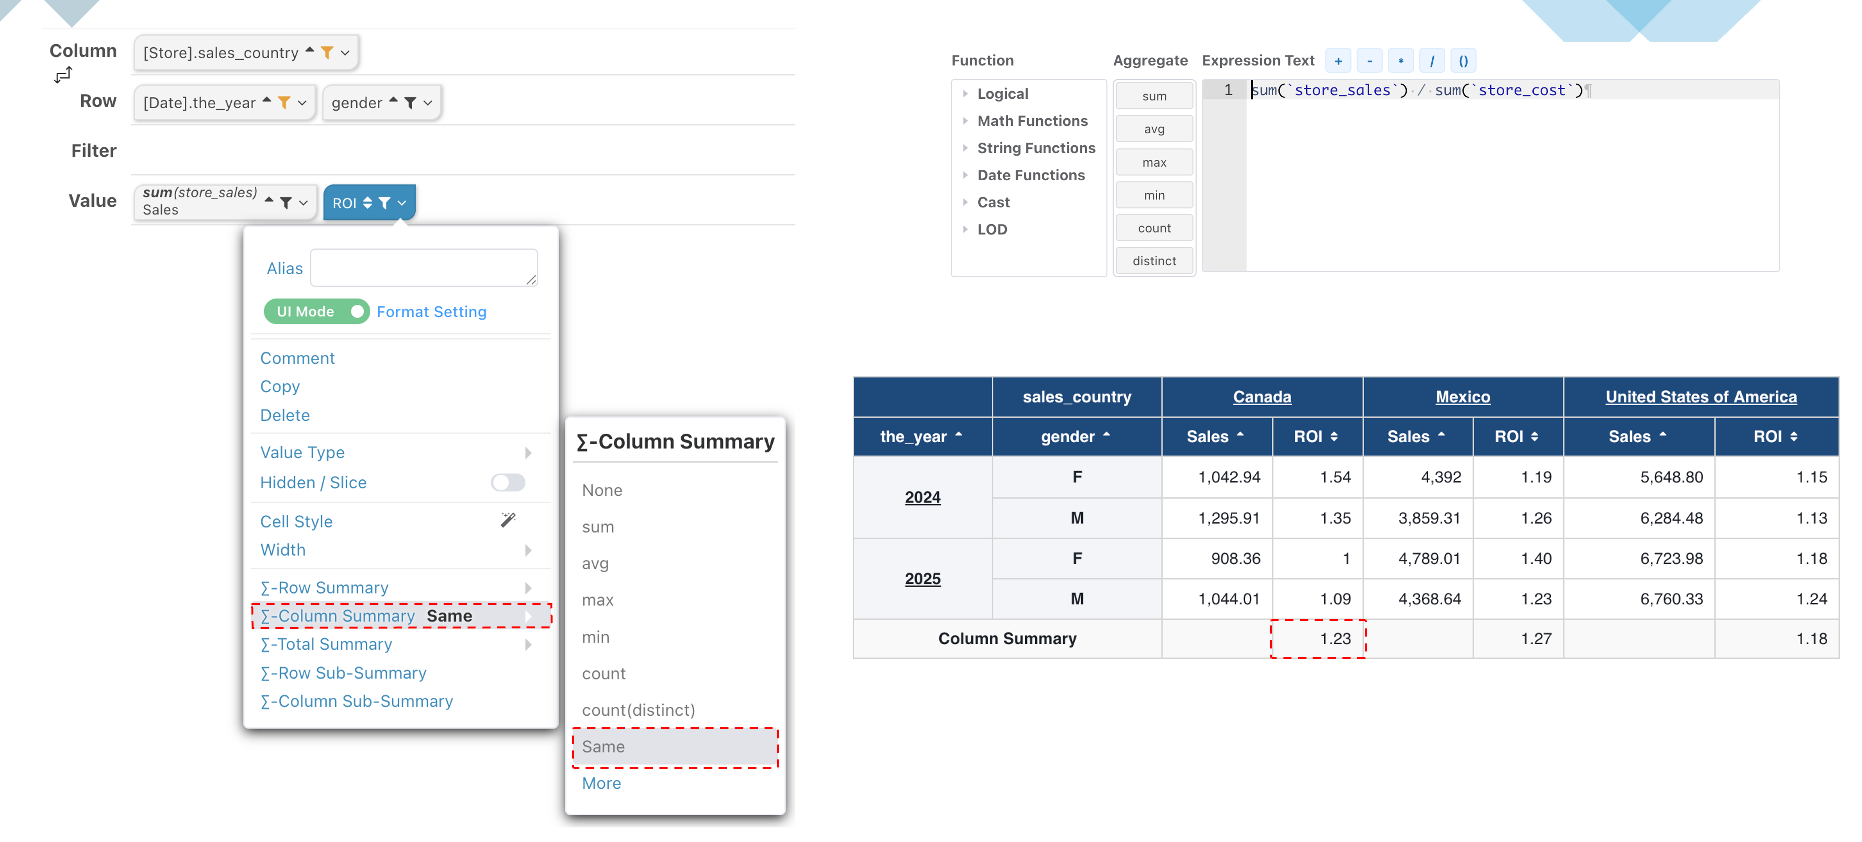
Pushed-Down Summaries Support Value Type Configuration
- Through summary calculation value type configuration, easily configure view calculations like summary percentages, YoY/MoM.
- For sum-type summary calculations, the engine does not automatically push down to data source. You can push down calculation via the data source aggregation switch. After enabling push-down, summaries support data type configuration.
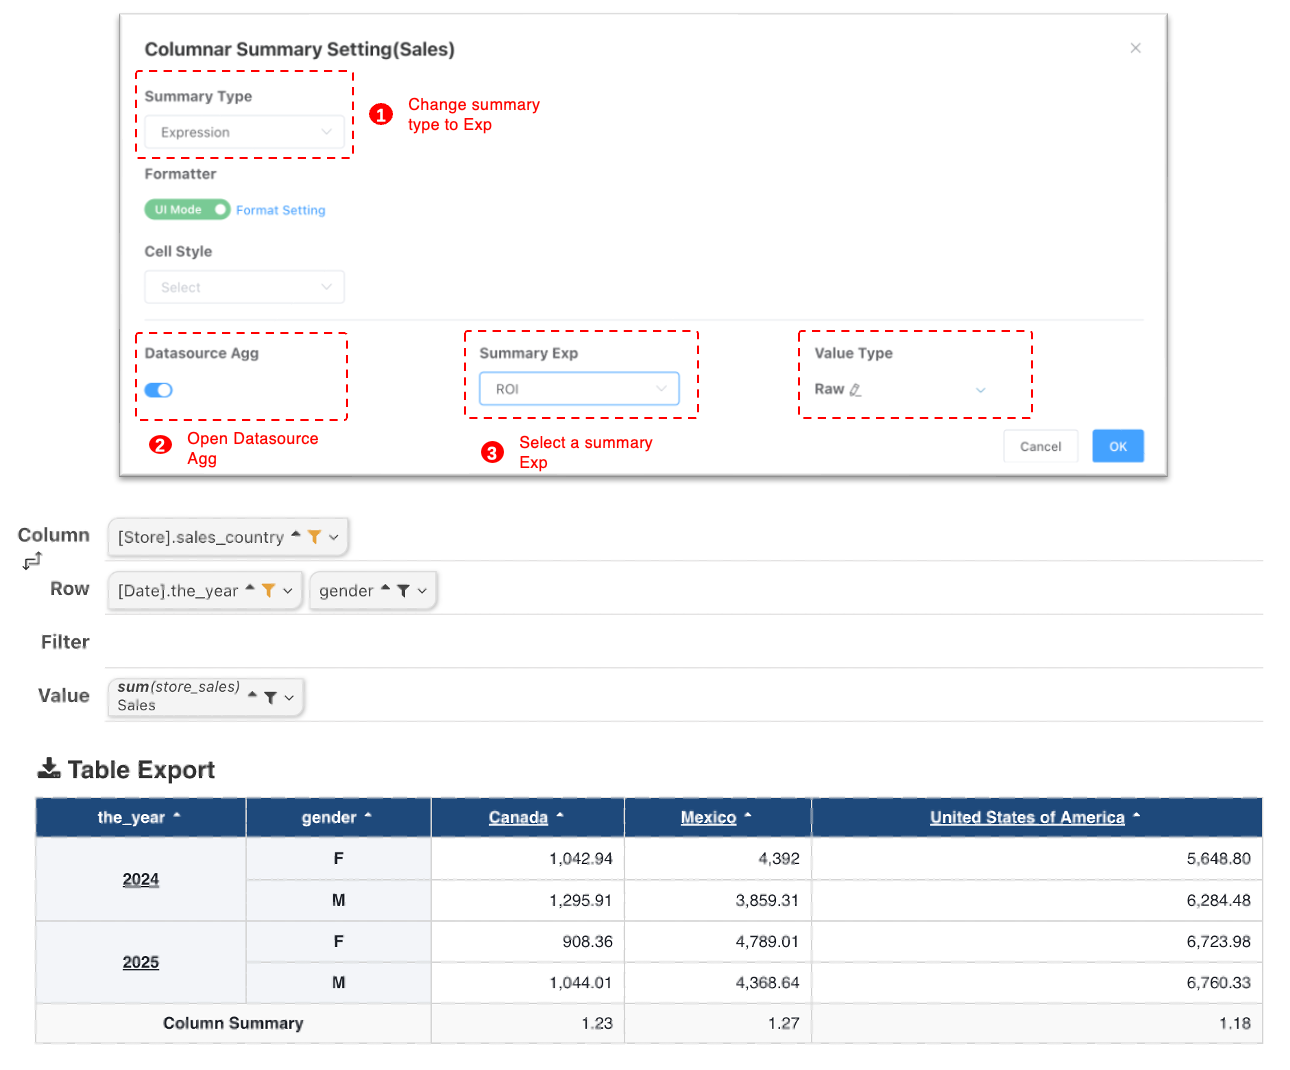
Preview Query Supports Multiple Queries
A cross-table with row summary, column summary, row subtotal, column subtotal, column summary intersecting row subtotal, column subtotal intersecting row subtotal, column subtotal intersecting row summary, grand total requires 9 queries.
Note
Therefore, when pushed-down summaries are not needed, try to configure using table result sets.