
Detail Table
Detail Table
Unlike Pivot Tables / Cross Tables, which have row headers and column headers forming a two-dimensional coordinate system to locate a unique (aggregated) value, a Detail Table with the same header conditions can query multiple records. Therefore, aggregation operations (sum/avg/min/max, etc.) are required in cross tables but not in detail tables.
When to Use a Detail Table
- Some users might wonder, "If a cross table uses all dimensions, the display effect would be the same as the output of a detail table."
- The results may look the same, but the data processing logic is entirely different, leading to significant query performance differences!
- Aggregate queries generate aggregate query statements based on the dimensions dragged by the user, execute aggregate calculations on the data source, and return aggregated data. Using a Cross Table solely to display detailed data forces an unnecessary aggregation operation on all dimensions for data that doesn't require aggregation. If the target result set is large, the database will consume substantial memory and CPU resources during aggregation and deduplication, causing unnecessary performance overhead, which becomes a serious issue. Therefore, many users unfamiliar with the system's working principles often complain about performance problems at this stage.
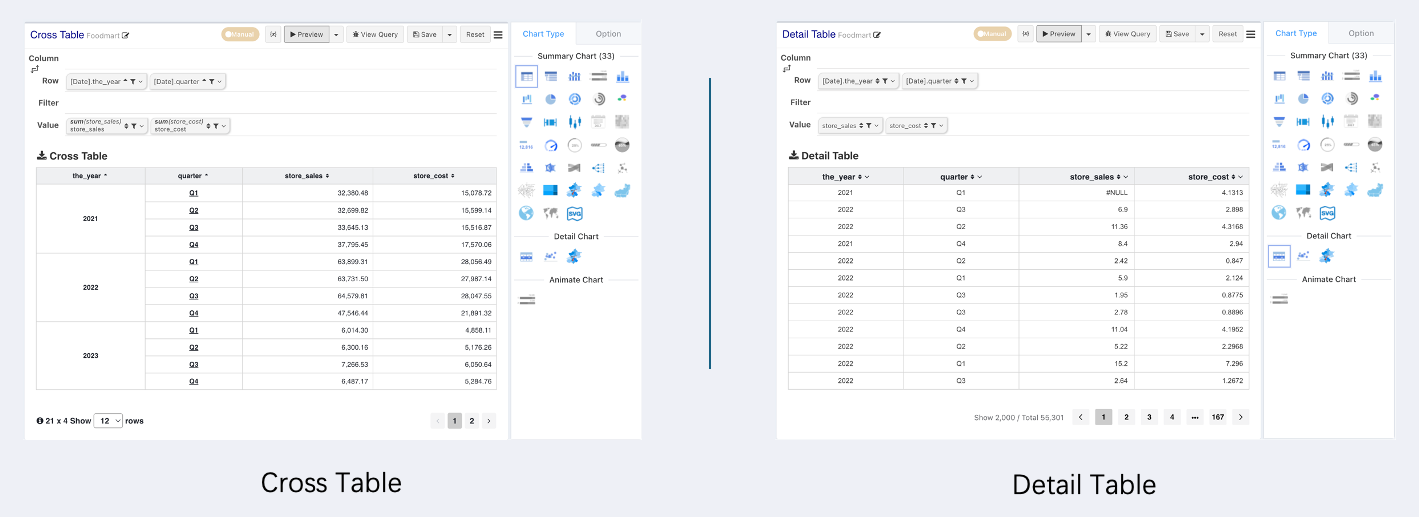
As shown below, when both the detail table and cross table are limited to the dimensions Year and Quarter, the detail table returns a large amount of unaggregated, duplicate data, while the cross table returns a result set aggregated across both dimensions.
Detail Table Pagination Issues
- The detail table queries the dataset directly on the backend, returning the first 2000 records by default. The frontend then paginates these 2000 records.
- The number of rows for detailed data can be configured in the chart configuration panel.
- Data export has no such limit and supports exporting up to 500,000 rows.
- For page display, it is recommended that users add dimension filters to query the specific detailed data they care about.
Configuring Multi-Level Headers in Detail Tables
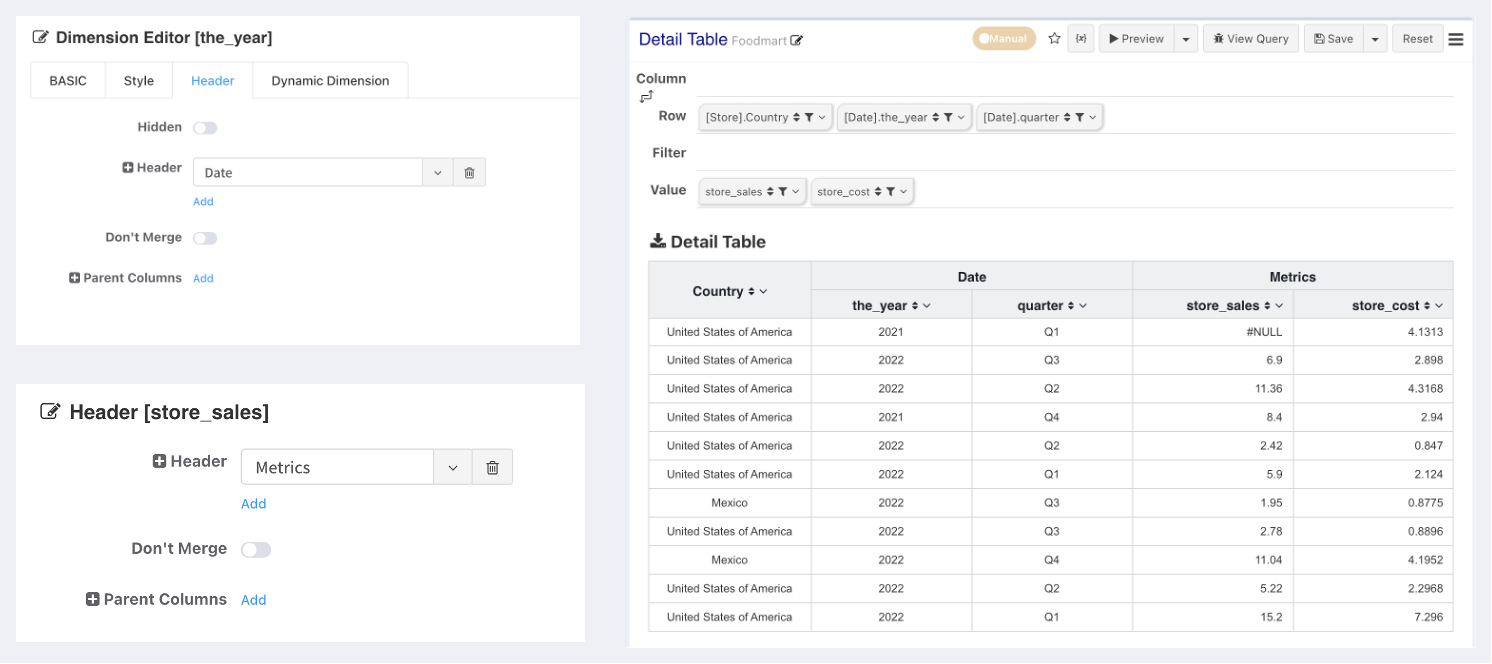
Detail table headers are static and support multi-level header configuration. Headers with the same parent are automatically sorted and merged, as shown below.
Row Merging in Detail Tables
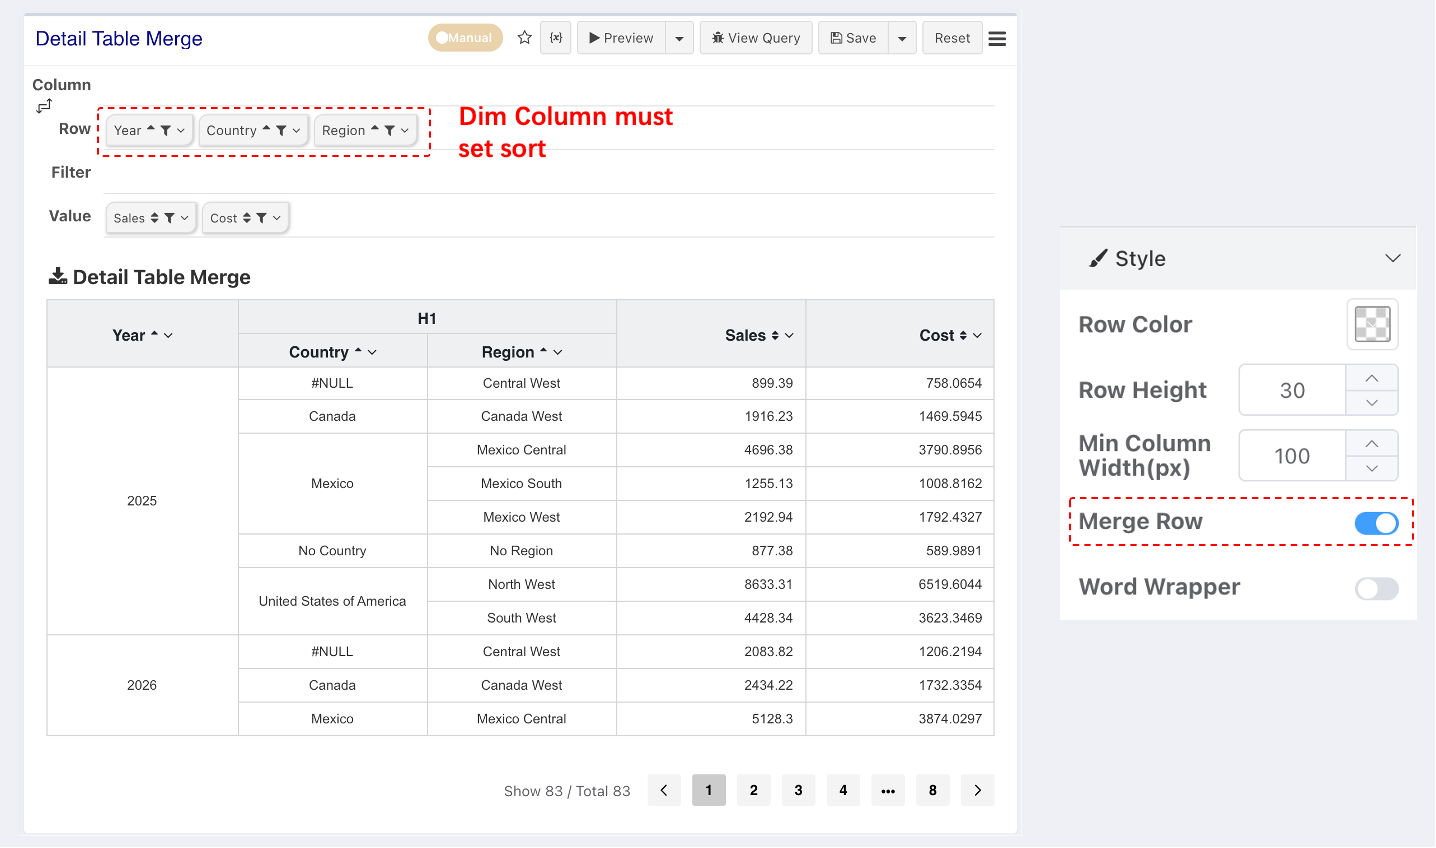
If your dataset consists of already aggregated summary data, using the row merging operation in a detail table can achieve an effect similar to merged headers in cross tables.
Note
Dimension cells that need to be merged must have a sort configuration.
Configuring Parent Cells for Merged Cells
Additionally, you can customize the parent column. For example, in the following business scenario, a parent order can be split into 2 child orders, but there is only one shipping cost that needs to be merged. The effect is as follows:
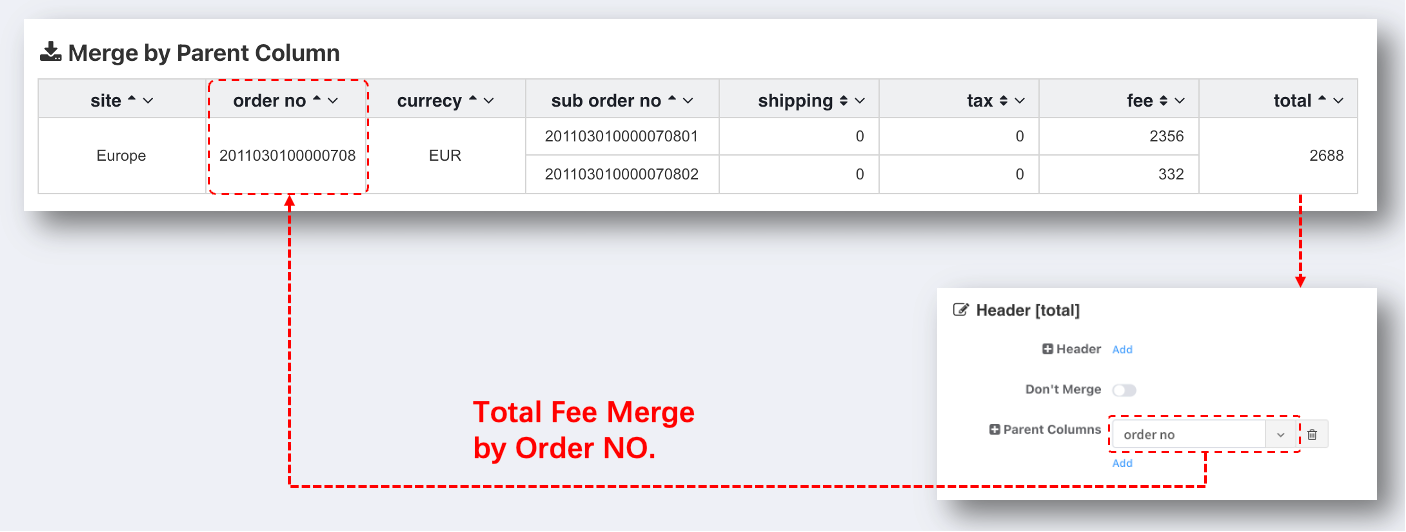
If we compare parent cells according to the requirement that parent cells must be the same, the merge would fail because the child orders are different. To solve this problem, you can modify the configuration:
- Specify Parent Column: Configure the parent cell for the
Totalto be theOrder No. Then only the user-specified column is compared for merging. - Don't Merge: Configuring the column to disable merging prevents any merge processing for that column.
Detail Table Cell Formatting
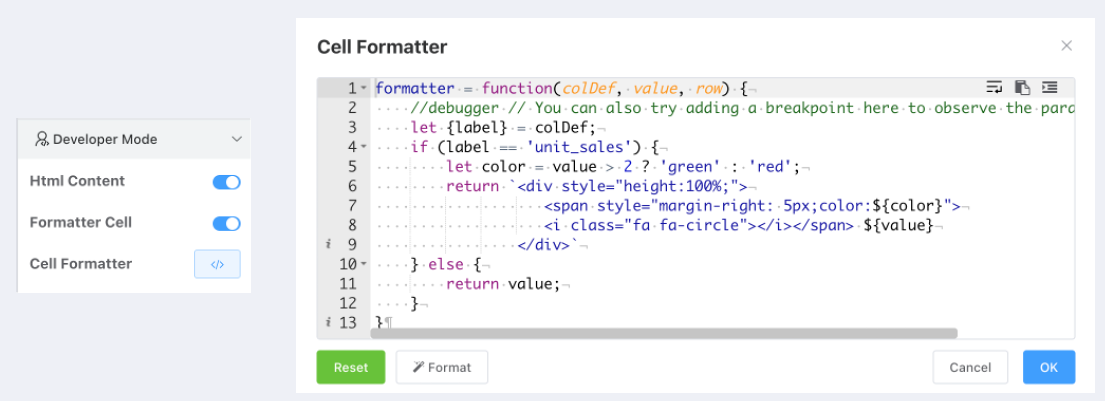
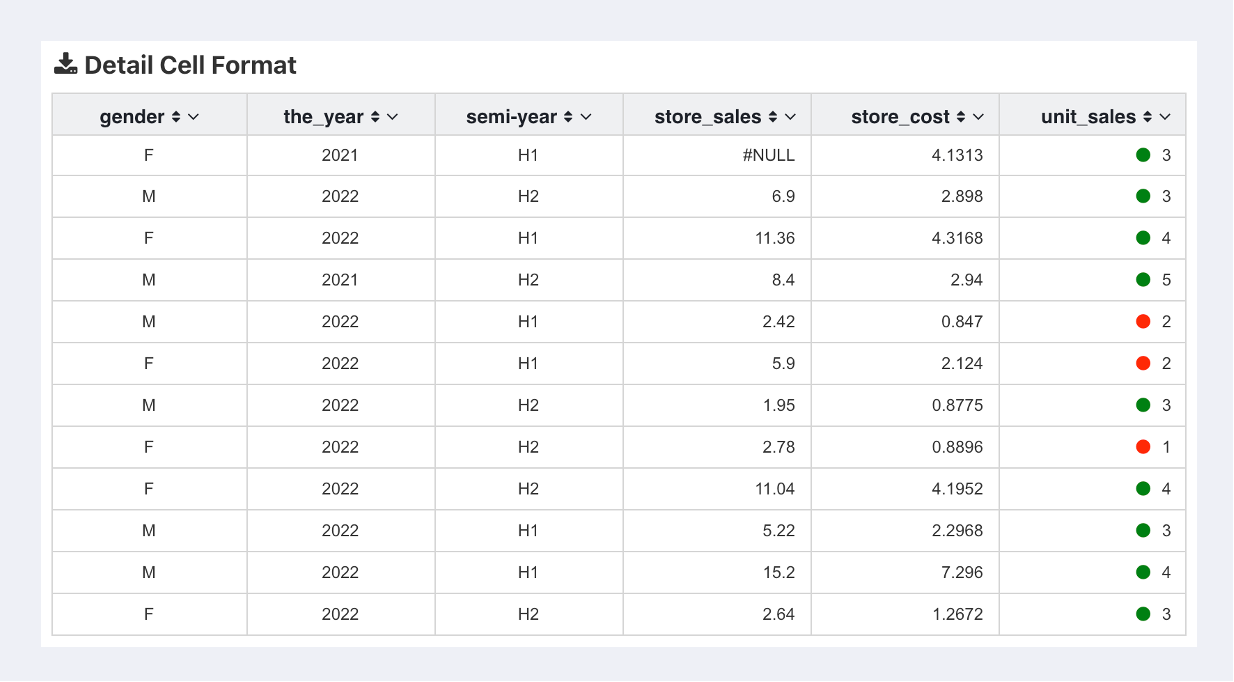
Example of a cell formatting function:
formatter = function(colDef, value, row) {
    debugger // You can also try adding a breakpoint here to observe the parameter structure
    let {label} = colDef;
    if (label == 'Expense') {
        let color = value > 2 ? 'green' : 'red';
        return `<div style={{height: "100%"}}>
                   <span style={{marginRight: "5px", color: "${color}}"}>
                   <i className="fa fa-circle"></i></span> ${value}
                </div>`
    } else {
        return value;
    }
}