
3D Map
3D Map
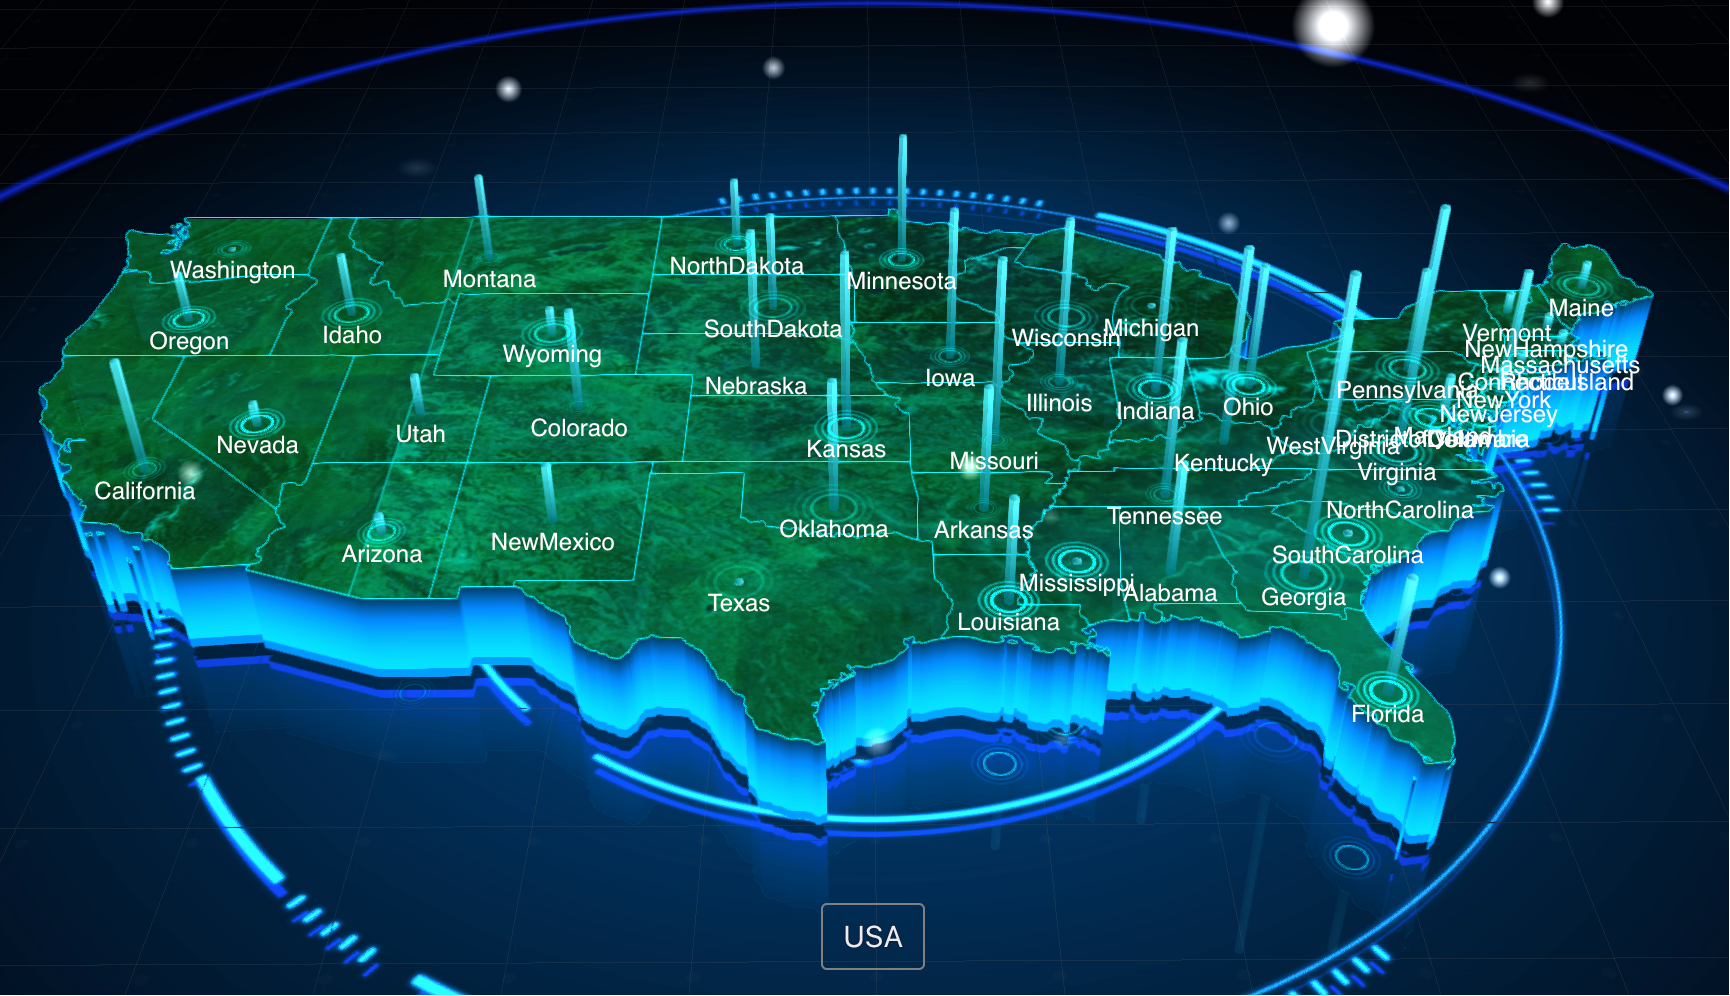
The 3D Map is an out-of-the-box 3D effect map control based on ThreeJS. Compared to flat maps, 3D scenes have the following pros and cons:
-
Advantages
- Better visual effects and aesthetics.
- Enhanced dynamic interactivity: Supports dynamic interactions like rotation, zooming, tilting the viewing angle, etc.
-
Disadvantages
- High performance requirements: Requires more powerful hardware (GPU) support for smooth operation, especially when displaying high-resolution models or large-scale scenes.
- Certain learning curve for users regarding 3D scene manipulation and perspective adjustment.
- Details in the 3D map may be excessive or even distracting for usage.
Data Configuration
| Map Type | Data Query Type | Mapping Method |
|---|---|---|
| 3D Map | Aggregated Data | Region Name, Flow Map (Region Name or Coordinates) |
- In 3D maps, the configuration for region markers and region light columns is similar to that of region maps.
- Flow maps and coordinate-based columns are similar to aggregated data latitude-longitude maps.
Region Drill-Down and Roll-Up
Region drill-down and roll-up function similarly to flat region maps. It requires having hierarchical dimensions corresponding to the map's administrative levels. After enabling region auto-adapt, clicking on a region for drill-down limits the data to the clicked area, and the map layer automatically changes based on that region.
Style Configuration
Display Type Configuration
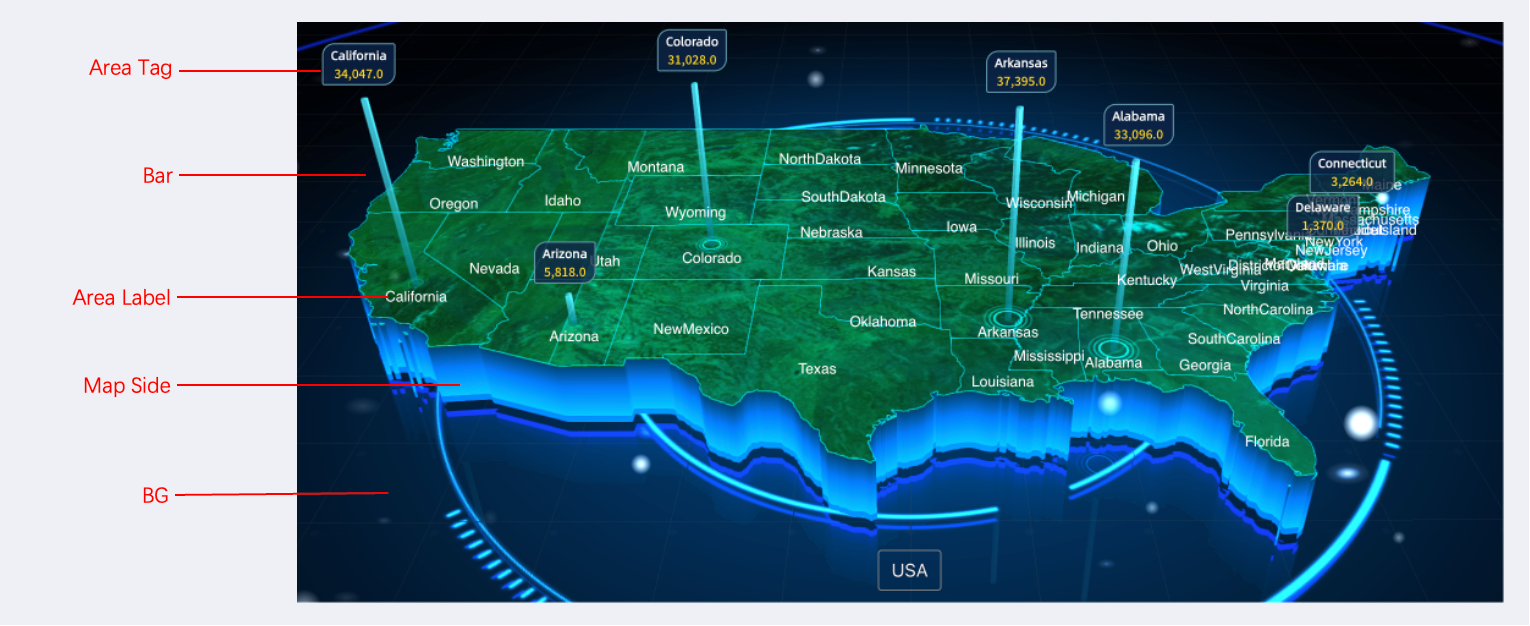
Area Bar
Select Area Bar as the display type. Choose the region name field for the row dimension data.
Area Label
Select Area Labels as the display type. Choose the region name field for the row dimension data. The difference from Area Bar is that light columns are not displayed.
Map Region Auto-Adaptation
For Area Bar and Region Markers, if multiple dimensions are configured in the row dimensions and the non-last dimensions have only one value, the region will auto-adapt based on the preceding dimensions.
Mark Line Map
Data Type
| Data Type | Explanation | Configuration |
|---|---|---|
| Name | Administrative region name, e.g., Washington | Row dimension place [Source Name] + [Target Name] + [Extra Info] |
| Longitude & Latitude (Separate) | Separate latitude and longitude, e.g., Longitude: 121.47, Latitude: 31.23 | Row dimension place [Source Long] + [Source Lat] + [Target Long] + [Target Lat] + [Extra Info] |
| Longitude & Latitude (Combined) | Combined latitude and longitude: e.g., 121.47,31.23 | Row dimension place [Source Long,Source Lat] + [Target Long,Target Lat] + [Extra Info] |
Coordinate-Based Columns
Coordinate-based columns work on the same principle as aggregated data latitude-longitude maps, mapping summarized data onto the map based on geographical coordinates.
- Difference from Region Map: It does not consider administrative boundaries. All mapping is based on latitude and longitude coordinates on the map.
- Even if the data type is a place name, it will eventually be converted to latitude and longitude before being mapped.
- Latitude-longitude maps do not support region drill-down.
Data Type
| Data Type | Explanation | Configuration |
|---|---|---|
| Name | Administrative region name, e.g., Shanghai | Row dimension place [Geographic Name] + [Extra Info] |
| Longitude & Latitude (Separate) | Separate latitude and longitude, e.g., Longitude: 121.47, Latitude: 31.23 | Row dimension place [Longitude] + [Latitude] + [Extra Info] |
| Longitude & Latitude (Combined) | Combined latitude and longitude: e.g., 121.47,31.23 | Row dimension place [Longitude,Latitude] + [Extra Info] |
Why Can Names Be Used for Latitude-Longitude Mapping?
Q: For latitude-longitude mapping, there is a Name option in the data configuration?
A: We have a built-in dictionary of city latitude-longitude coordinates, making it convenient to use the latitude-longitude map even when only city names are available. Using city names for data mapping requires manually aggregating the data.