Easy Pivot Logo
  • Pricing

Manual

OverviewFolder SystemData Sources
Insight
Cross-Table / Pivot TableColumn / Line ChartAxis Style ConfigurationRadial BarPie ChartSunburst ChartTreemapMetric CardRanking BarBullet ChartWaterfall ChartBubble ChartFunnel ChartBoxplotCandlestick ChartHeatmapCircular Progress BarLiquid FillGaugeContrast Bar ChartRadar ChartSankey DiagramTree DiagramRelation DiagramWord CloudSVG MapArea MapAggregate Data Map3D MapDetail TableScatter Plot (Detailed Data)Latitude-Longitude Map (Local)Dynamic Ranking Bar Chart
Drill-down, Roll-upChart Fine-tuning Developer Mode
User and RoleRestful Interfaces

Integration

ChartsChart Detail

Tree Diagram

Tree Diagram

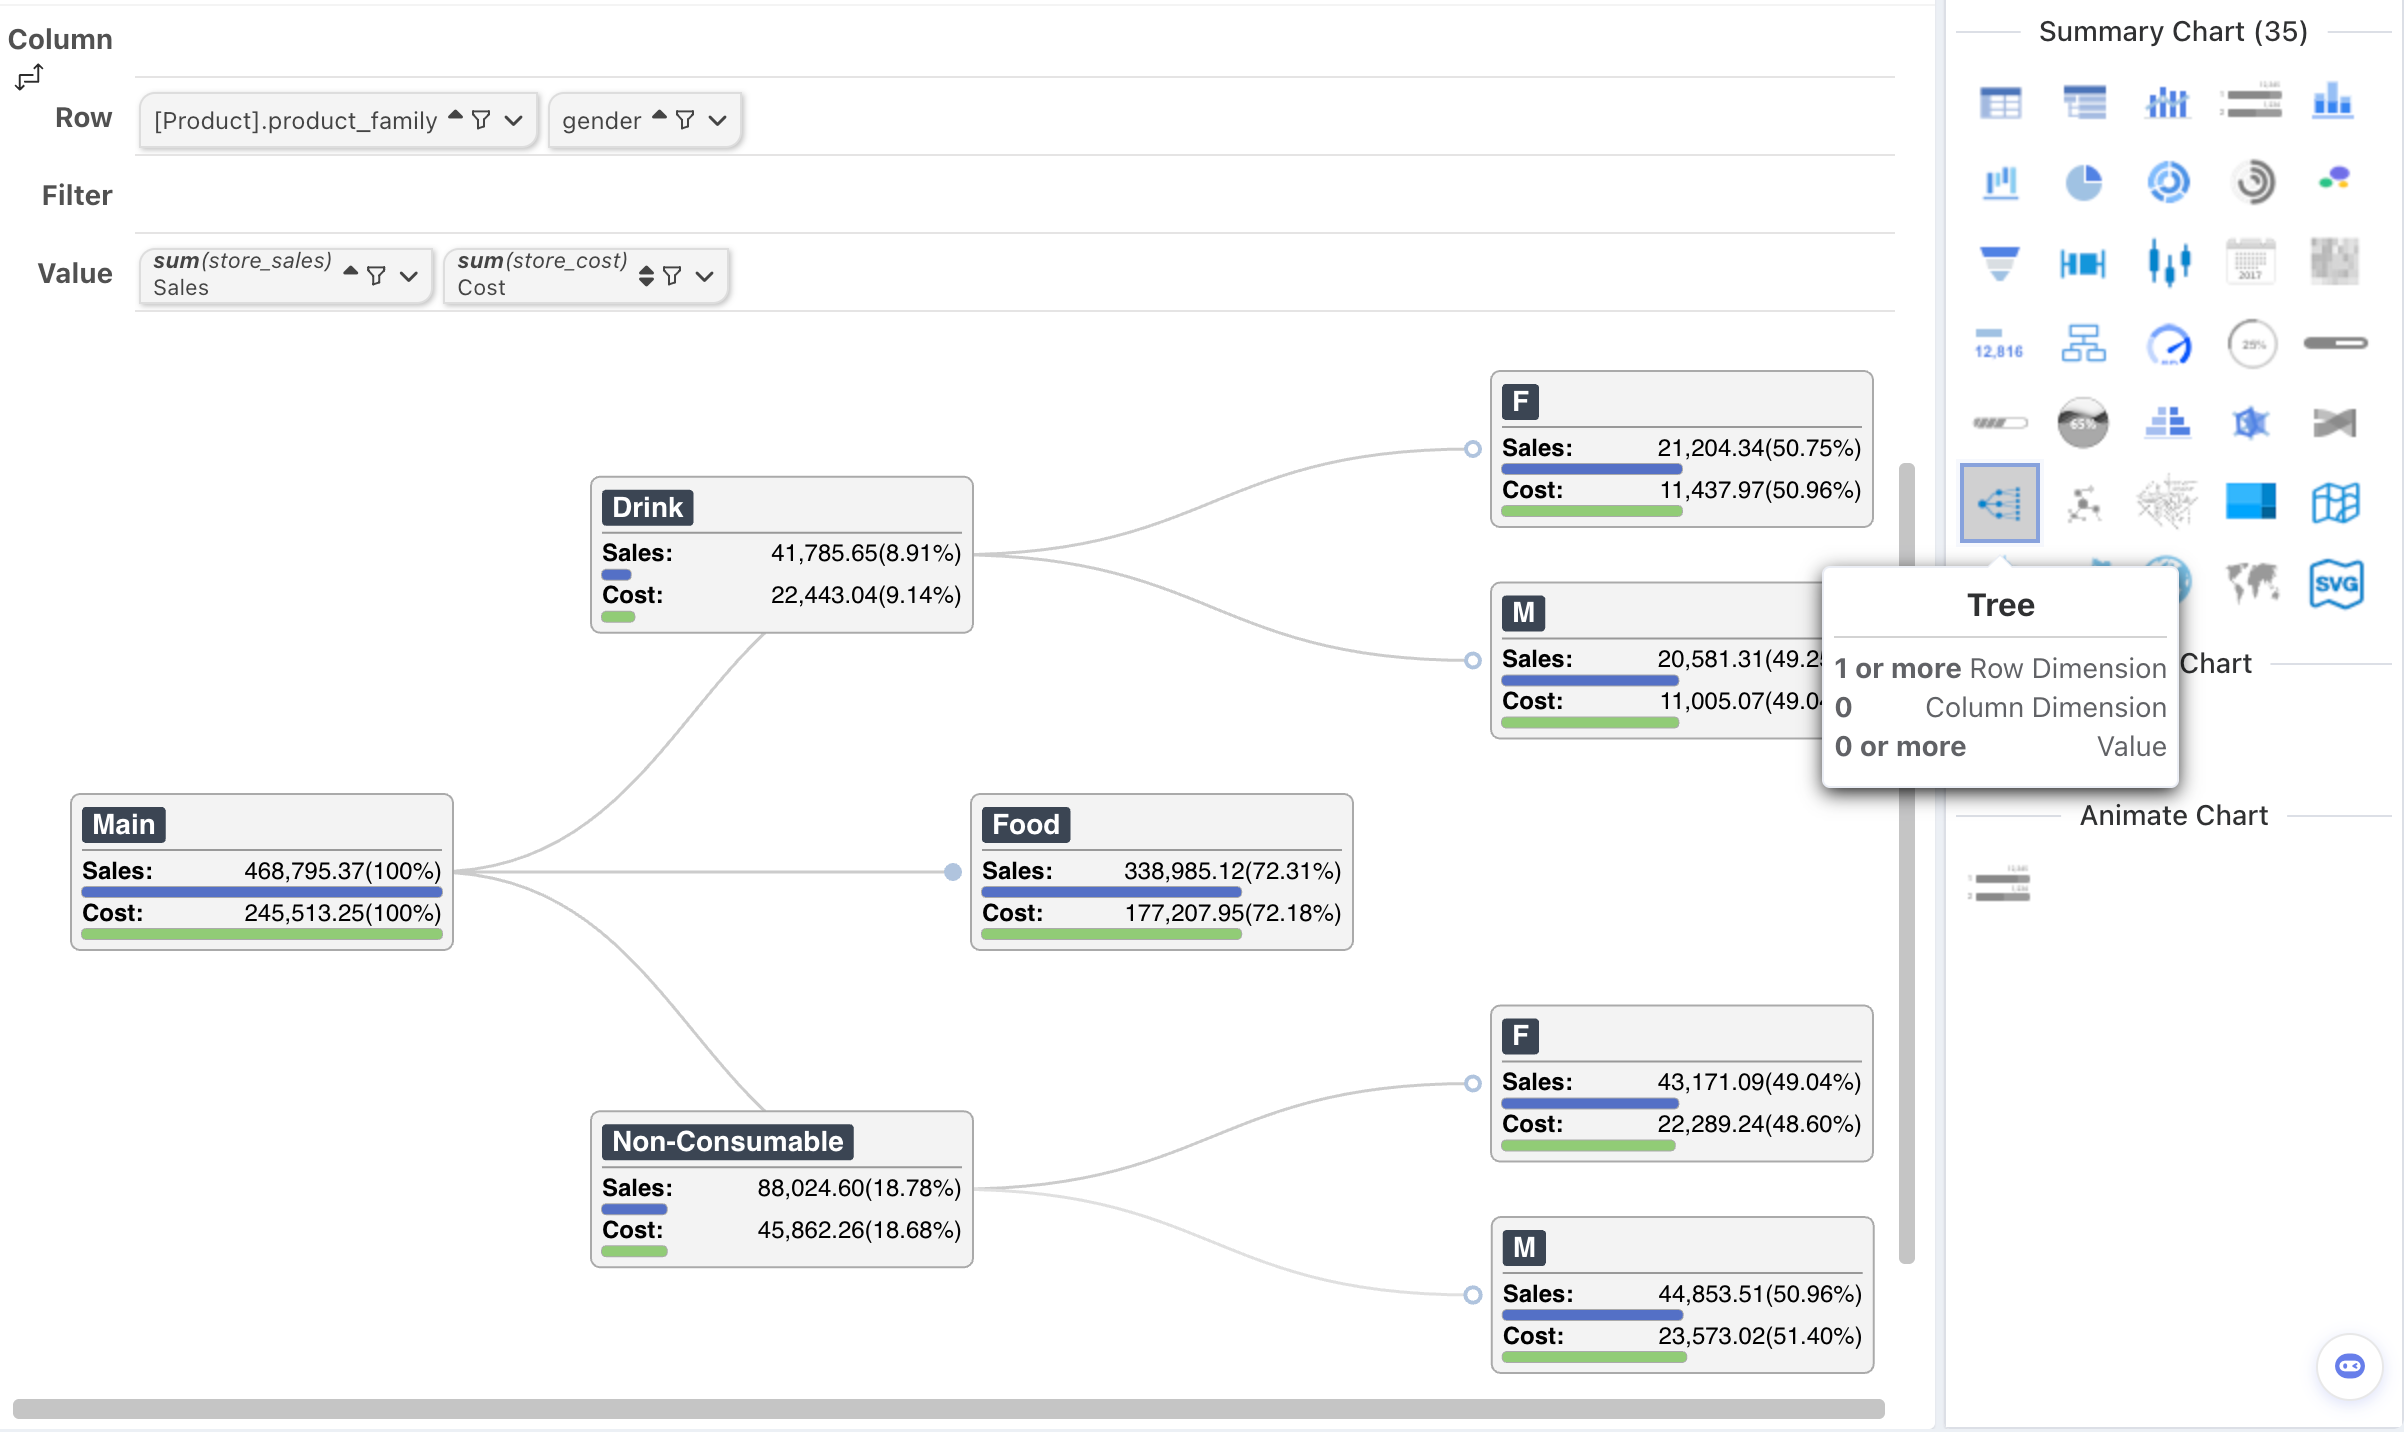
The tree diagram draws a tree based on the hierarchical structure of row dimensions. It can have zero or more metrics. Hierarchical nodes can aggregate the metric values of their child nodes. Currently, only the sum aggregation of child nodes is supported.

Design AreaChartRequirement
Row DimensionsTree LevelPlace 1 or more dimension nodes
Column Dimensions0Not Supported
MetricsWeightPlace 1 or more metric node

Sankey Diagram

Sankey Diagram

Relation Diagram

Relation Diagram

Log InStart Free