ChartsChart Detail
Word Cloud
Word Cloud
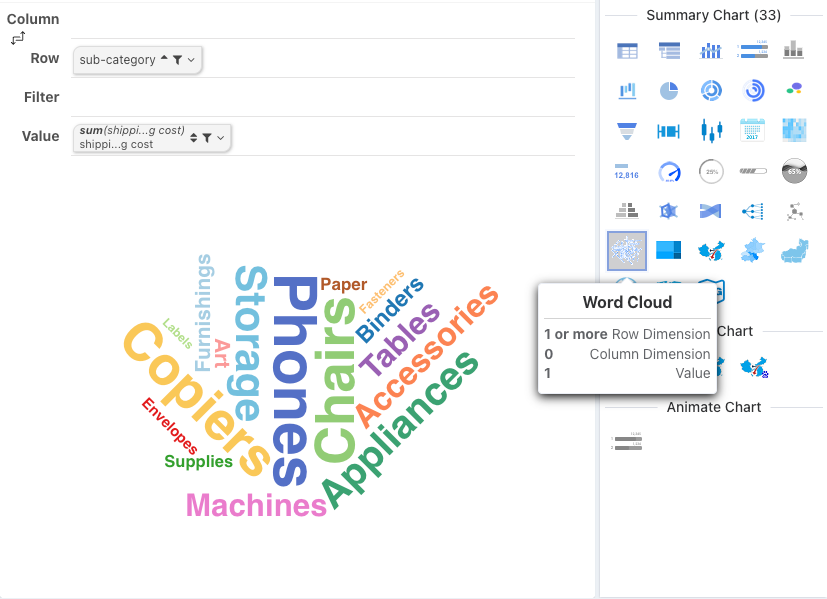
A word cloud chart is used to visually display the frequency or importance of keywords. It is suitable for application in fields such as marketing, academic research, and business analysis. For example, creating user personas, clustering users, and achieving refined marketing. This article explains how to add data and configure styles for a word cloud chart.
| Design Area | Chart Element | Requirement |
|---|---|---|
| Row Dimension | Words | Place 1 or 2 dimension nodes |
| Column Dimension | None | 0 |
| Metric | Weight | Place 1 metric node |
Word Splitting Configuration
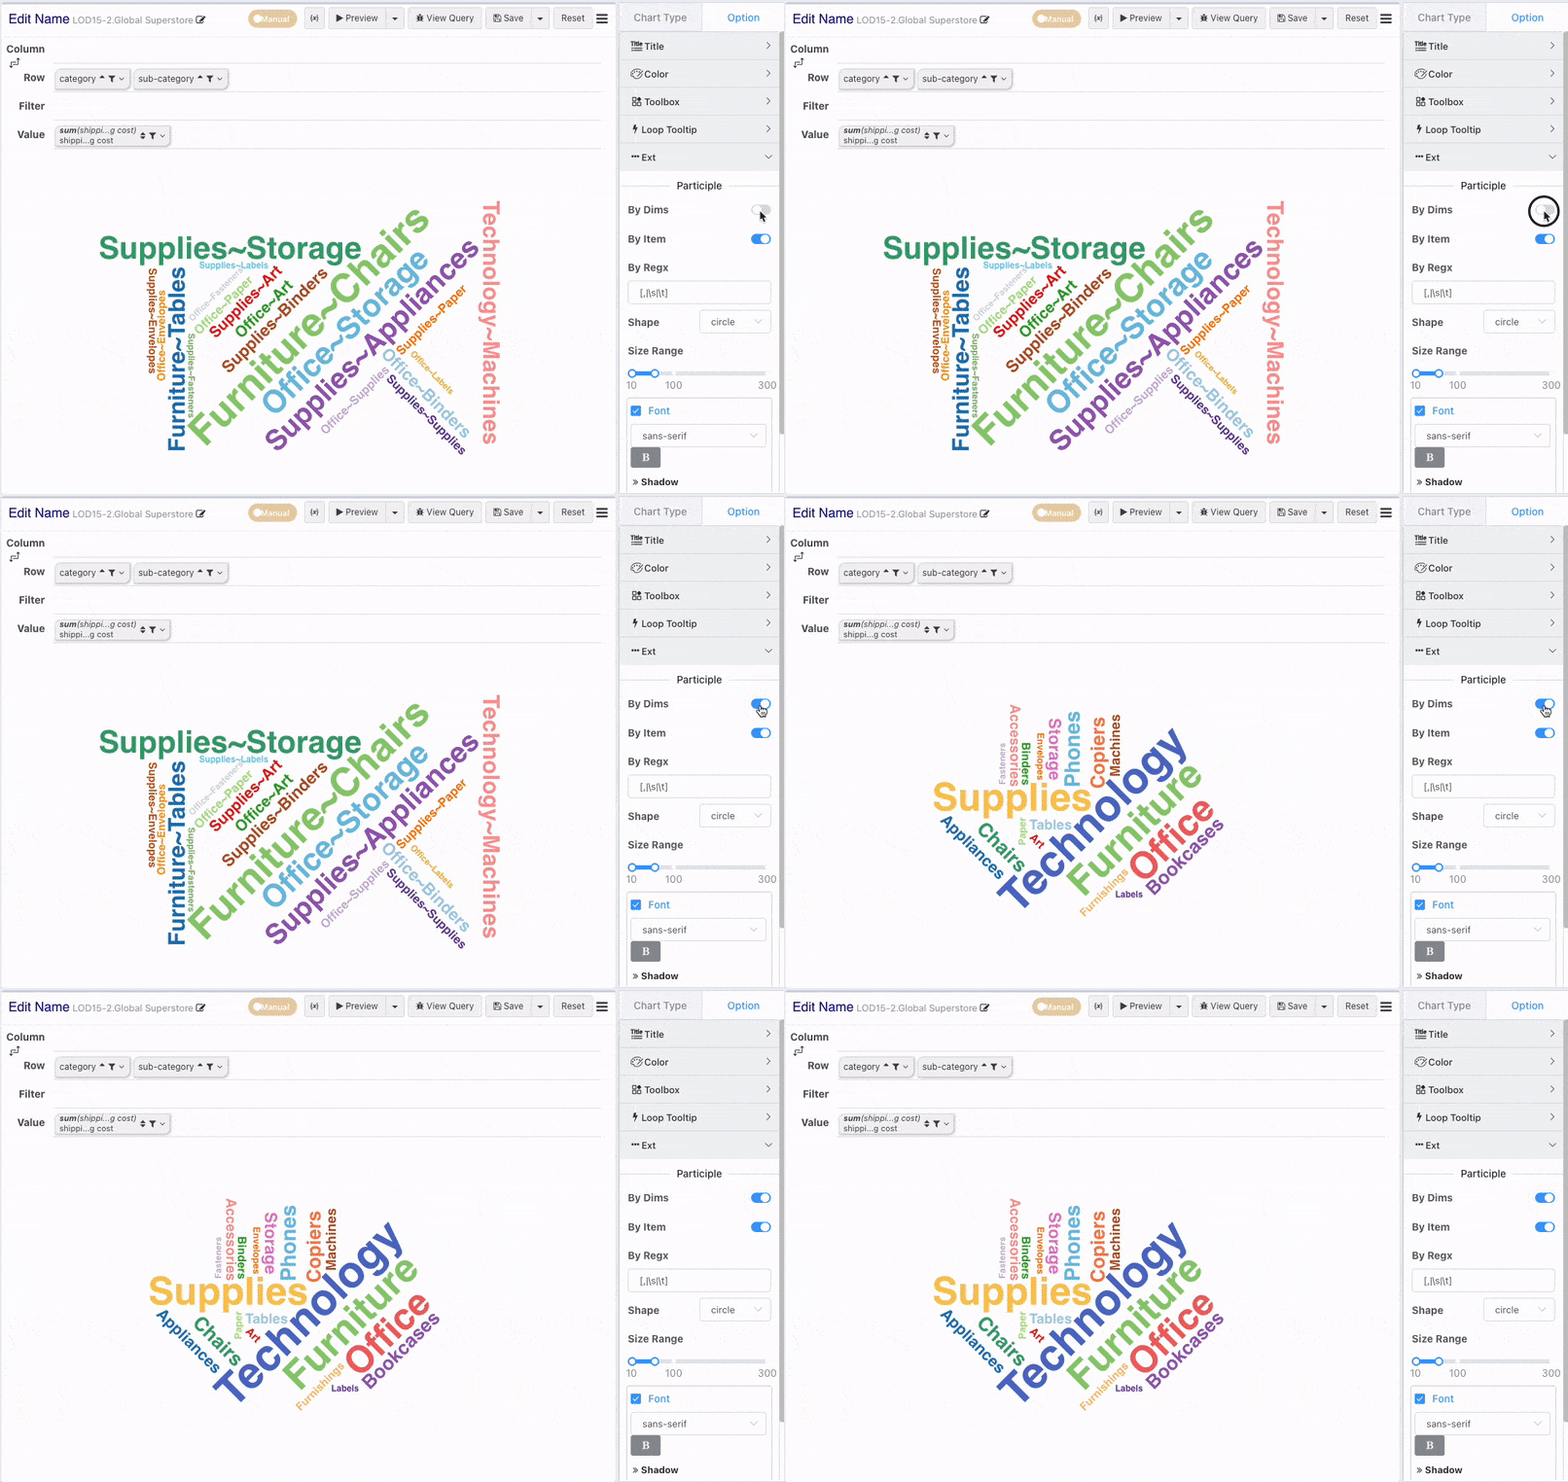
Dimension Splitting
- Without dimension splitting enabled: Each combination of elements on the row dimension is treated as a single keyword.
- With dimension splitting enabled: Each element on the row dimension is independently counted as a keyword.
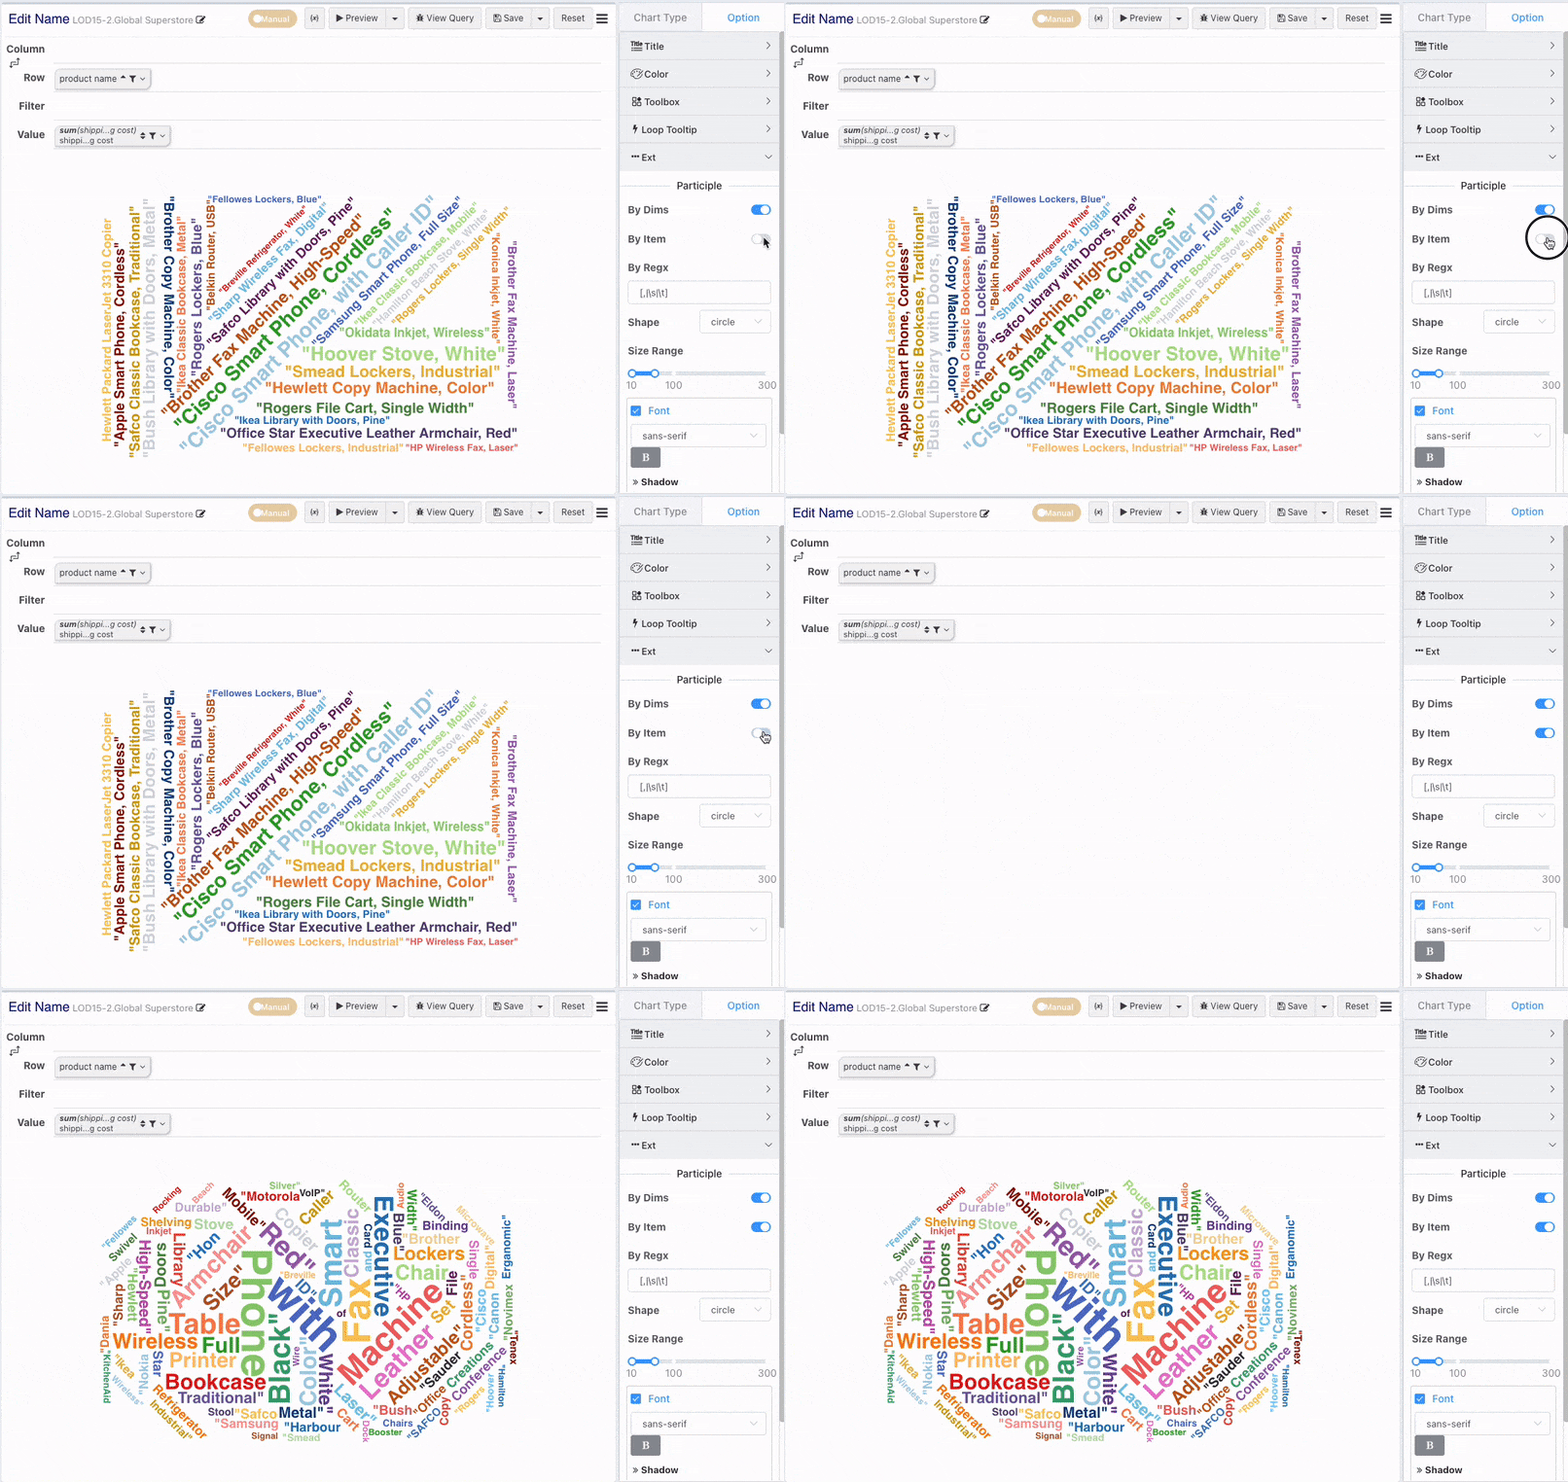
Item Splitting
Item splitting divides a string of keywords within a dimension into multiple parts based on regular expressions. For example: 'HP printer, white' splits into three keywords: [HP, printer, white]
- The default regex splitting rule is:
[,|\s|\t], which splits on English commas, spaces, and Tab symbols. - If you need to split by a single symbol, you can adjust the splitting regex, such as:
,: Split by comma.,: Split by Chinese comma.\s+: Split by one or more spaces.
[,|\s|\t]: Each element within the brackets separated by|allows splitting by multiple keywords.