Scatter Plot (Detailed Data)
Scatter Plot (Detailed Data)
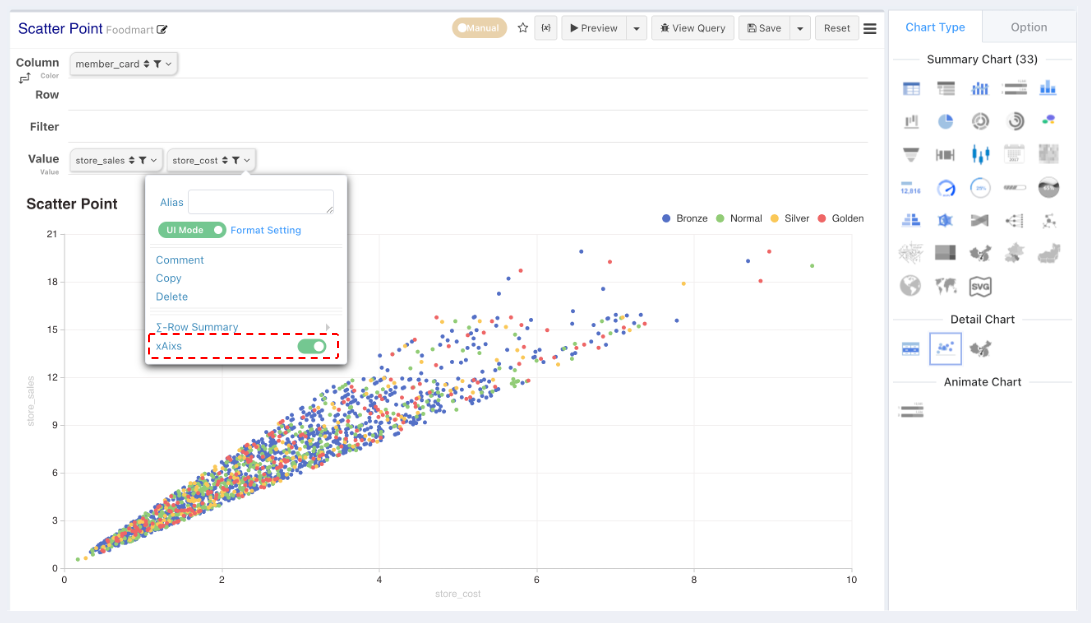
The scatter is also a type of chart that does not require data aggregation. The same feature as the bubble chart is that both the x-axis and y-axis of the scatter plot can be either metrics or dimensions.
Scatter plots are created based on detailed data. When the x-axis and y-axis are selected, the first and second columns of the detailed data table are used as the x-axis and y-axis by default. The axis value type defaults to row dim.
When using dim as the axis value type, the backend needs to calculate and deduplicate all values on the axis, which incurs some overhead. If the value type is Numeric, only the maximum and minimum values need to be calculated. Please configure the axis value type based on the actual situation.
If column dimensions are configured, they will be combined and used as scatter plot categories.
Dimension and Metric Configuration Mapping
- Column dimensions default to classification attributes (color)
- When there is only one metric and one row dimension, the row dimension serves as the x-axis and the metric as the y-axis
Considering performance issues and the risk of misoperation, the scatter plot also has a default limit of 2000 returned records.