ChartsChart Detail
Sunburst Chart
Sunburst Chart
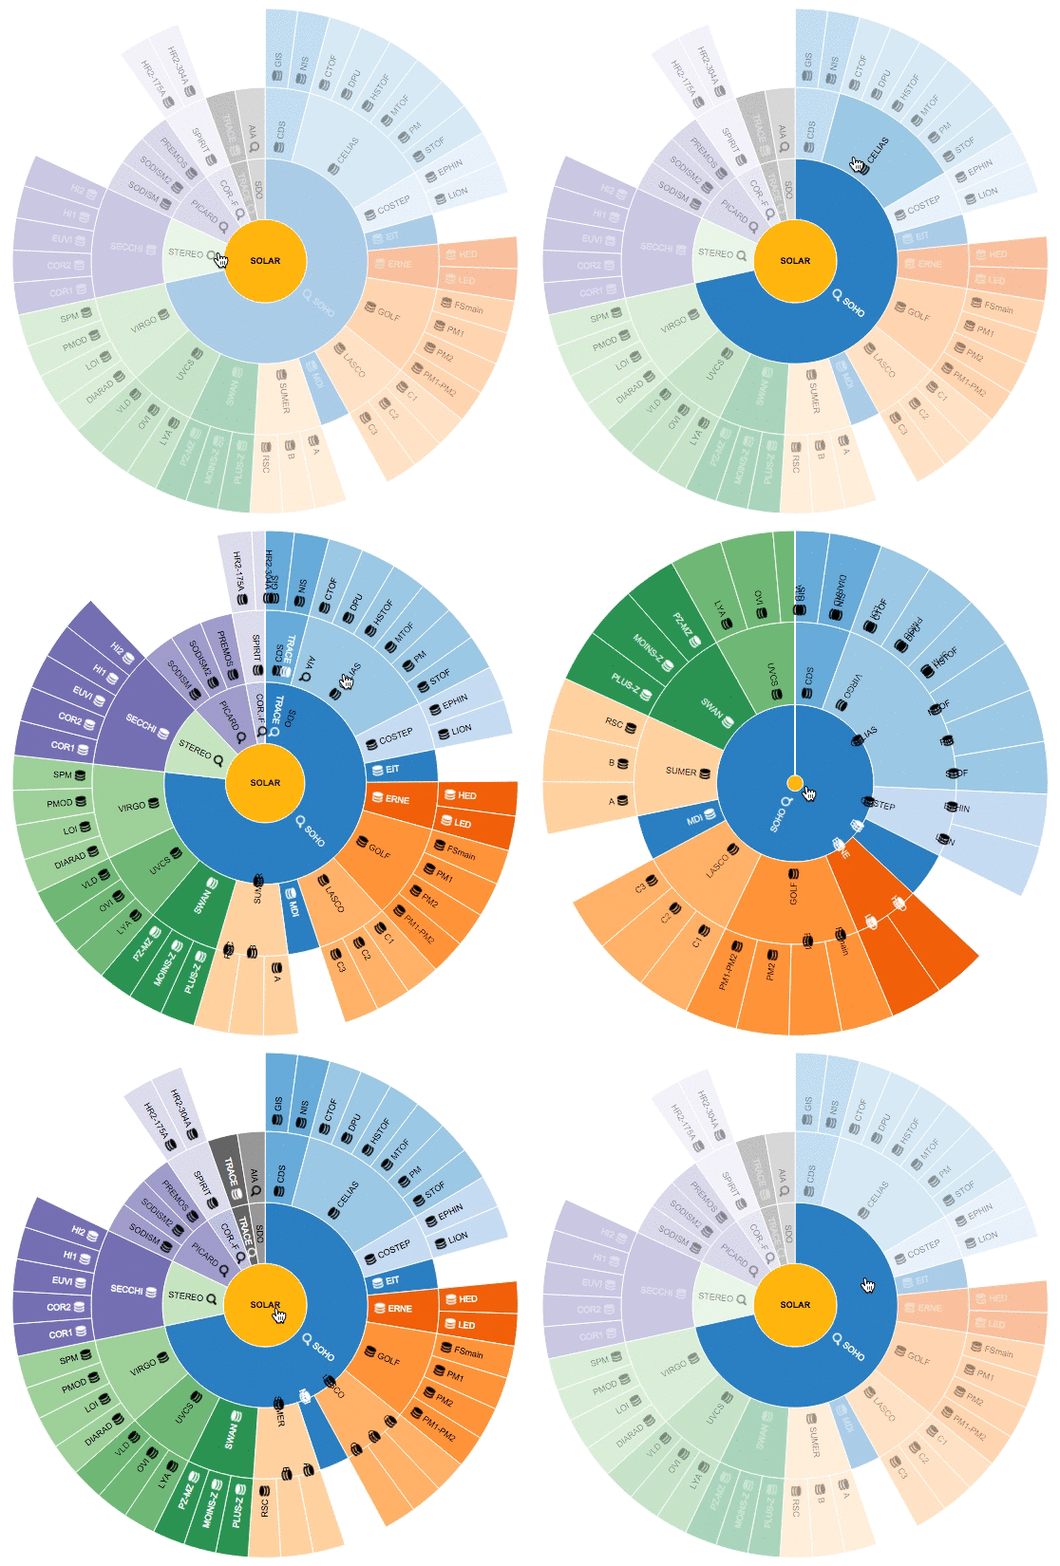
The Sunburst chart, also known as a multi-level pie chart, is suitable for scenarios that require an intuitive representation of "from whole to part" or "top-down hierarchical breakdown." When paired with interactive features, as shown in the image below, it is particularly well-suited for exploratory chart reading.
- Analysis of Hierarchical Structures
- The Sunburst chart is most suitable for displaying data with clear hierarchical structures.
- Examples: Enterprise organizational charts, analysis of subcategories within classified data.
Use Cases:
- Product Category → Subcategory → Sales Distribution
- Country → Province → City → Population or Income
Configuration Requirements
| Design Area | Chart Element | Requirement |
|---|---|---|
| Row Dimension | Hierarchy | Place multiple dimension nodes. The number of dimension nodes determines the chart's hierarchy levels. |
| Column Dimension | Split | Place 0 or more dimension nodes. |
| Metric | Place 1 or more metric nodes. |
Configuring Level Styles
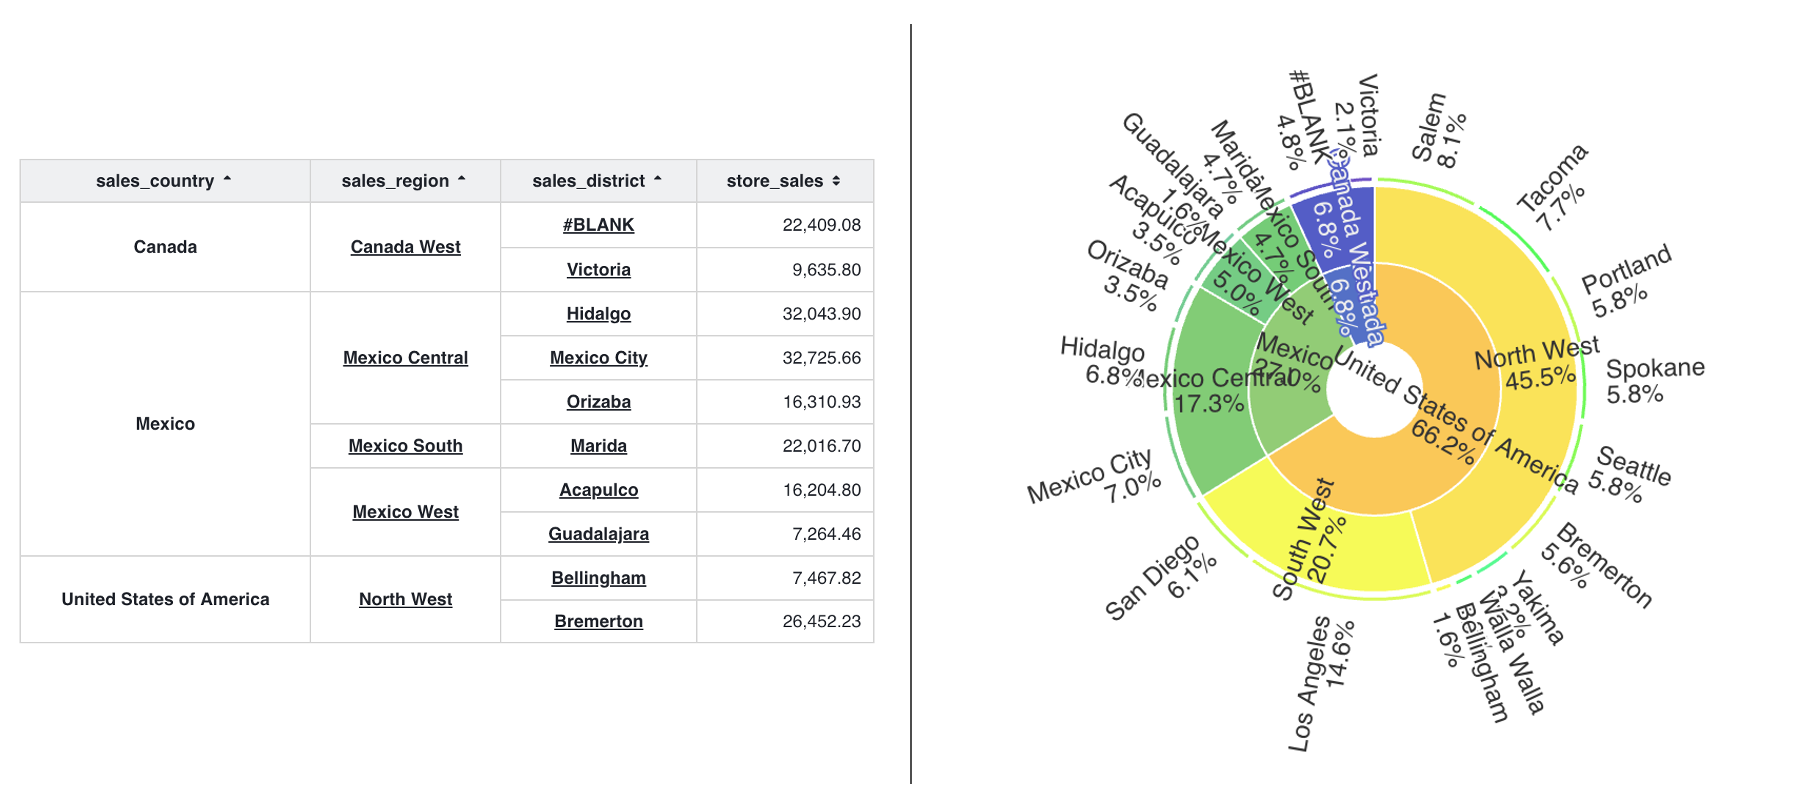
In the Style configuration panel, after enabling custom levels, you can configure each level independently:
- Inner radius, outer radius
- Label direction, position