ChartsChart Detail
Candlestick Chart
Candlestick Chart
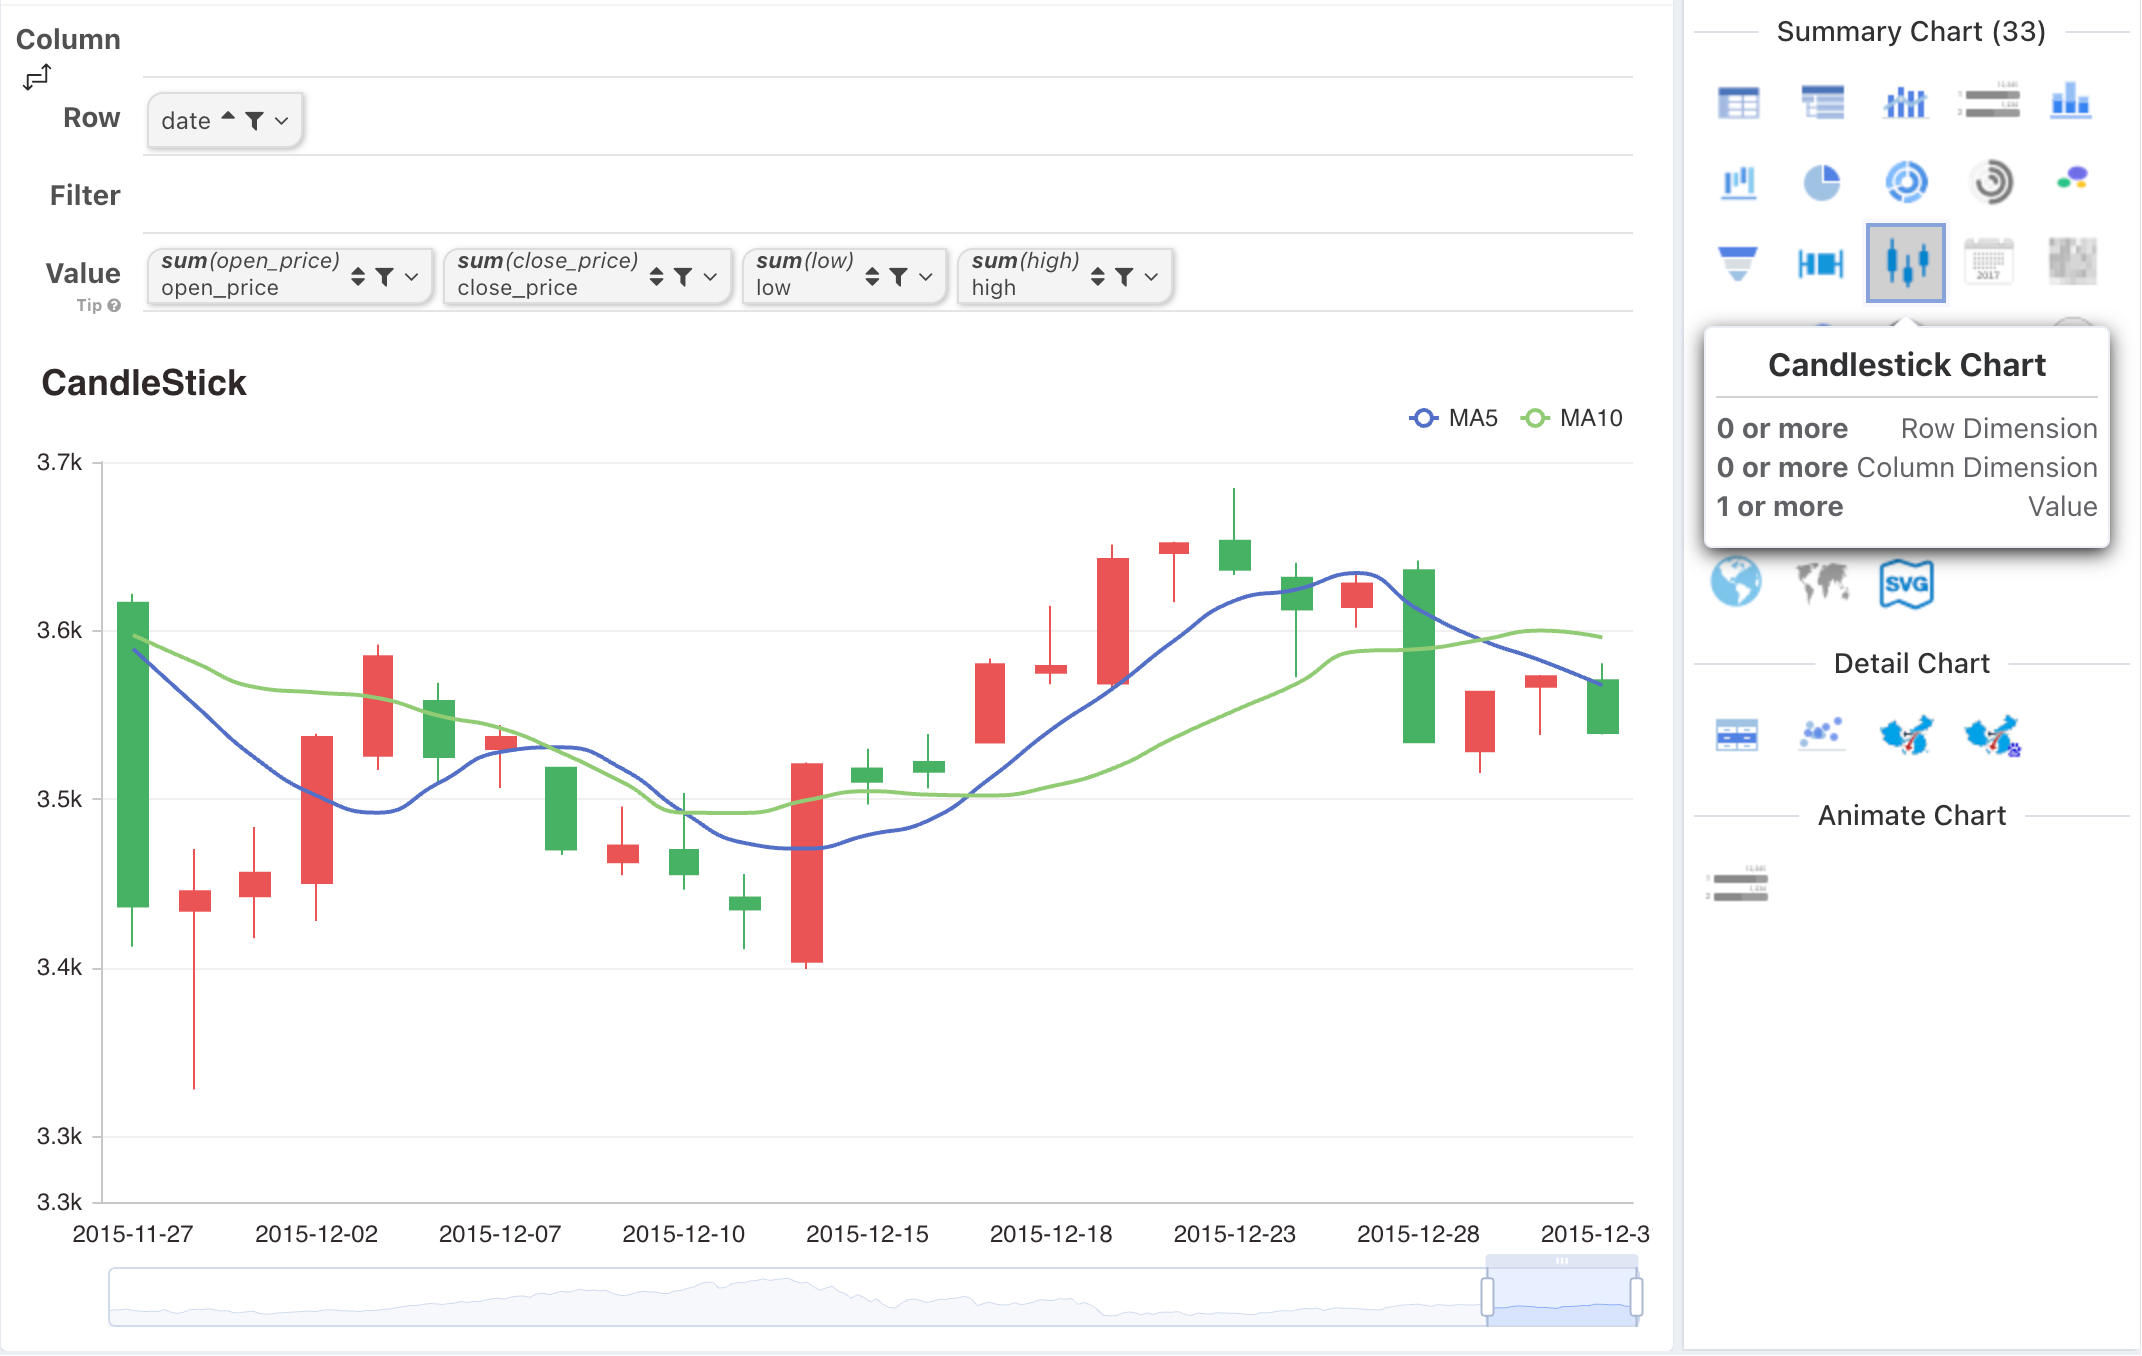
- Drawing a standard Candlestick chart requires four key metrics: Opening Price, Closing Price, Highest Price, and Lowest Price.
- If the data contains fewer than four metrics, the system will duplicate the last available metric to ensure the completeness of data required for the Candlestick chart.
- We recommend using directly calculated results to draw the Candlestick chart to ensure accuracy and performance.
- If computational performance allows, you can also use the Calculated Field function based on raw data, calculating opening and closing prices by grouping according to row dimensions and sorting by time, thereby generating the Candlestick chart. This method allows for more flexible data handling and is suitable for more complex analysis scenarios.
Moving Average Configuration
Moving averages in a Candlestick chart are a commonly used tool in technical analysis for observing price trend directions of financial products such as stocks, futures, and forex. Moving Average (MA) represents the average price over a certain period, smoothing price fluctuations and indicating trend direction.
Main Features
- Calculation Method The moving average is calculated by taking the average closing price over a specific past period (e.g., 5 days, 10 days, 20 days, etc.) and connecting these averages into a line.
- Common moving averages include: • Short-term MA: e.g., 5-day MA (MA5), 10-day MA, reflecting short-term trends. • Medium-term MA: e.g., 20-day MA, 50-day MA, reflecting medium-term trends. • Long-term MA: e.g., 120-day MA, 200-day MA, reflecting long-term trends.
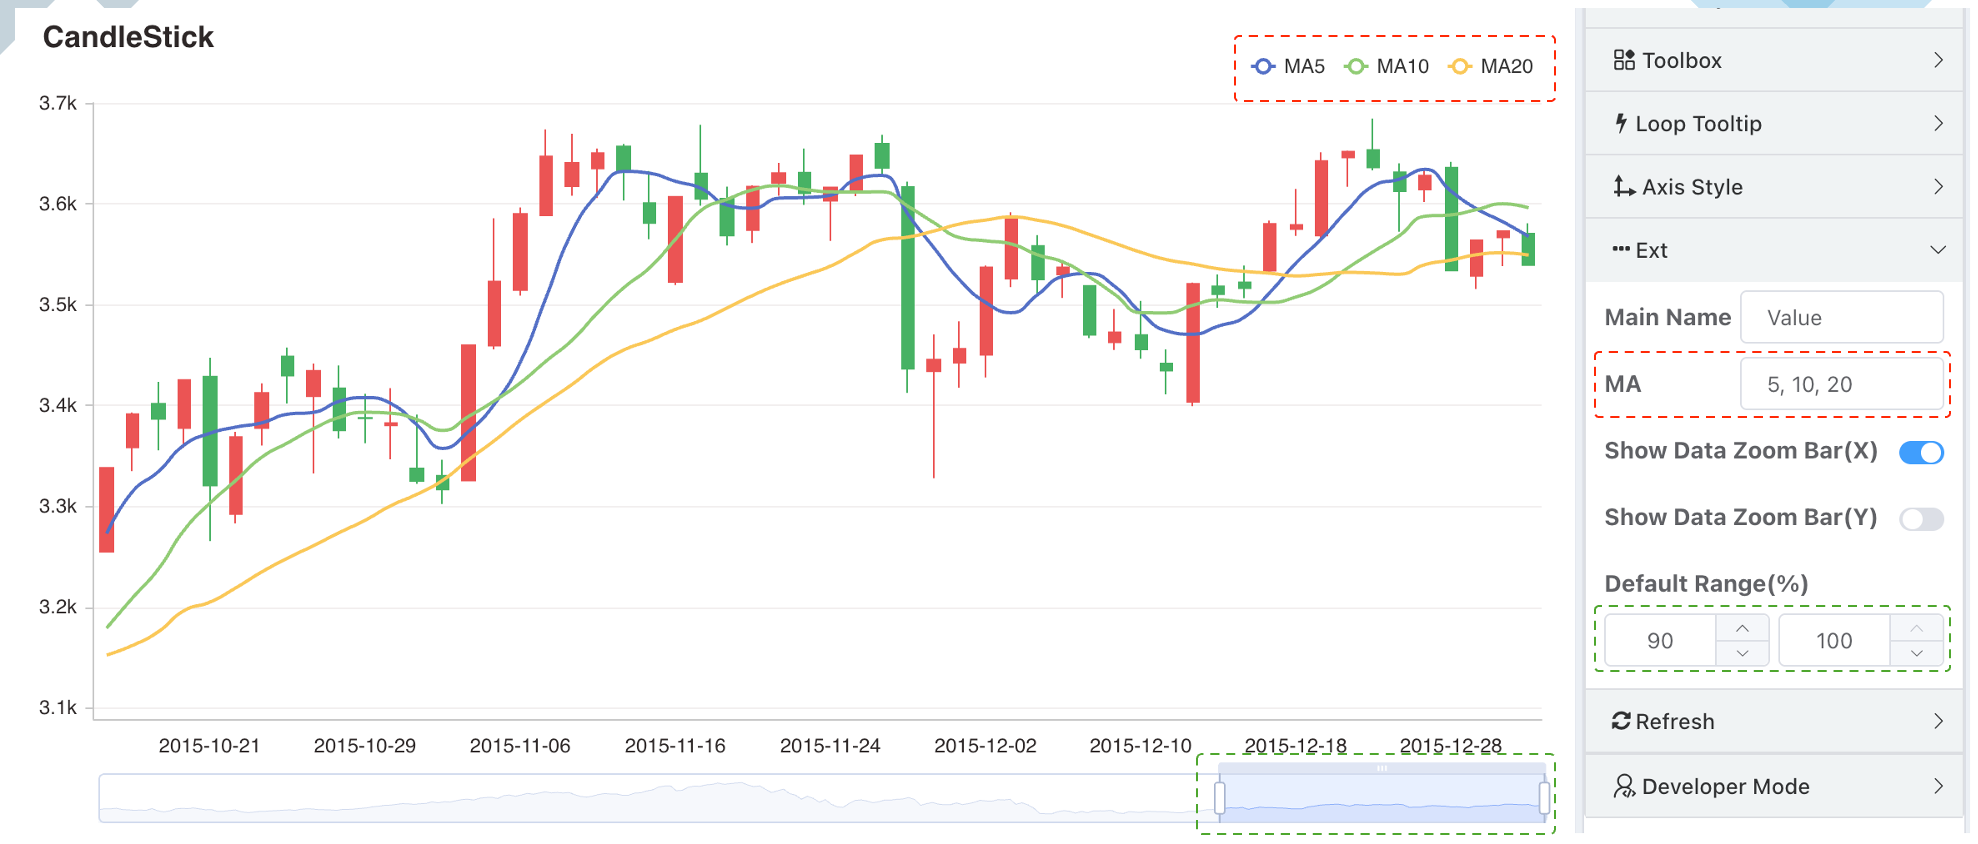
- Configuration Method MA5 and MA10 are displayed by default. Users can input multiple MA configurations separated by English commas.
Focus Configuration
In a Candlestick chart, dataZoom is a commonly used feature for achieving localized focus and zoom on data, allowing users to concentrate on data from a specific time period within a larger range for analysis.
- Default Focus Range: The percentage range that is focused on during initial loading.