
ChartsChart Detail
Waterfall Chart
Waterfall Chart
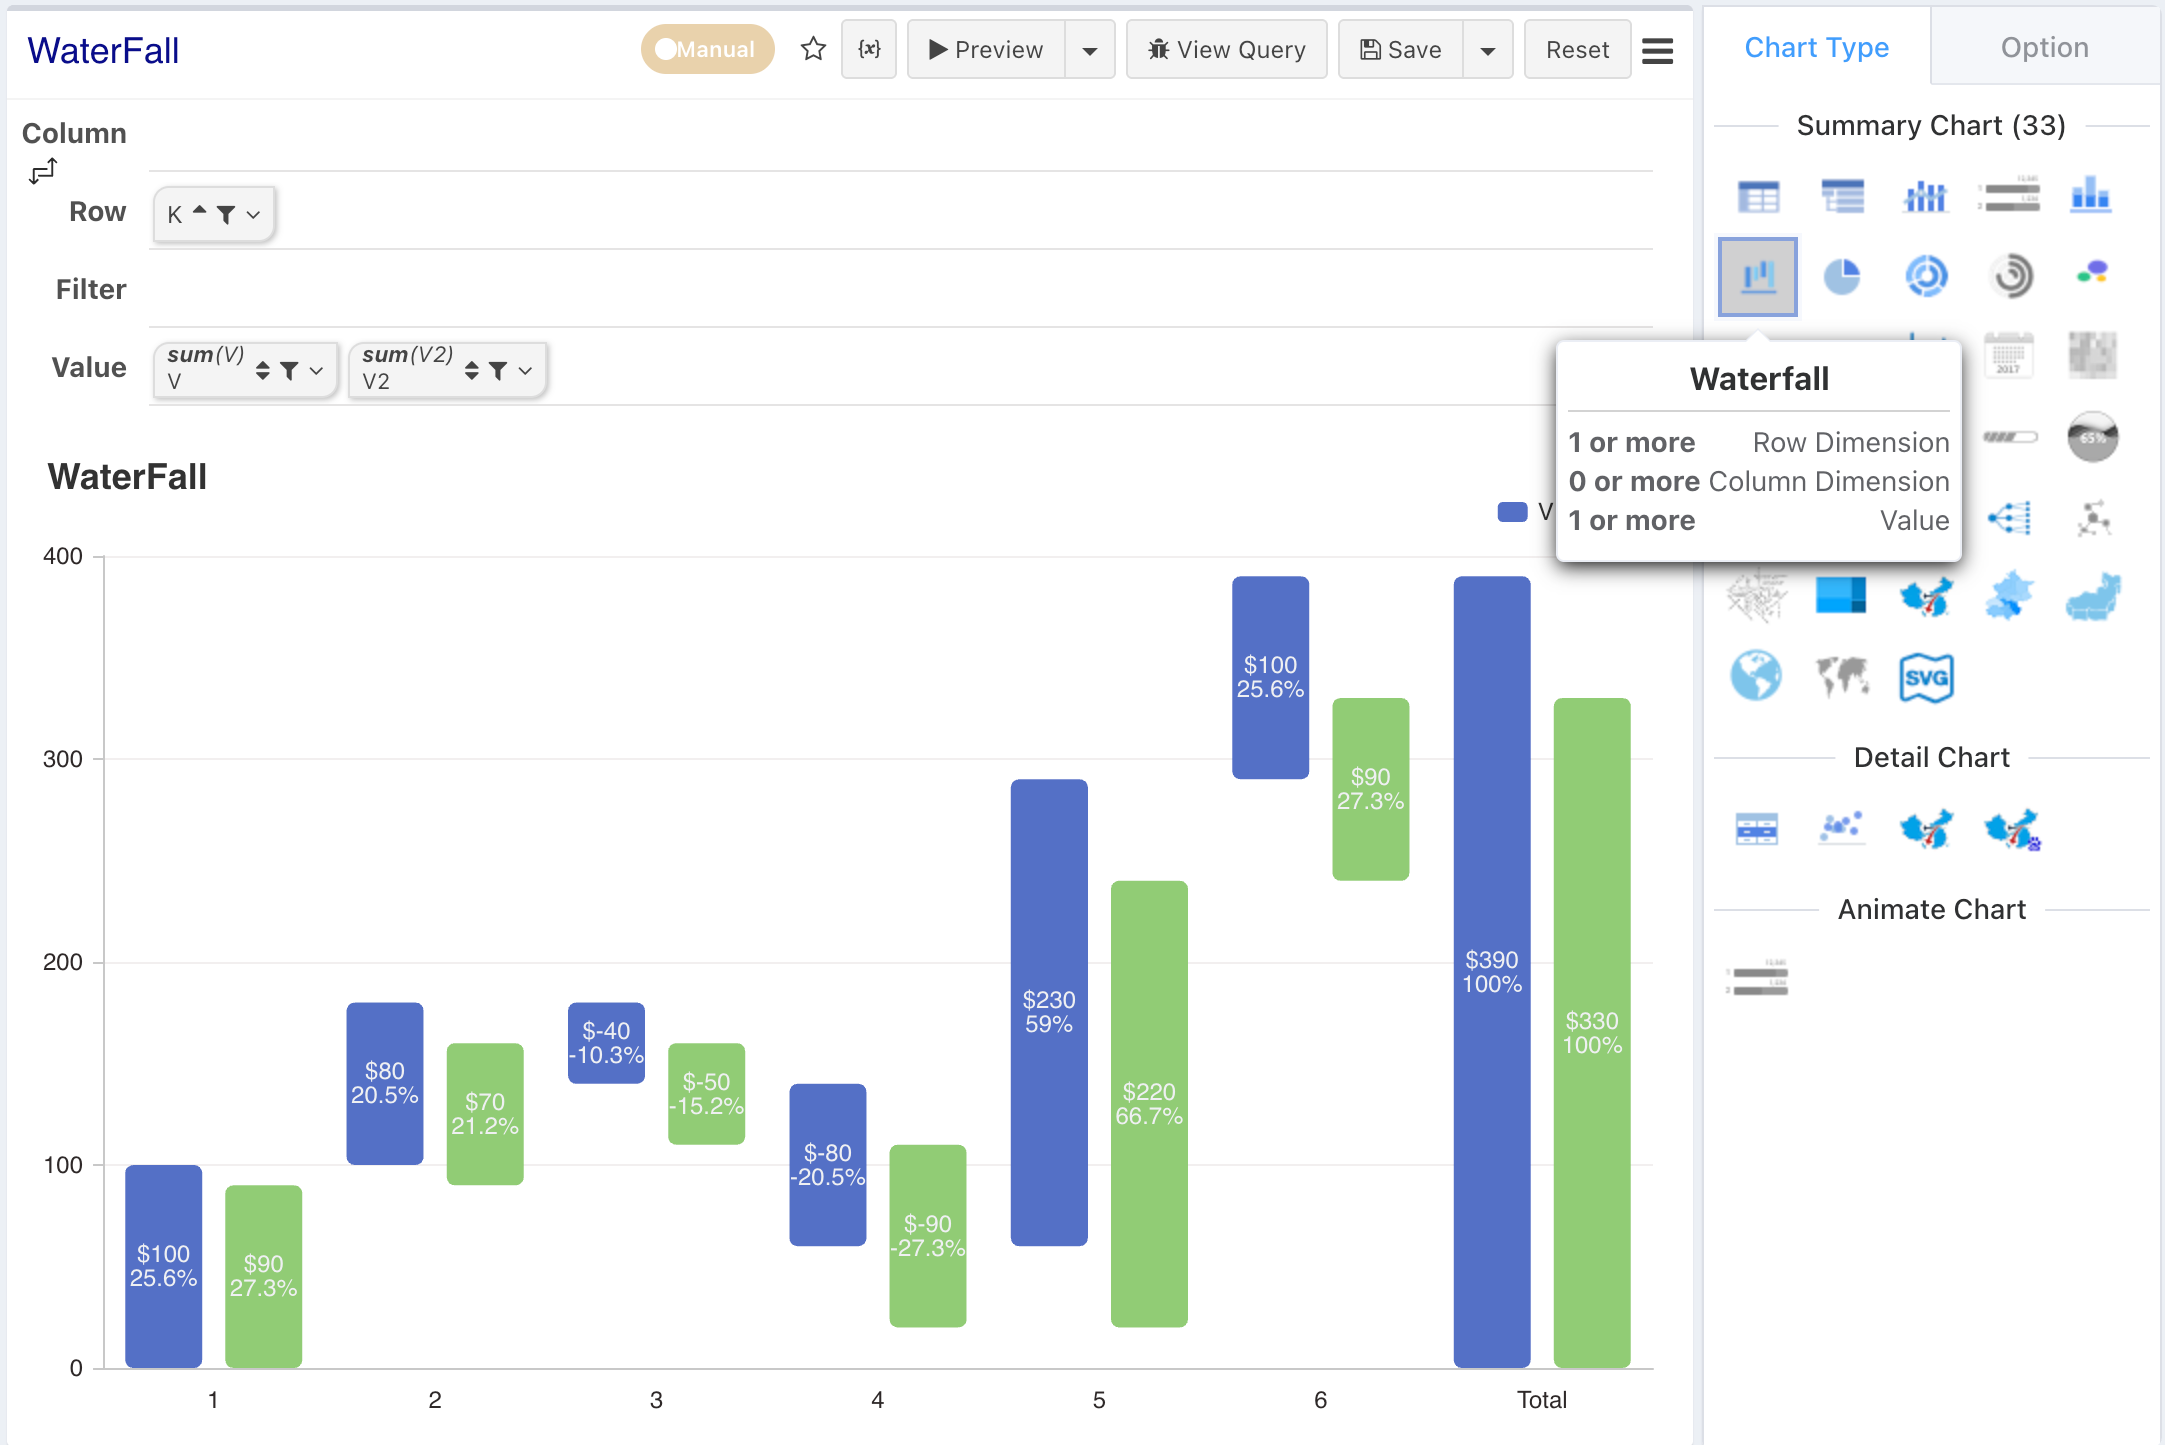
The Waterfall Chart is commonly used to display the cumulative change of values. Here are its typical use cases:
Waterfall Chart Use Cases
-
Financial Analysis
- Income and Expenses: Show how gross income gradually reduces to net profit.
- Cost Analysis: Analyze the contribution of various costs to total cost.
- Budget vs. Actual: Compare differences between planned budget and actual expenditure.
-
Data Change Tracking
- Increase/Decrease Analysis: Display staged changes from an initial value to a final value.
- Time Series: Track cumulative value changes over a period.
-
Business Performance Analysis
- Sales Contribution: Analyze the impact of products, regions, or departments on total sales.
- Market Share: Show the effect of competitors entering or leaving the market.
-
Project Management
- Progress Tracking: Show staged progress of task completion.
- Resource Allocation: Understand the increase, decrease, and usage of resources.
-
Other Scenarios
- Inventory Management: Show inventory increase/decrease changes.
- Policy Impact: Analyze the impact of policy adjustments on revenue or costs.
Configuration Requirements
| Design Area | Chart | Requirement |
|---|---|---|
| Row Dimensions | X-axis | Place 1 or more dimension nodes |
| Column Dimensions | Category | Do not place |
| Measures | Place 1 or more measure nodes |
Axis Style
Please refer to Axis Style Configuration