ChartsChart Detail
Treemap
Treemap
Treemap and Sunburst have similar use cases. They are suitable for scenarios that need to intuitively represent "from whole to part" or "top-down hierarchical decomposition." Compared to Sunburst, Treemap can utilize canvas space more efficiently.
| Design Area | Chart | Requirement |
|---|---|---|
| Row Dimensions | Multiple row dimensions represent multiple levels, using color to distinguish categories | Place one or more dimension nodes |
| Column Dimensions | Split series | Place zero or more dimension nodes |
| Measures | Use area to represent values | Place 1 or more measure nodes |
Display Levels
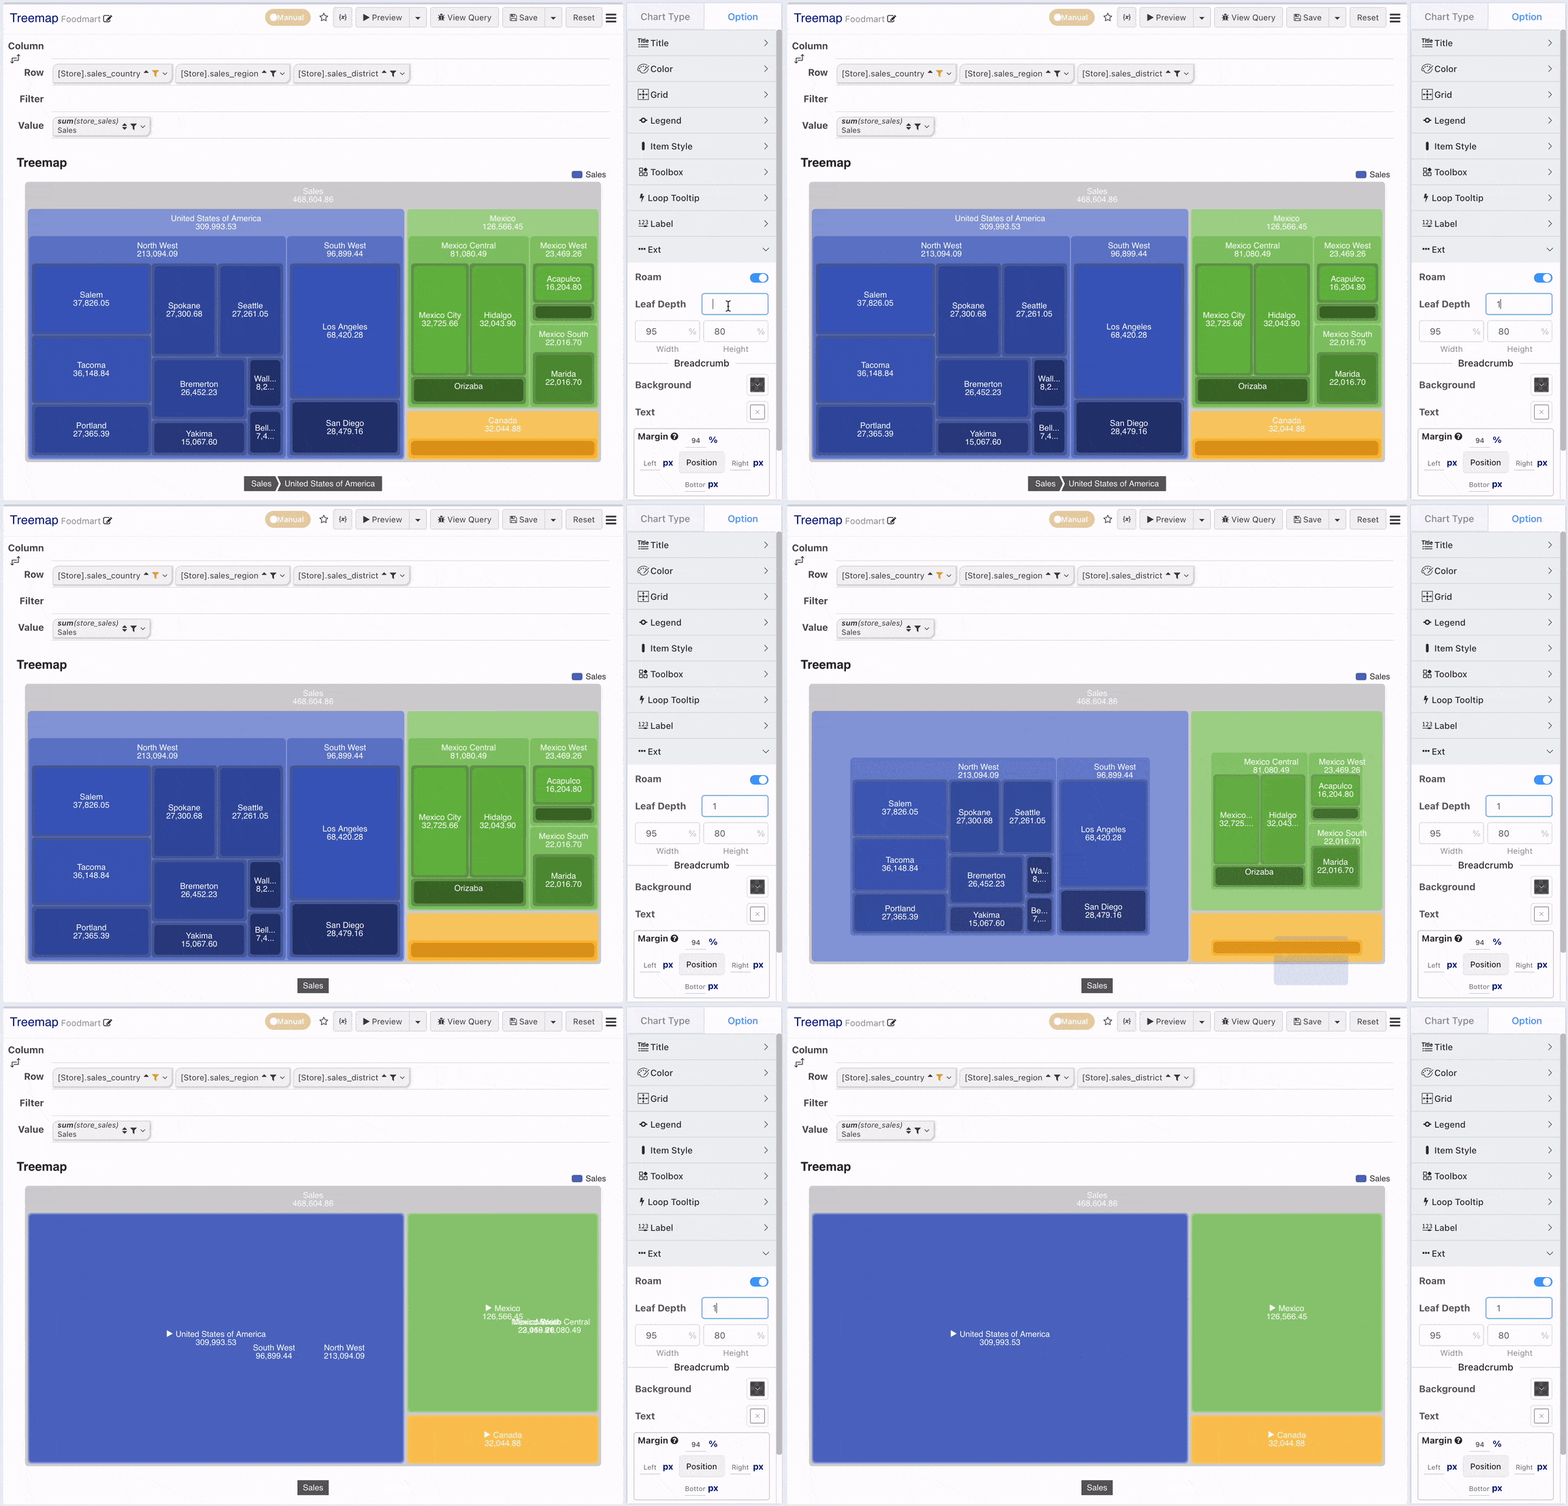
By default, up to 4 levels are displayed. You can adjust the number of levels displayed initially.
Multiple Series
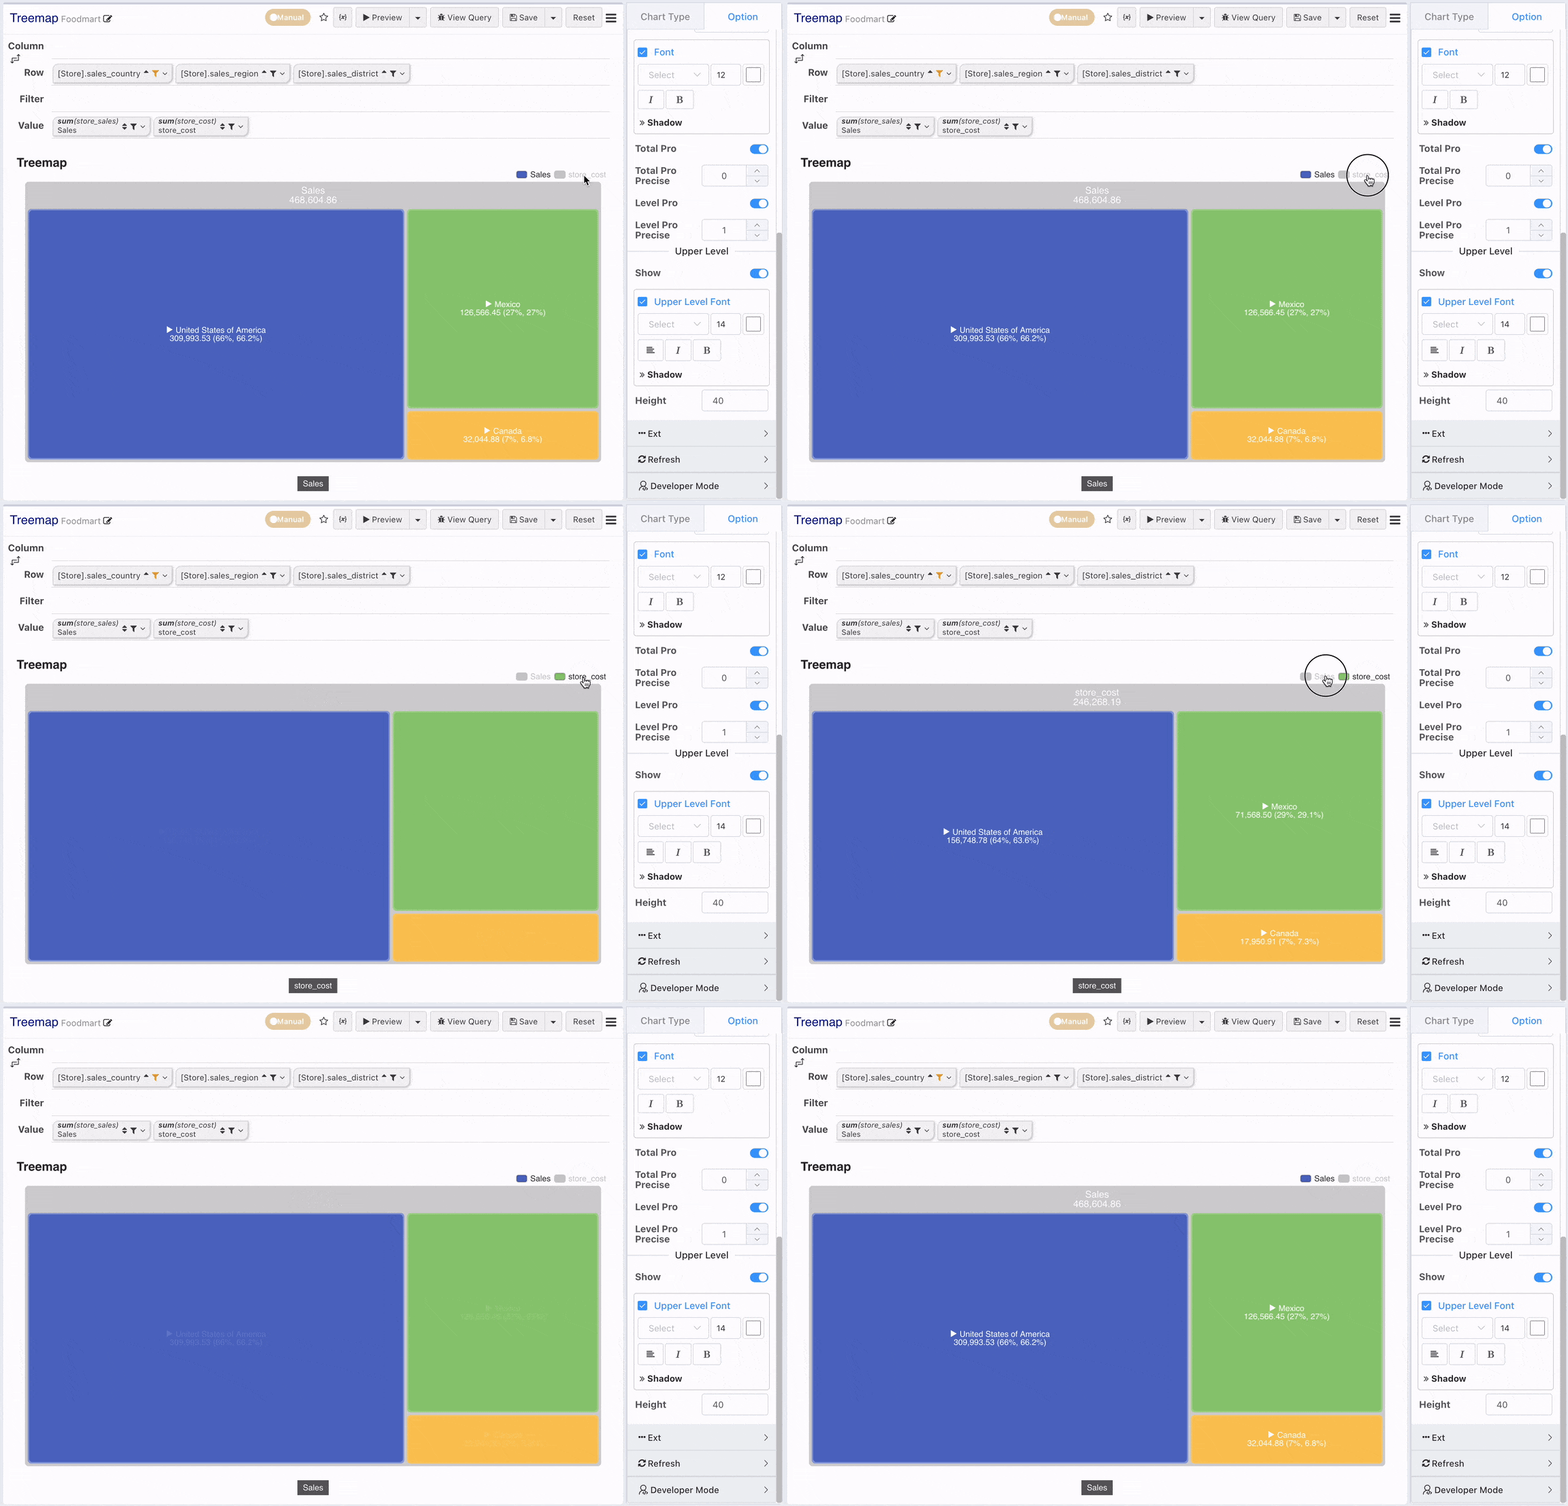
When there are multiple series, they can be switched via the legend.