Sankey Diagram
Sankey Diagram
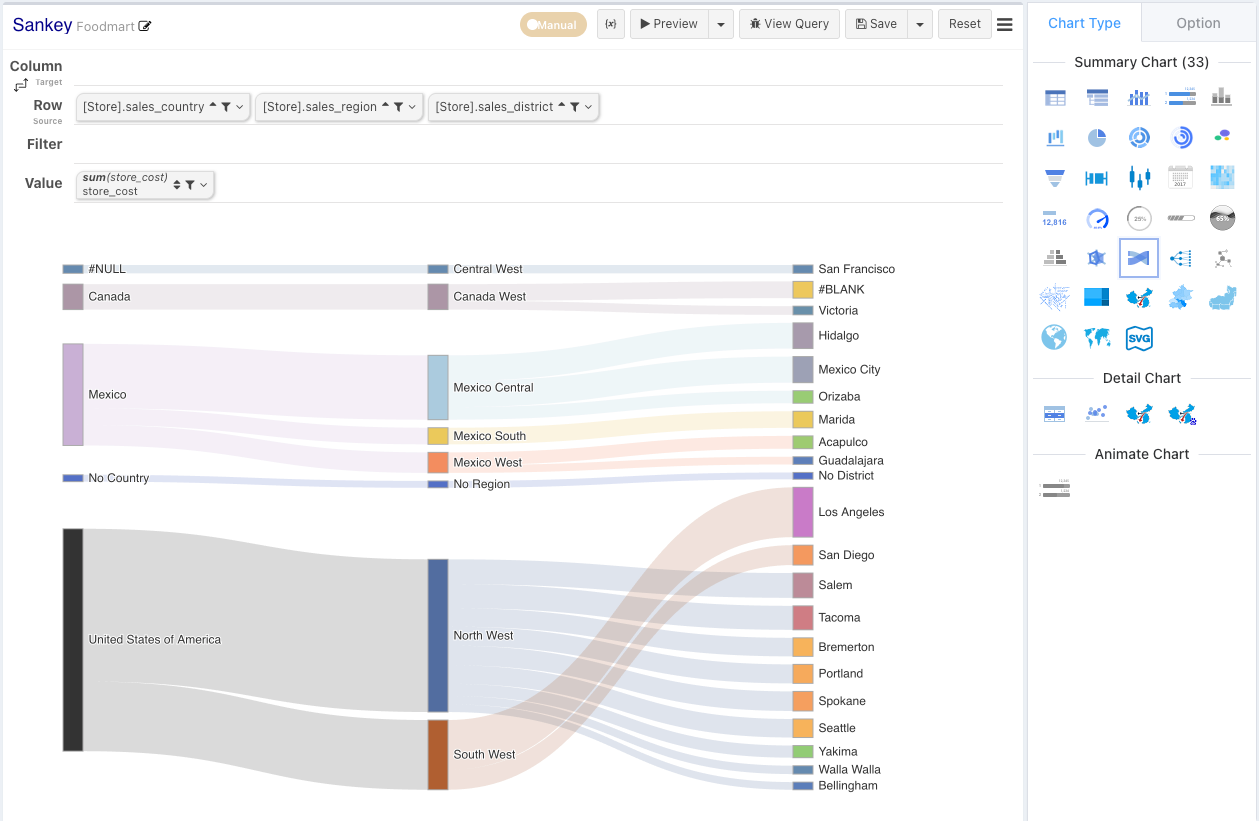
The Sankey Diagram is a type of flow diagram used to depict the flow of values from one set to another. The width of each branch corresponds to the magnitude of the data flow.
Configuration
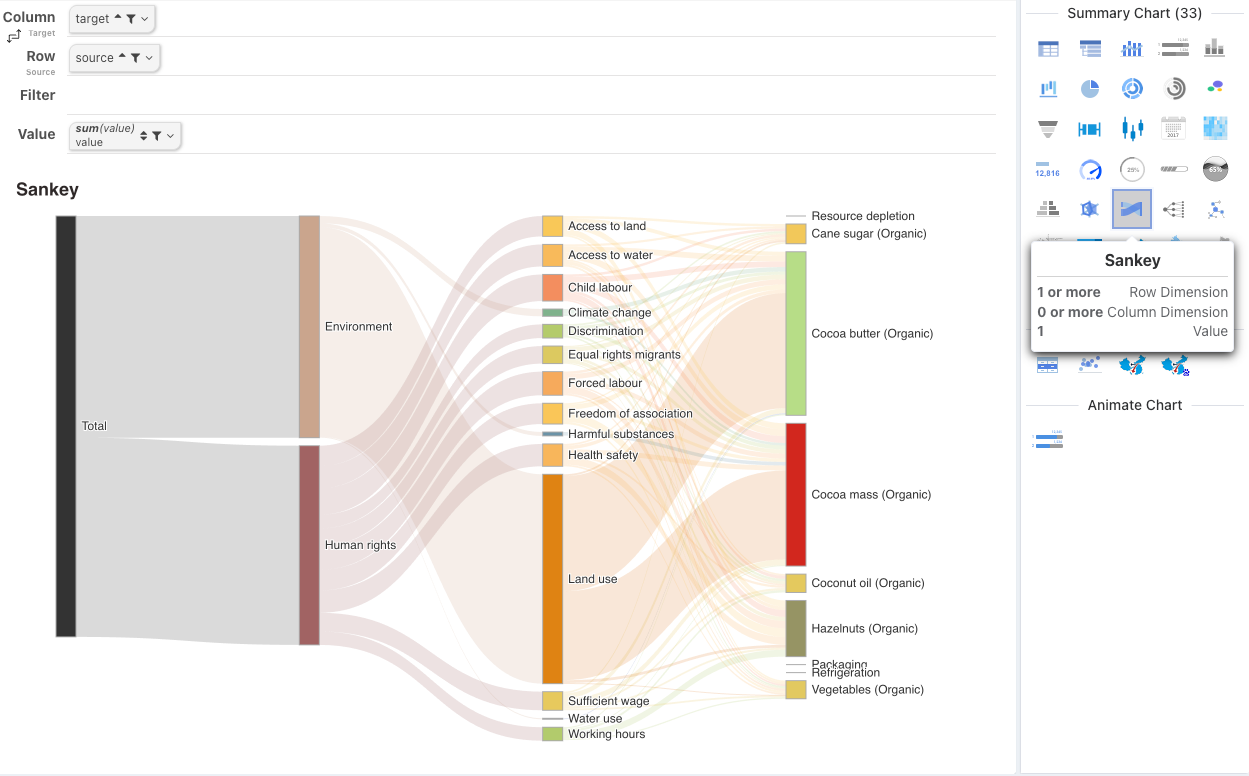
Using row values and column values as nodes, and each cell as a connection from row to column to draw the diagram. A cross table can be considered as a connection matrix.
Why Does My Sankey Diagram Have No Layers?
Many people ask why their Sankey diagram has no layers. Actually, the layers of a Sankey diagram are related to the data itself. If the data contains A → B and B → C, where B is an intermediate layer, it will automatically adapt to create two layers. Also, note that ECharts has a data requirement: the data cannot form a cycle (A → B ... → A).
Sankey Level Parsing
Row to Column
When column dimensions exist, parse from the row dimension combination to the column dimension combination.
Two Row Dimensions
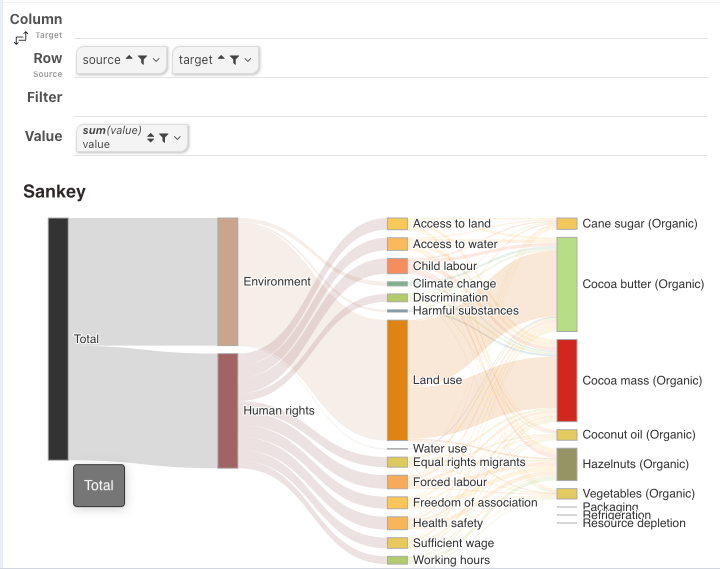
Two row dimensions = one row dimension + one column dimension: Treat the two row dimensions as Source Row Dimension + Target Column Dimension. This pattern is suitable for simple two-node flows.
Multiple Row Dimensions Parsing
When there are no column dimensions and 3 or more row dimensions, parse them according to the hierarchy of row dimensions.