ChartsChart Detail
SVG Map
SVG Map
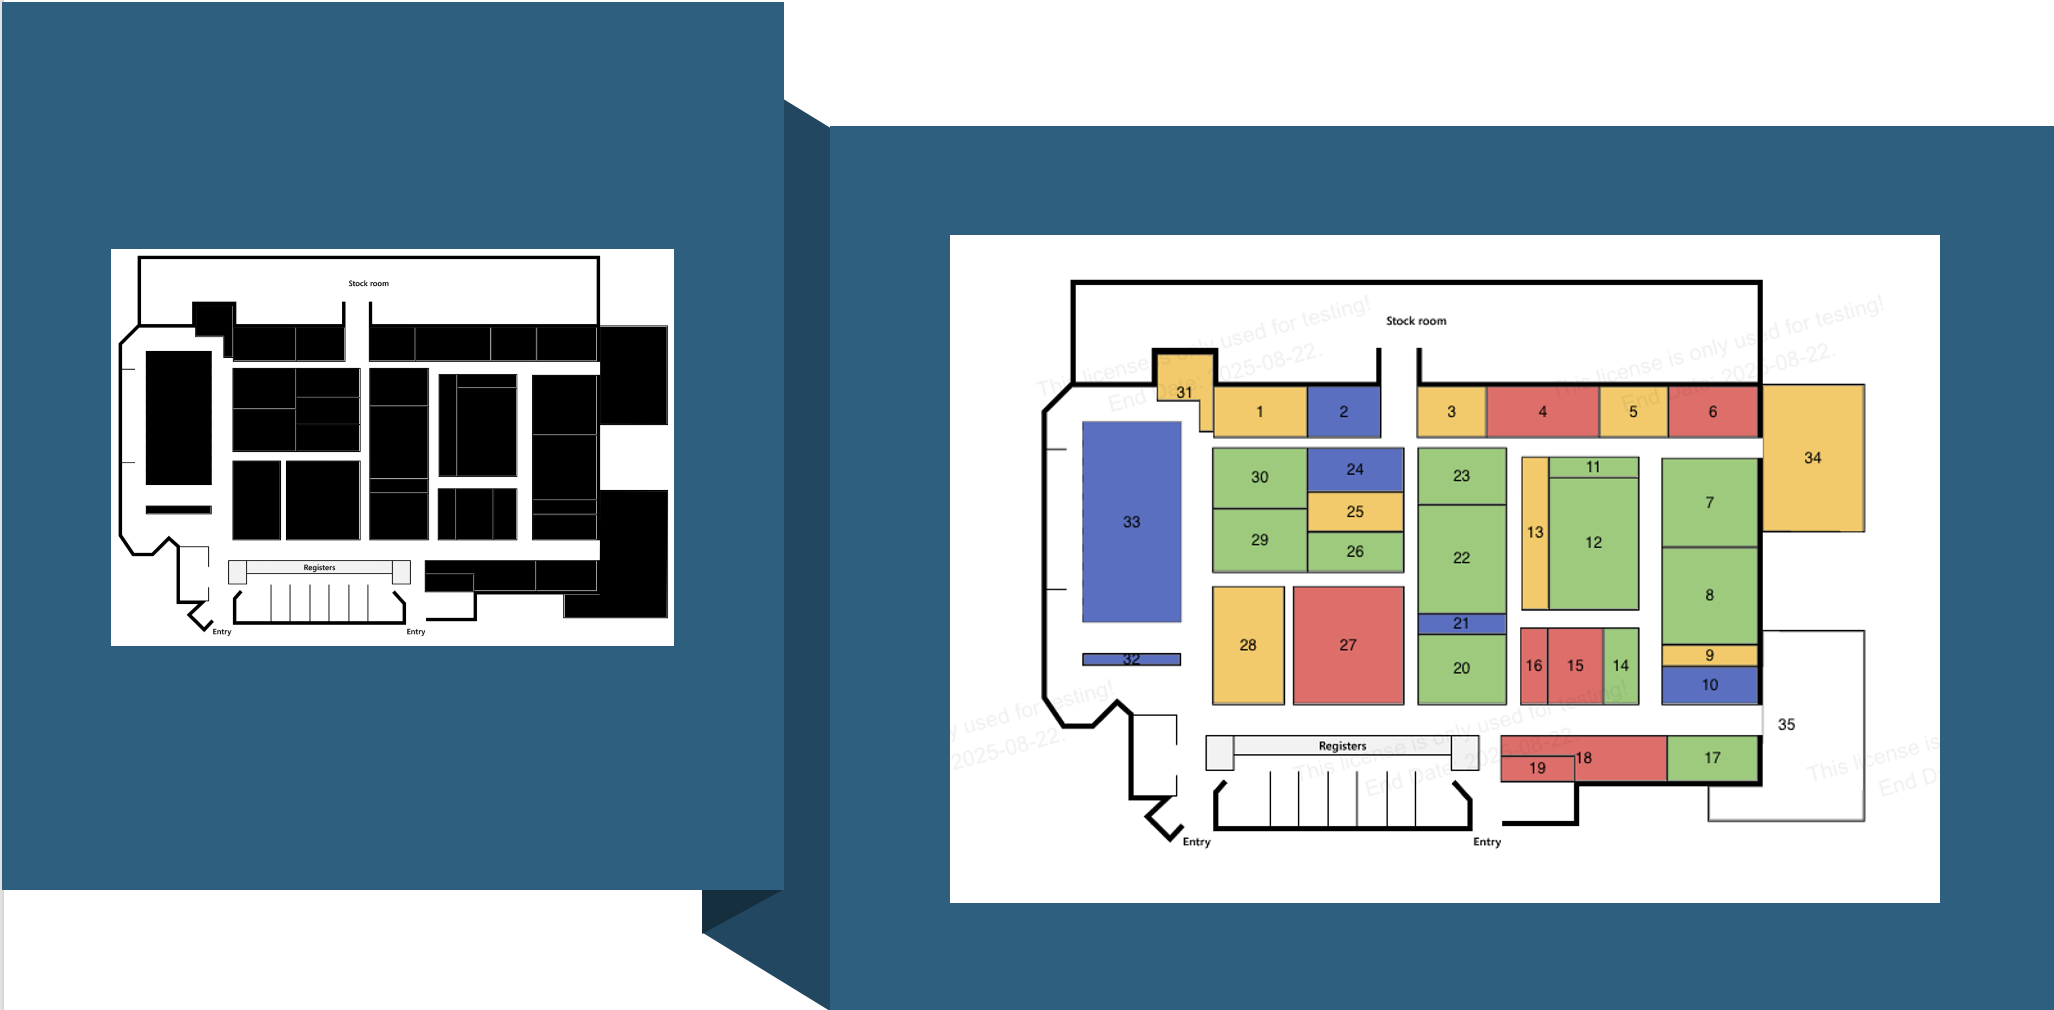
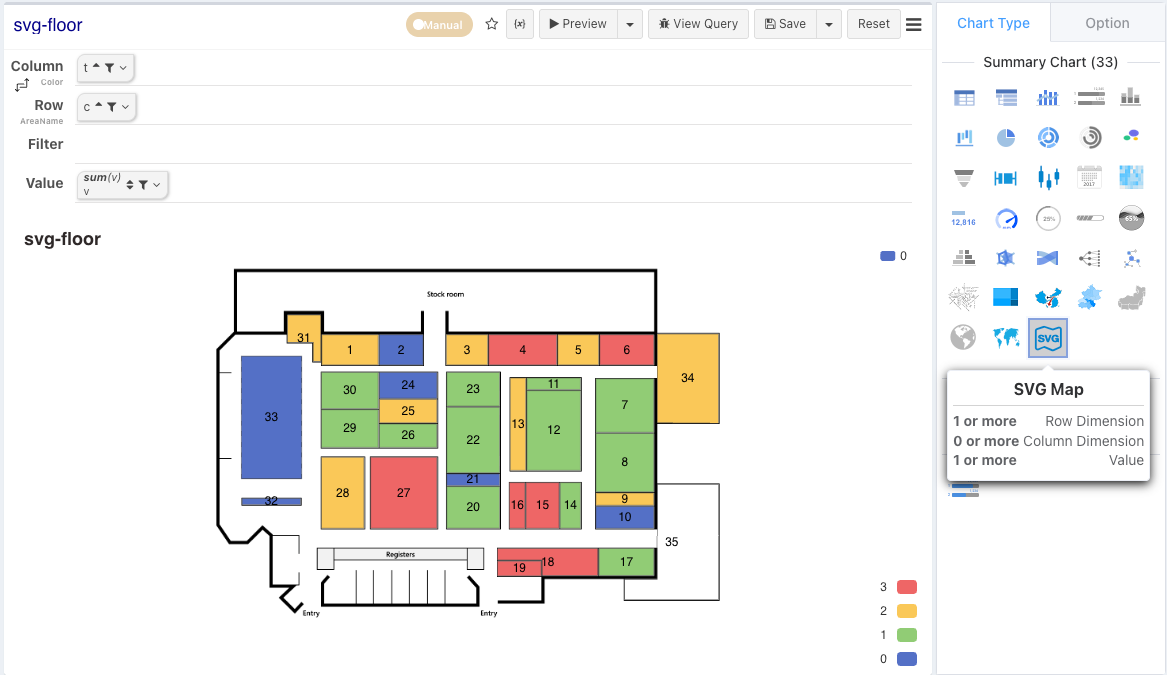
An SVG map is a regional map that uses an SVG image as the base map. Compared to conventional maps, it offers higher customizability, making it suitable for scenarios such as shopping mall maps, warehouse maps, or hand-drawn maps as base maps.
Instructions
- In the configuration panel's background image option, upload an SVG as the base map. The SVG must have name attributes on the area elements you wish to annotate.
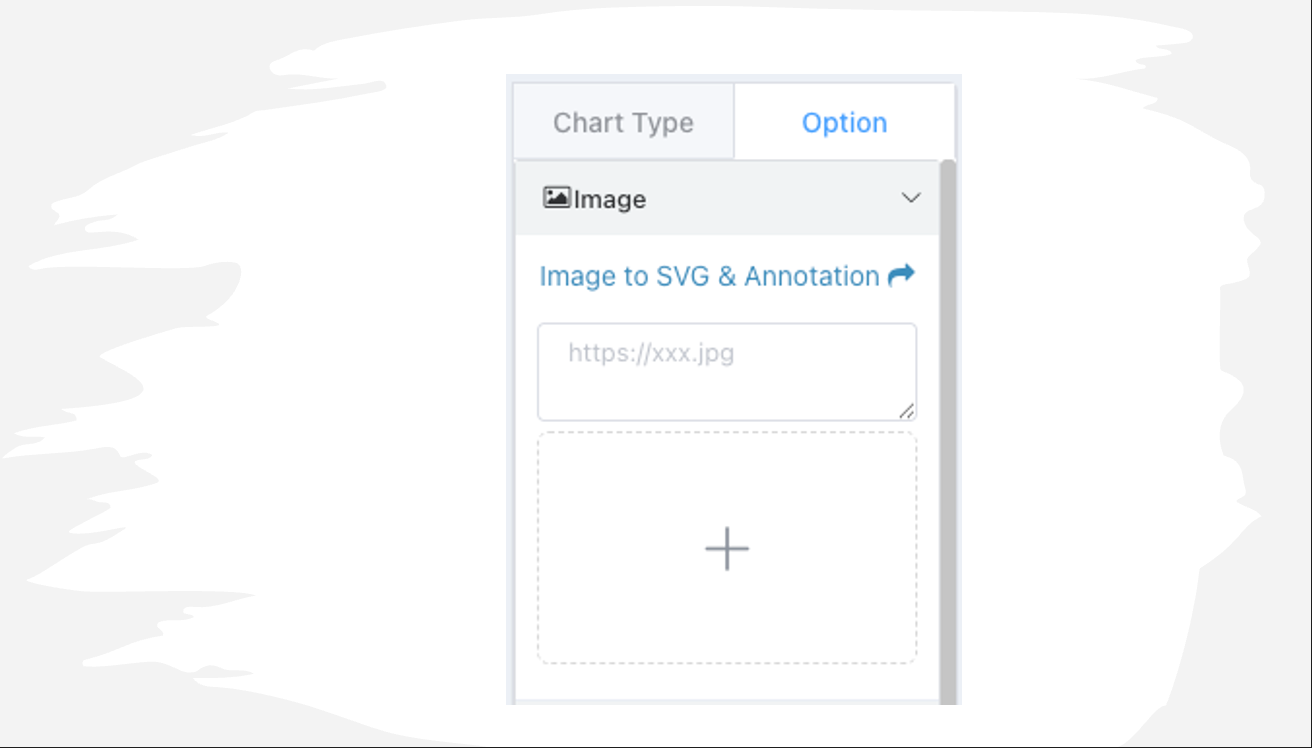
- If you do not have SVG materials, do not worry. You can use the synoptic.design tool to upload a regular image as the base map, mark regions on the image, and then convert it to SVG. You can click the link in the background image section to jump to the image-to-SVG conversion link.
- When annotating in synoptic.design, you only need to fill in the second field: AreaName(to display).
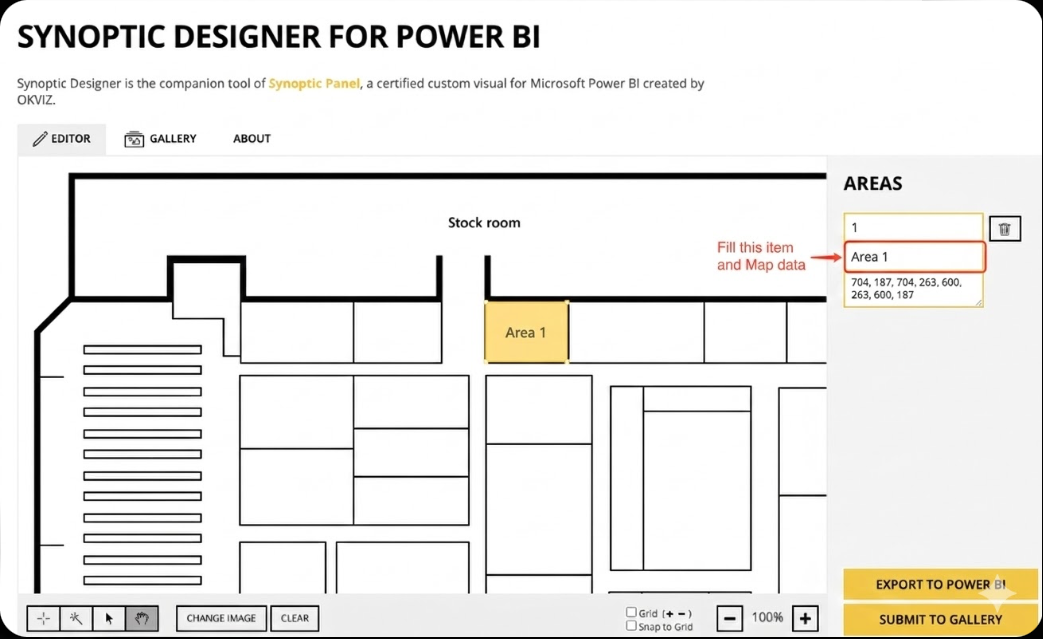
- After editing, click
EXPORT TO POWER BI, then right-click and save the SVG to your local machine in the pop-up window.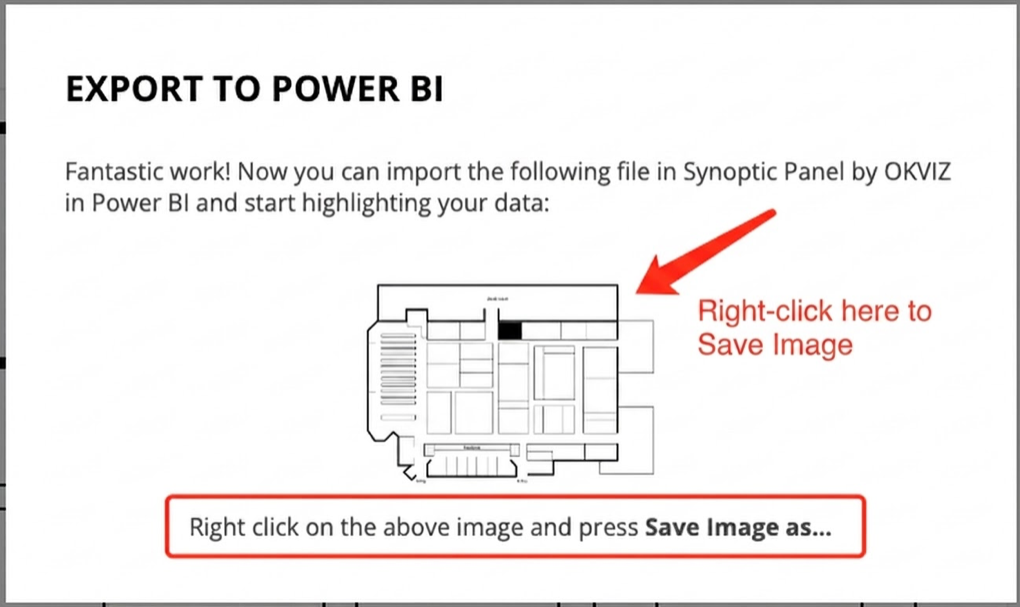
Grouping Areas by Column Dimension
In addition to mapping color intensity based on numerical values, it also supports distinguishing color blocks based on column dimensions.